Multi-Criteria Decision Making methodology for the Selection of
Cargo Hold Coating for Bulk Carriers
Ioannis Arabatzis
a, Ioannis Skordas
a. Dimitrios Skordas
a, Lampros Nikolopoulos
b, Petros
Kousiounelos
c, Evangelos Boulougouris
baNanoPhos Marine Coatings SA
Sci. & Tech. Park of Lavrio, Lavrio 19500, Greece
bDepartment of Naval Architecture, Ocean and Marine Engineering University of Strathclyde
Henry Dyer Building, 16 Richmond St, Glasgow Metropolitan Area G1 1XQ, United Kingdom
cStarbulk Carriers Corporation
Ag. Konstantinou 40, Maroussi 15124, Athens, Greece
0.
Summary
The coating of cargo holds of bulk carriers constitutes the primary source of protection of the vessel’s structure against corrosion, while at the same time ensures the proper cleanliness in the holds and thus the protection of cargoes against contamination. Therefore, it plays a significant role in the vessel’s commercial operation, trading and lifecycle, making the correct selection of the coating system very important for the shipowner throughout the lifecycle of the vessels (design and construction and operation) and especially during the scheduled maintenance and recoating of the vessel’s cargo holds in dry-dockings. The paper herein presents a methodology for ranking and assessing coatings in a systematic, quantitative and qualitative way in terms of the desired merits of the ideal coating system. It demonstrates the methodology’s application using three entirely different coatings and evaluating their performance at both laboratory and full scale.
1
Introduction
2
Corrosion in Bulk Carriers and the Importance of Cargo Hold Coatings
Bulk carriers transport a wide range of bulk commodities. Major Bulks include Iron Ore, Coal and Coking Coal, Grains (Oats, grain, heavy grain, barley, wheat, corn, maize etc), Agribulks, Sugar (in bulk and bagged), Fertilizers (phosphates, rock phosphates, fertilizers, urea, ammonium nitrate etc), Metals and Minerals (Manganese ore, concentrates, pig iron, cement, bauxite, petcoke, coke) and Steel Products (scrap, steel billets, steel coils, steel pipes) according to Stopford [3]. While large vessels of above 170,000 deadweight tons such as Capesize (175-182,000 DWT), Newcastlemax (200-210,000 DWT) and Very Large Ore Carriers (VLOCs) (>250,000 DWT) are employed almost exclusively in the carriage of iron ore and coal, smaller size vessels have a more diversified cargo list due to the bigger availability of smaller sized cargo parcel. For example, geared vessels such as Handysize (<40,000 DWT), Handymax (40-50,000 DWT), Supramax (50-55,000 DWT) and Ultramax (60-64,000 DWT) can carry all of the originally mentioned cargoes from metals and minerals to fertilizers, Sulphur, Iron Ore to Grains and sometimes even industrialized goods (heavy machinery etc). Similarly, medium sized vessels with no cranes (gearless) such as Panamax (~75,000 DWT), Kamsarmax (~82,000 DWT) and Post-Panamax (90-98,000 DWT) are utilized for the trade of coal, grains and metals and minerals (particularly bauxite and petcoke).
The nature and sensitivity of these cargoes varies substantially. Grain cargoes as they are destined for the food industry are very sensitive to contamination from the cargo hold surfaces [1]. Coal cargoes create extensive stain areas on the cargo holds that are difficult to be cleaned while minerals such as bauxite and petcoke induce heavy damages on the cargo hold coatings during their loading as they are in granular (medium grain) due to the high loading rates and the corresponding abrasion on the contact areas [2]. Aggressive cargoes like sulphur can damage severely the cargo hold coating [3] while cement cargoes in case the hold humidity is not monitored and kept low, build up and stain permanently the hold surfaces [2]. On the other hand, for all cargoes, during discharging the use of grabs to unload and bulldozers in order to gather and stow the cargo in one place can damage the coating at the hoppers and stools areas.
Therefore, the medium and smaller sized vessels pose the most challenging environment for the cargo hold coating system. It should normally be able to withstand the above adverse conditions for its entire lifetime which is typically about 60 months (5 years) coinciding with the vessel’s special survey and dry-docking cycle. However, as coating is not a Class item, this interval is subject to the shipowner’s discretion and planning.
Garbatov and Soares have studied the corrosion rate in bulk carriers [4, 5]. Their model assumes that the corrosion initiation coincides with the coating breakdown and the wastage (corrosion depth) increases exponentially with time (in years) up to a time it reaches asymptotical to a depth of 60% of the original coating, as the wastage built on the plate surface acts as a protection from this point. Furthermore, the issue of corrosion and its correlation with common, “in-service” structural failures in bulk carriers has been addressed by IACS in Guideline No. 76 [6].
The ultimate longitudinal strength of bulk carriers that have corroded structures has been studied by Paik et al. [7]. They employ different corrosion models (similar to Garbatov and Soares) in order to investigate the longitudinal strength properties of corroded bulk carriers as a function of ship age and establish acceptance criteria for heavily corroded structural members. The reduction in the ultimate strength is assessed for the case of uniform corrosion in the form of plate thickness reduction and local corrosion such as pitting is not taken into account. The reduction of the section modulus is steeper for the inner bottom structure than the deck and can go up to 20% after 20 years of operation without taking into account the effect of fatigue on ship’s structure. However, the ultimate hull girder will be reduced by up to 30% and 10% after 20 years in service in hogging and sagging respectively. Without steel renewals and after 30 years in operation, the ultimate hull girder strength in hogging will decrease as much as 45% from the original.
hull structures of the bulk carrier fleet as well as due to cargo liquefaction accidents. Due to the high number of newbuilding additions to the fleet in the years 2005-2015 this number has dropped. However, the recent casualty of the Very Large Ore Carrier (VLOC) “Stellar Daisy” in April 2017 [8] with the loss of the entire ship, cargo and the 22 lives of its crew is a strong reminder of the need for increased structural reliability in bulk carriers.
It is therefore the belief of the authors that the control of the corrosion of bulk carriers structural members is directly correlated to the reliability of the latter and thus the safety of the vessel. This in turn should increase the requirements for better cargo hold coatings that will reduce the occurrence and time of coating breakdown as well as the transition period from the coating breakdown to the corrosion initiation. A rational methodology which will help to properly assess and rank the cargo hold coatings is necessary.
Baere et.al. [9, 10] studied the alternative approaches to corrosion protection of ballast tanks. Five different cases have been ranked in terms of their total lifetime cost (both capital and operational), with variables the structural steel grade, voluntarily increased scantlings, the paint system, the paint system thickness and quality, the use of anodes and their lifetime as well as the maintenance strategy (steel replacement, recoating etc.). Heyer et.al. [11] examined the microbial corrosion and electrochemical phenomena in ballast tanks (without ballast water treatment systems).
An overview of the current practice of ship painting, elaborating on the various established paint technologies per ship location (outer hull/ antifouling, cargo tanks, cargo holds, ballast tanks, machinery spaces etc.) along with the respective challenges and requirements is given by Berendsen [12]. He also has produced a Marine Painting Manual which is a comprehensive guide for all types of marine coatings and the associated challenges [13], while typical coating defects illustrated can be found in ‘Fitz’s Atlas of coating defects’ [14], among many other literature references.
Guidelines for the corrosion protection of ships for ballast tanks and cargo holds have been published by DNVGL [15, 16], while a guide for choosing correct coatings for the cargo tanks of oil tankers and product/chemical tankers can has been published by Ackerman [17].
3
Cargo Hold Paint Attributes and MADM Methodology
Berendsen [13] indicates that the requirements of a cargo hold painting system should include:
1. Corrosion resistance 2. Wear resistance 3. Impact resistance 4. Scratch Resistance
Expanding the above, the authors propose the below characteristics that can fully entail all the technical properties of the paint for such application and used to rank candidate coating systems. In the parenthesis their optimum value is indicated:
1. Surface Roughness (minimal), 2. Surface Glossiness (maximum) 3. Abrasion Resistance (maximum) 4. Impact Resistance (maximum) 5. Carbon Stain Resistance (maximum)
6. Resistance to Chemicals used for Cargo Hold Cleaning (maximum) 7. Paint Micro-Structure, content and coherence
8. Compatibility with existing coating systems (see below) 9. Compatibility with grain and other food products (see below).
The compatibility with grain and other food products can be seen from the compliance with the US Food and Drug Administration and subsequent FDA certification [20] which is common for all available cargo hold paints in the market. While the commercial paint comparison and point No.8 (compatibility) can be assessed straight forward, the performance in points No.1 to No.7 cannot be determined by the paint material datasheet or safety datasheets. Instead a comparison method that covers all points and can benchmark all types of cargo hold paints is required. The method should be both model and full scale based. Thus, it would remove the risk of applying to large areas of the vessel prior to verification and allow testing in laboratory levelled conditions. On the other hand, it should be able to capture the performance of different paints under the actual operating conditions on board. The methodology should be able to capture the multi-attribute characteristics of the decision-making problem.
Based on the above, a multi-attribute decision making (MADM) methodology is presented for cargo hold paints comprised of the following test scheme:
A. Model Scale Testing at Laboratory Conditions
1. Roughness Measurement as per ISO 4288:1996 2. Glossiness Measurement as per ISO 2813:2014
3. Micro Structure Paint Examination with Scanning Electron Microscopy (SEM) [28], [29]
4. Micro Structure Paint Chemical Composition with Energy-dispersive X-ray spectroscopy (EDS) [30]
5. Abrasion Resistance Test – Rotating/Pulsating Test as per ISO 10545-7:1996 [21]
6. Abrasion Resistance Test – Constant Pressure Rotating Disc as per ISO 10545-6:2010 [22] 7. Hardness Test as per DIN 55945:2016 [23]
8. Impact Resistance Test as per EN ISO 6272-2:2011 [24] 9. Impact Resistance Test as per ASTM D2794 – 93:2010 [25]
10. Stain Resistance Test as per ASTM G20 – 10:2015, modified to the chemicals selection that are most abundant in the cargo holds of bulk carriers.
Following the completion of the above test scheme, a paint test patch has been applied on the hopper areas of a Post Panamax bulk carrier cargo hold as a means of additional verification and benchmarking of the MADM results.
Following the completion of the tests, a ranking procedure has been developed, based on utility functions [32]. This has been successfully applied by the authors in ship design optimization studies [33, 34, 35]. Alternatively, the Analytical Hierarchical Process [36], can be used.
As part of the ranking process the goal set is the choice of the best suiting coating system for painting the cargo holds of a modern bulk carrier. The focus in the herein presented study is exclusively technical and the following objectives are set:
1. Surface Glossiness (maximum) / (SG) 2. Surface Roughness (minimal) / (SR) 3. Abrasion Resistance (maximum) / (AR) 4. Surface Hardness (maximum) / (SH)
5. Resistance to Chemicals used for Cargo Hold Cleaning (maximum) / (CR) 6. Impact Resistance (maximum) / (IR)
7. Carbon Stain Resistance (maximum) / (CSR)
8. Paint Micro-Structure, content and coherence / (SEM)
The compatibility with existing painting systems, in other words the requirements of each coating for additional surface preparation (e.g. Sa1.0 or Sa2.0) blasting has not been included in the decision-making objectives as the coating systems examined herein are all compatible with existing epoxy anticorrosive coatings used as “primer coats” in cargo holds. The coating price has not been examined in the herein proposed methodology as it is a commercially sensitive part that varies from paint maker to paint maker and depends on the current repair and paint market condition as well as the relationship with the potential client. For this reason the price and any other commercial aspects are taken out of the present comparison as it may distort results in the decision making process and the latter is focused on the technical aspects only. However, in the future the price of the coating system (not per liter as other parameters such as spreading rate, volume of solids etc are affecting the consumption) can be used. Additionally, the cost comparison can be done on a separate basis by each independent shipowner as it doesn’t require the resources the herein ranking process does and used in conjunction with the results of this study.
Therefore, the utility of each coating system is defined as per below:
𝑈𝐸𝑃𝑂𝑋𝑌= 𝑤𝑆𝐺∗ 𝑢(𝑆𝐺) + 𝑤𝑆𝑅∗ 𝑢(𝑆𝑅) + 𝑤𝐴𝑅∗ 𝑢(𝐴𝑅) + 𝑤𝑆𝐻∗ 𝑢(𝑆𝐻) + 𝑤𝐶𝑅∗ 𝑢(𝐶𝑅) + 𝑤𝐼𝑅∗ 𝑢(𝐼𝑅) + 𝑤𝐶𝑆𝑅∗ 𝑢(𝐶𝑆𝑅) + 𝑤𝑆𝐸𝑀∗ 𝑢(𝑆𝐸𝑀) (1)
In the above formulation, 𝑤𝑆𝐺 to 𝑤𝑆𝑅are defined as the weights assigned to each objective by the decision maker, are scaled from 0.0 to 1.0 and their summation should equal to 1.0. Furthermore, 𝑢(𝑆𝐺) to 𝑢(𝑆𝐸𝑀) are defined as the utilities of each coating with regards to one each attribute. For each test objective, the coating having the result closest to the optimal (e.g. lowest surface roughness) is assigned a utility of 1.0 which is the maximum that can be obtained for subject objective. The utility of the each other coating for this objective follow a linear distribution as per below formula (for the case of example the surface glossiness objective is assumed):
𝑢𝑖(𝑆𝐺) = 1 −
𝑟𝑖(𝑆𝐺) − 𝑟𝑜𝑝𝑡(𝑆𝐺) 𝑟𝑖(𝑆𝐺)
With 𝑟𝑖(𝑆𝐺) being the surface glossiness result of the i-th coating system, 𝑟𝑜𝑝𝑡(𝑆𝐺) the surface glossiness result of the coating closest to the optimal value and 𝑢𝑖(𝑆𝐺) the utility of the i-th coating system with regards to surface glossiness.
The method used for obtaining the various properties and characteristics and subsequently ranking a coating is universal and can be used for n-number of alternative coating solutions. For the sake of comparison, and due to issues of availability of various paint stocks in Greece, three distinctive coatings of different paint technology and type were selected:
I. Epoxy A: A modified epoxy paint. A hard wearing, surface tolerant, two pack epoxy primer/finish offering corrosion protection in one coat. It is commercially available.
II. Epoxy B: A pure epoxy paint. This is a two-component polyamine cured epoxy coating. It is a fast drying, surface tolerant, hard wearing, high solids, high build product. It is commercially available. III. Epoxy N: A pure epoxy paint with nano-particles for increased impact strength, stain, abrasion and
corrosion resistance. It is commercially available.
Epoxy A and Epoxy B are standard cargo hold paints available in the market. Epoxy N is a new paint product that hasn’t been previously tested in vessel cargo holds. It differentiates from common cargo hold paints by incorporating silicon elastomer nanoparticles in an epoxy matrix. Their structure is described by a soft, elastomer core that can adhere on the resin binder. The core competency of the resulting coating is that even though no abrasion resistance, strength or robustness of the coating is lost, the particles can reversibly act as energy storage units, absorbing the accute pressure of abrasive loads. The particles are permanently bound to the resin binder polymers, due to the binding moieties. They act like nano-springs in the coating. Their existence does not modify the ability of the epoxy coating to adhere on the substrate. The polymer planes and “threads” remain resistant to impact or abrasion; however, much of the damaging energy is absorbed before the coating cracks, flakes or fails. The original corrosion resistance is not affected as well.
4 . 1 SA M P L E PR E P A R A T I O N
The laboratory tests were conducted at the laboratory facility of NanoPhos SA, at Lavrio, Greece. Samples of the two commercial available paints were used. All samples were coloured in the Red Brown shade. The paints were applied on marine steel plates sized 10cm x 10cm, with 2mm thickness of A 131 ABS Grade A material. The steel plates had been sand blasted following the Brush off Blast SSPC-SP10 (SSI-Sa2 1⁄2). At least 95% of total surface area was set free of all visible residues, and the remainder was limited to very light discolorations. This is very close to the actual quality of surface preparation expected during maintenance work. Blasting profile was determined at 60±10 μm.
Figure 1- Shot Blasting Profile of samples
N (IDs ENV1 to ENV14), 15 samples of Epoxy A (I1 to I15) and 14 samples of Epoxy B (IDs J1 to J14) were prepared.
In total 2 coats were applied with a target wet film thickness of 200μm each corresponding to a dry film thickness of 150μm each and a total theoretical dry film thickness of 300μm for the cargo hold coat and 450μm for the entire sample including the primer. It should be noted that such comparisons were done with the same Dry Film Thickness (DFT) for all samples and not at the suggested Dry Film Thickness (DFT) of each paint manufacturer. The most common coating system thickness in cargo hold applications of bulk carriers is two coats of 125 μm each. The selected system thickness of 150 μm for each coat. The samples were left for seven days in ambient temperature to allow full curing. All coatings were easy to apply and there were no problem for the application/preparation of the samples.
Figure 2- Epoxy B Application
4 . 2 SU R F A C E CH A R A C T E R I S T I C S A N D RO U G H N E S S AS S E S S M E N T
The first step in assessing each coating is to examine its surface characteristics and roughness profile. At this stage, all samples were individually identified and their thickness, roughness and glossiness were determined. Table [1] summarizes the relevant findings:
Epoxy N Epoxy B Epoxy A
Gloss
(@60o) Roughness (μm) NDFT (μm) (@60Gloss o) Roughness (μm) NDFT (μm) (@60Gloss o) Roughness (μm) NDFT (μm)
Average: 55,7 0,394 612 Average: 20,7 0,798 593 Average: 17,2 0,754 621 Std Dev: 2,2 0,085 27 Std Dev: 0,9 0,074 28 Std Dev: 1,3 0,114 46
Table 1 - Gloss, Roughness and Nominal Dry Film Thickness of Coating Samples
The Nominal Dry Film Thickness (NDFT, μm) indicates the total film thickness of the coating system, including the EPR primer. Considering that the thickness of each of the coatings was ±150 μm (2 x EPR 150 μm & 2 x Cargo Hold Coating 150 μm), the resulting average thickness of the sample was around 600 μm. The experimental results are in accordance to theoretical surface paint coverage values in the respective paint technical data sheets. It should be noted that the above observed DFT are achieved in laboratory conditions under much better control of paint flow when compared to the actual shipyard conditions, especially in the case of maintenance (dry docking). In real-life, full scale applications the DFT variance is larger with areas of higher and lower DFT respectively [13]. However, efforts from the attending paint maker representative are always made to minimize this effect which due to the environmental conditions is unavoidable.
Roughness was determined by using a Surftest SJ-210 instrument, by Mitutoyo. The instrument involves a stylus tip that follows the roughness profile at a 2cm measuring length [27]. The determined roughness value corresponds to Ra, which is the arithmetical average value of all absolute distances of the roughness profile from the centre
line within the measuring length. For each of the samples, three measuring lengths were determined and their average is presented in Table 1.
Figure 3 - Definition of roughness values R ([19]])
The roughness value Ra (arithmetic mean deviation of the roughness profile) is always lower than the RZ (average
vertical distance between peaks and valleys). For comparison reasons, the value Ra is considered the ideal
parameter as it excludes local imperfections and provides a fair roughness outline value of the surface. Roughness of the surface is considered a very significant merit, as it is directly linked to the dirt pick-up ability of the surface itself. Smoother coating surface tends to uptake less dirt and thus require less cleaning effort. The effect of reduced roughness is also clearly correlated to the gloss level as seen from the respective measurements.
a surface and measuring the amount of reflected light at an equal but opposite angle. For this study, GL0030 TQC PolyGloss 60o/20 o/85o gloss meter was used. The incident light beam was set at 60o.
Even by naked eye, the Epoxy N sample appears glossier compared with Epoxy A and Epoxy B samples. Table 1 indicates that the gloss level of Epoxy N samples are 300% glossier than Epoxy A samples and 250% glossier than Epoxy B samples.
Figure 1 - Gloss mechanism on coatings – correlation with surface roughness
The gloss level of a paint is defined by two critical factors (Fig. 15): a) The particle size of the fillers and pigments contained within the paint and b) The ratio between the binder (polymer, epoxy resin) and the solid fillers/pigments. The richer the paint in binder, the glossier the end coating. The surface glossiness is a merit heavily correlated to the roughness as should be considered as a product characteristic of the roughness. It can be used straight forward to assess the stain resistance and more importantly, the easiness of cleaning of a cargo hold coating system since the increase of the gloss level reduces the intensity of “valleys” and “mountains” that can accumulate dirt and enhances the practical, easy-cleaning characteristics of the coating. From table [1] it is evident that Epoxy N is 70% glossier (as also witnessed by visual inspection) due to the use of nanoparticles and a highly binded paint matric.
4 . 3 MI C R O S C O P I C AN A L Y S I S
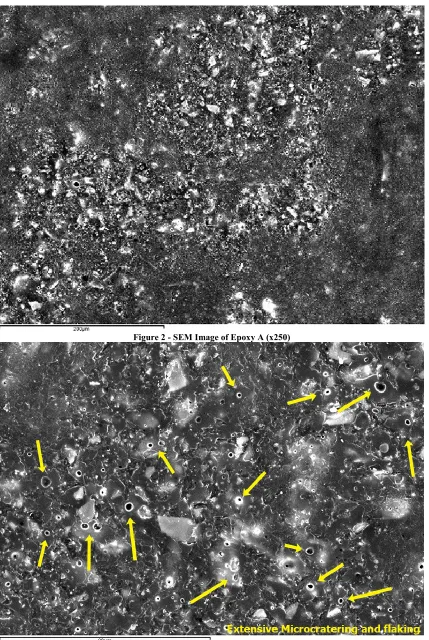
Figure 2 - SEM Image of Epoxy A (x250)
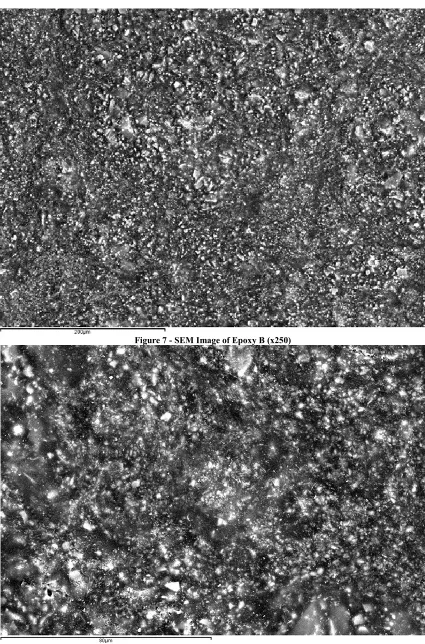
Figure 7 - SEM Image of Epoxy B (x250)
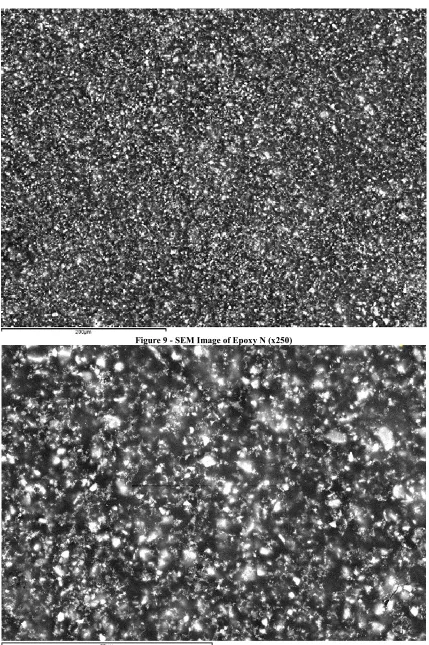
Figure 9 - SEM Image of Epoxy N (x250)
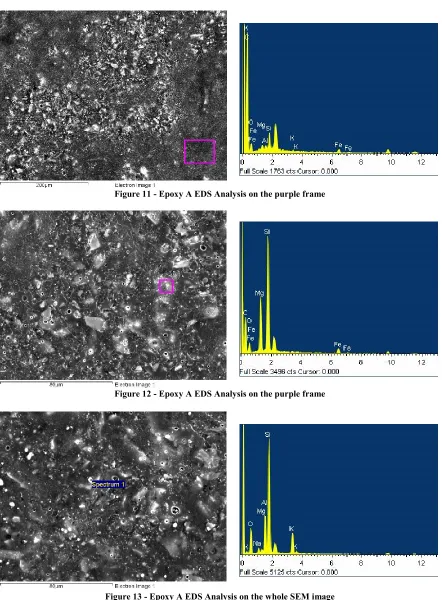
Figure 11 - Epoxy A EDS Analysis on the purple frame
[image:13.595.78.520.62.662.2]Figure 12 - Epoxy A EDS Analysis on the purple frame
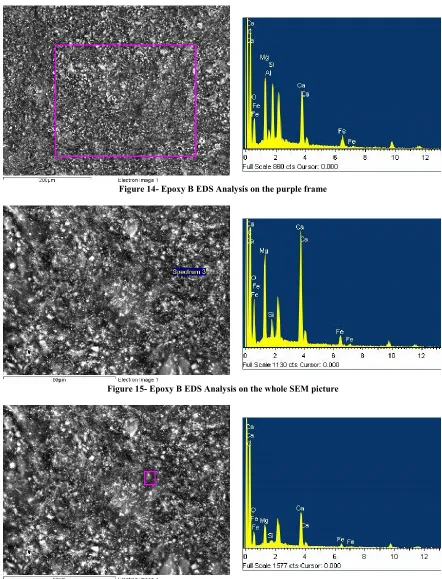
Figure 14- Epoxy B EDS Analysis on the purple frame
Figure 15- Epoxy B EDS Analysis on the whole SEM picture
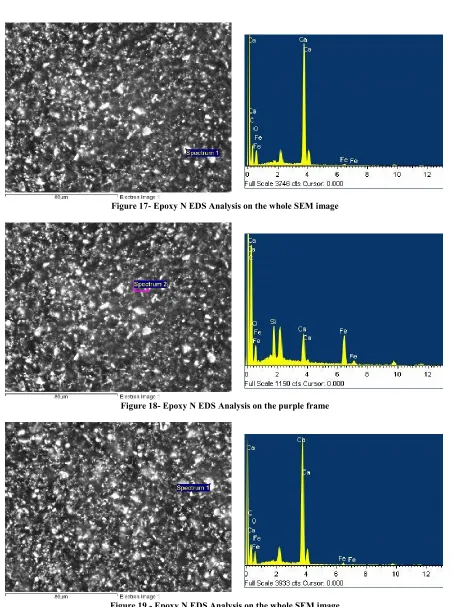
Figure 17- Epoxy N EDS Analysis on the whole SEM image
Figure 18- Epoxy N EDS Analysis on the purple frame
Figure 19 - Epoxy N EDS Analysis on the whole SEM image
Based on the principles of SEM analysis, the bright areas of all images are inorganic particles. Those crystalline or semi-crystalline particles reflect or deflect X-rays much more intensely comparing to the organic, non-crystalline binder content. In other words, all bright areas consist of fillers or pigments (Calcium carbonate CaCO3
filler, Iron Oxide Fe2O3 pigment, Aluminium Oxide Al2O3 additive), whereas the dark image areas are mainly
Epoxy A presented extensive micro-cratering and surface flaking (figures 16 and 17). This is a clear indication of incompatibility between the inert content of the coating (i.e. fillers and pigments) and the resinous system. The cratering cannot be attributed to inadequate mixing between the base and the hardener, as in such a case extensive cracking due to improper curing would appear. The craters affect the performance characteristics of the coating, as they pose dirt accumulation points. Apparently, cratering diminishes the performance against corrosion and the mechanical durability of the coating to withstand abrasive and impact loads. Furthermore, Epoxy A did not appear homogeneous in comparison to the microscopic analysis of the rest of the samples and the size distribution of the fillers was broad, as particles of up to 20μm were observed.
On the other hand, both Epoxy B and Epoxy N samples presented a uniform appearance without any craters on the surface. Even though the size distribution peak of inorganic particles (bright areas) on Epoxy N appeared slightly higher (bigger particles) than the respective of Epoxy B (Fig. 19 & 21), Epoxy N coating was slightly more uniform and packed (Fig. 18 & 20). This was attributed to the narrower size distribution (i.e. the particles lay between narrower size margins) and therefore better packing of them takes place. For a better understanding of the above observation, a classical mechanics equivalent could be the laying of marble spheres on a floor surface: The more uniform their size, the more even they pack. Non-uniform packing resulting from an uneven size distribution among marble spheres ends up with elevated roughness and poor surface characteristics.
The EDS analysis of all samples was mainly occupied by picks that correlate to calcium (Ca) and Iron (Fe). This was expected as epoxy paints were prepared with calcium carbonate fillers and iron oxide pigments [19]. It is interesting to note on Fig.23 which focuses on the fillers area of Epoxy A that there is an absence of a calcium peak, and instead an intense silicon peak can be observed. Most probably, Epoxy A does not contain calcium carbonate fillers, but instead fumed silica or other similar filler types are used.
Finally, the level of microscopic analysis did not allow the nanoparticles contained within Epoxy N to be revealed. The maximum zoom level (x 800) sets the resolution at 80 μm which was at least three orders of magnitude larger than the relevant nanoparticles of Epoxy N. Nevertheless, the appearance of silicon modified nano-elastomers can be noticed as a peak in Figure 29 of the EDS spectrum. Furthermore, the amorphous structure of the elastomeric nanoparticles would make it much difficult to appear on SEM, and other imaging techniques such as Transmission electron microscopy (TEM) or Atomic Force Microscopy (AFM) should be employed.
4 . 4 AB R A S I O N RE S I S T A N C E AS S E S S M E N T
The abrasion resistance assessment took place at the premises of Materials Industrial Research & Technology Center S.A. (MIRTEC SA), Chalkida, Greece, on Friday, 23rd September 2016. Despite the fact that the abrasion
testing methods applied were developed for ceramic tiles and not epoxy coatings, the authors’ strongly support that the results are still valuable.
4 . 4 . 1 P u l s a t i n g A b r a s i o n T e s t
[image:17.595.154.439.288.661.2]The first method of surface abrasion testing is based in ISO 10545-7:1996 (Ceramic tiles -- Part 7: Determination of resistance to surface abrasion for glazed tiles) [21]. The test is based on the visual inspection of test specimens, after subjected to the erosion caused by steel balls of three different diameters and distilled water, as it rotates with a certain eccentricity (22.5mm) at 300 revolutions per minute. The abrasive load in contact with the coating surface is contained in metal holders with rubber seals, clamped to the platform. The rotating device stopped at 10,000 revolutions, in order to allow extraction and examination of specimens. This method intends to simulate the abrasion of the cargo on the cargo hold paint from the relative cargo movements induced by the global vessel movements.
Figure 20 - Pulsating Abrasion Tester, based on the erosion caused from metallic spheres.
Figure 21 - Cumulative results on abrasion testing on pulsating abrasion tester
Figure 22 - Epoxy A IN7 sample after 10.000 rounds of abrasion testing on pulsating abrasion tester.
[image:19.595.155.442.377.655.2]Figure 24- Epoxy N ENV7 sample after 10.000 rounds of abrasion testing on pulsating abrasion tester.
The abrasion testing revealed that the damage induced on the Epoxy A and Epoxy B samples increased the surface roughness characteristics. Therefore, staining and cleaning effort are expected to increase after the coatings are exposed to abrasion loads. It should be noted at this point that in order to produce edible results that can form a solid comparison basis between coatings with this method a high number of revolutions is required due to the small magnitude of each one.
4 . 4 . 2 P u l s a t i n g A b r a s i o n T e s t
Figure 25 - Constant pressure, Rotating Disk Abrasion Tester
5 revs test Average Values
Epoxy A
IN5, IN13 Sample J6, J7 Sample Epoxy B ENV10, ENV12 sample Epoxy N
Damage Length (mm): 15,4 16,3 5,0
Damage Width (mm): 9,5 9,7 9,2
Damage Depth (mm): 0,242 0,194 0,084
[image:22.595.43.556.329.584.2]Volume loss (mm3): 35,4 30,7 3,9
Table 2 - Quantification of Rotating Abrasion Testing results @ 5 revolutions
20 revs test IN5 Sample Epoxy A J6 Sample Epoxy B ENV12 sample Epoxy N
Damage Length (mm): 20,0 21,1 15,0
Damage Width (mm): 10,0 10,0 9,2
Damage Depth (mm): 344 264 178
Volume loss (mm3): 68,8 55,7 24,6
Table 3 - Quantification of Rotating Abrasion Testing results @ 20 revolutions
Figure 28- Epoxy N samples, after rotary abrasion testing.
After five revolutions Epoxy N volume loss was almost an order of magnitude lower than Epoxy B and Epoxy A. Increasing the number of revolutions, Epoxy N still exhibits 50% to 66% less volume loss. It is indicative that although the performance specs of both Epoxy A and Epoxy B are not much different, the Epoxy B sample presented a larger surface area of damage.
[image:23.595.43.558.360.616.2]Even though that the abrasion testing procedures were not designed to assess epoxy coatings, the gradient in performance among specimens proved that the abrasive energy was successfully delivered and the testing outcome is in accordance to artificial ageing of cargo hold coatings. The steel spheres assessment can successfully resemble repetitive cycles of loading/unloading and the rotary disk test can resemble the abrasive force of grabs scratching the walls of cargo holds. Therefore a realistic ranking of the relative “in-service” performance between cargo hold
coating systems can be seen, with Epoxy N having a better performance than Epoxy B and Epoxy A, due to its ability to absorb abrasion forces due to the nano-particle structure. Epoxy A and Epoxy B although different technologies (modified and pure epoxy respectively) had a very similar performance which cannot create a straight forward answer on which has the best performance.
4 . 5 HA R D N E S S AS S E S S M E N T
Hardness is a material’s (surface) ability to resist plastic deformation, by impact or sliding [16]. Most coatings are viscoelastic, and hence will indent to some extent. Therefore, German standard DIN 55945:2016 [23] defines hardness as follows: Hardness is the resistance of a coating to a mechanical force. For determining hardness on cargo hold coatings, the pendulum method (König Pendulum) was applied [19]. This method evaluates hardness by measuring the damping time of an oscillating pendulum. The pendulum rests with two (2) stainless steel balls on the coating surface. A physical relationship exists between oscillation time, amplitude and the geometric dimensions of the pendulum. The viscoelastic behaviour of the coating determines its hardness. The softer the coating, the more the pendulum oscillations are damped and the shorter the time needed for the amplitude of oscillation to be reduced by a specified amount.
Epoxy A
IN5 Sample J6 Sample Epoxy B ENV10 sample Epoxy N
Oscillations to dampen: 52 60 43
The above results indicate that the Epoxy N is the softer coating. A closer understanding of Epoxy N properties indicate that the elastomeric nanoparticles contained therein can absorb the oscillation energy. Just like the mechanical analogue of a steel plate of thickness x and a set of y steel plates of thickness x/y interconnected with springs, Epoxy N exhibits the mechanism that energy can dissipate from the pendulum to dynamic/thermal energy in the coating. Therefore, it takes less oscillations to dampen.
4 . 6 IM P A C T RE S I S T A N C E AS S E S S M E N T
Figure 29 - Epoxy A (ΙΝ15) sample after impact testing
[image:25.595.135.463.418.747.2]Figure 31- Epoxy N (ENV9) sample after impact testing
On the Epoxy A sample, the impact craters have an average size of 7.9±0.3mm. Two of the impact points have delaminated. On the Epoxy B sample, the impact craters have an average size of 6.4±1.4mm. Only one impact point has delaminated, but with a complete loss of adhesion between the primer and the application surface. On Epoxy N the impact craters have an average size of 4.1±1.0mm. Three of the impact points have delaminated.
4 . 7 ST A I N RE S I S T A N C E AS S E S S M E N T
The staining test consists of the application of a pigment rich coating (stain) on top of the cargo hold’s coating surface, in order to assess the effort needed for removing the stain. The stainability of a coating may be interpreted as the difficulty of removing any substance or product in contact with the surface, without reacting with the surface (in which case chemical attack would be involved).
For the staining assessment of the cargo hold coatings, a solvent based stain was formulated by 10% w/w micronized carbon (graphite type; i.e. carbon black), 10% w/w an acrylic solvent based resin and 80% w/w an appropriate organic solvent (xylene, butyl acetate mixture). The stain formulation was applied by a brush, producing a thick coating (±300μm). The stained samples were placed in an oven at 60oC to fully cure, before
stain resistance testing.
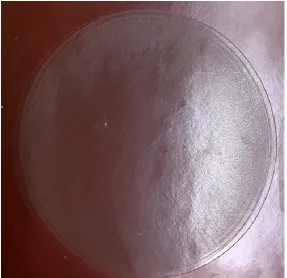
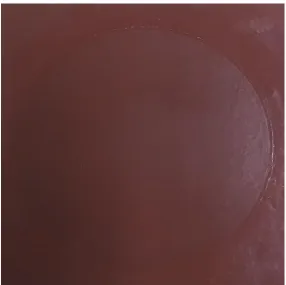
Figure 32 - Stain resistance assessment of the selected cargo hold coatings. On left, ComPainA, middle ComEpoxy B and right Epoxy N sample
After staining, curing and conditioning of the samples at room temperature, all samples were put under running water to examine stain removal. None of the samples showed any marks of stain removal. However, when water was wiped off by means of absorptive paper towel, pieces of the stain were delaminating and removed from the Epoxy N sample. Light abrasion cleaning eliminated stains from Epoxy N’s surface. Epoxy A and Epoxy B did not present any signs of stain removal. Using a hard-abrasive cleaning medium (metal sponge) on Epoxy A and Epoxy B did result partial cleaning but only with mass loss of the underlying coating. The difference of stain resistance between coatings is directly correlated to the different roughness properties. For rougher coatings, the stain fails to be entrapped in surface irregularities, resulting to coatings that can be cleaned easier.?
4 . 8 CH E M I C A L RE S I S T A N C E AS S E S S M E N T
The chemical resistance of a coating can be determined using ISO 2812-1:2007 Part 1 [26]. Under this method, a material or surface is exposed to the chemical substance for certain time and the relevant area is then inspected microscopically. Possible alternations include discoloration; softening; alteration in the degree of shine; swelling; detachment of coatings and blistering.
On completion of the defined test period, any residues of test liquid are removed and the material surface assessed and analysed for visible alterations in accordance with DIN EN ISO 4628-1 to -5. To ascertain a possible regeneration time, the assessment is made once immediately after removal of the test liquid and again one hour later. The test procedure proves whether a material or surface is “resistant”, “partially resistant” or “not resistant” to a specific chemical over a defined period of time.
For the assessment of cargo hold coating samples, the following chemicals were selected: a) Sulphuric Acid H2SO4 solution in water (pH = 2.0); b) Hydrofluoric Acid HF solution in water (pH = 2.9); c) Brine (10% w/w of
solution in water (pH = 1.0); e) Brine (10%w/w of sodium chloride in water) and f) DeSalin K, a commercially available acidic cleaner comprising of Muriatic (Hydrochloric) Acid, Formic Acid and 2-butoxyethanol detergent (pH = 0.15).
Six plastic tubes of 2.5cm in diameter were firmly affixed on the surface of each of the testing specimens, by means of silicone glue. After silicone glue was cured, the plastic tubes were filled with the “chemically aggressive” solutions (test liquids) for 28 days (4 weeks). Even though weekly assessment took place, depicted results represent the test completion (28 days). Samples assessed were IN11, J4 and ENV2.
Figure 33 - Testing arrangement for the determination of chemical resistance of cargo hold coatings.
Figure 34 - Appearance of the Epoxy A (IN11) after subjecting to 28days of chemical resistance testing
Figure 36 - Appearance of the Epoxy N (ENV2) after subjecting to 28days of chemical resistance testing
Testing results are summarized in the following table:
Sulphuric Acid H2SO4
pH = 2,0
Hydrofluoric Acid HF pH = 2,9
Brine 10% H2SO4
pH = 2,9
Muriatic Hydrochloric Acid pH =1,0 Brine 10% DeSalin K Muriatic & Formic Acid
pH = 0,15
E
po
xy
A
7 days No Change Discoloured No Change No Change No Change BlisteringHeavy
14 days No Change Discoloured No Change Light Blistering No Change BlisteringHeavy
21 days No Change Discoloured No Change Light Blistering No Change BlisteringHeavy
28 days No Change Discoloured No Change Light Blistering No Change BlisteringHeavy
E
po
xy
B
7 days Light Swelling Discoloured No Change DiscolourationLight No Change No Change
14 days Light Swelling Discoloured DiscolourationLight DiscolourationLight No Change Light Swelling
21 days Light Swelling Discoloured DiscolourationLight DiscolourationLight No Change Light Swelling
28 days Light Swelling Discoloured Discolouration Light Discolouration Light Swelling Light Light Swelling
E
po
xy
N
7 days No Change No Change No Change No Change No Change No Change
14 days No Change Discolouration Light No Change No Change No Change No Change
21 days No Change Discoloured No Change No Change No Change No Change 28 days No Change Discoloured No Change No Change No Change No Change
[image:30.595.40.584.437.753.2]Based on the above results, it is evident that epoxy coatings are susceptible to the action of hydrofluoric acid. Epoxy N remain unaffected for the first seven days of exposure; however prolonged action of HF resulted to failure by discolouration. Epoxy B presented an unexpected swelling and discolouration from day 14; even on brine light swelling developed. It is evident that there is humidity uptake upon exposure to water environment.
Epoxy A presented good stability in non-heavily acidic environment; however, exposure to extreme acidities like DeSalin K resulted in heavy blistering.
4 . 9 R a n ki n g o f P a i n t i n g S y s t e ms
Following the completion of the laboratory testing scope, and prior any full scale application, the 3 different painting systems need to be ranked based on the test results. The attained utility for each objective is depicted in tables [5] to [13] that follow.
Table [5]: Attained Utility for Surface Glossiness.
Abrasion Resistance Test
20 cycles test
Test Results Attained Utility
Epoxy A Epoxy B Epoxy N Epoxy A Epoxy B Epoxy N
Damage Length
(mm): 20.00 21.10 15.00 0.75 0.71 1.00
Damage Width
(mm): 10.00 10.00 9.20 0.92 0.92 1.00
Damage Depth
(mm): 344.00 264.00 178.00 0.52 0.67 1.00
Volume loss
(mm3): 68.80 55.70 24.60 0.36 0.44 1.00
Table [6]: Attained Utility for Abrasion Resistance (20 cycle test)
Abrasion Resistance Test
5 cycles test
Test Results Attained Utility
Epoxy A Epoxy B Epoxy N Epoxy A Epoxy B Epoxy N
Damage Length
(mm): 15.40 16.30 5.00 0.32 0.31 1.00
Damage Width
(mm): 9.50 9.70 9.20 0.97 0.95 1.00
Damage Depth
(mm): 0.24 0.19 0.08 0.35 0.43 1.00
Volume loss
(mm3): 35.40 30.70 3.90 0.11 0.13 1.00
Table [7]: Attained Utility for Abrasion Resistance (5 cycle test)
Surface Hardness Test
Test Results Attained Utility
Epoxy A Epoxy B Epoxy N Epoxy A Epoxy B Epoxy N
Oscillations to
dampen: 52 60 43 0.83 0.717 1
Table [8]: Attained Utility for Surface Hardness
Epoxy N Epoxy B Epoxy A
Average: 55.7 0.394 Average: 20.7 0.798 Average: 17.2 0.754
Std Dev: 2,2 0,085 Std Dev: 0,9 0,074 Std Dev: 1,3 0,114
Attained
Impact Resistance
Test Epoxy A Epoxy B Epoxy N
Crater Diameter 7.9 6.4 4.1
Std Dev 0.3 1.4 1
Attained Utility: 0.450751582 0.640625 1
Table [9]: Attained Utility for Impact Resistance
Stain Resistance Test Epoxy A Epoxy B Epoxy N
Attained Utility: 0.4 0.1 1
Table [10]: Attained Utility for Stain Resistance
The resistance to chemicals as described previously in paragraph 4, has qualitative results. The following scale has been used in order to quantify the defects due to the chemicals and thus quantify results:
Table [11]: Defect scale for chemical resistance tests.
Using this scale, the results of the chemical resistance test can now be quantified as performance indices instead, as shown at table [12] below.
Table [12]: Matrix of quantified results of chemical resistance tests.
No Change Discolouration Light Blistering Light Light Swelling Discoloured Heavy Blistering
In order to derive now with one index per coating based on the results matrix a weighted average approach is followed. For each chemical solution the respective coating was exposed to, the average of the quantified result of the duration the coating was exposed to the latter (7/14/21/28 days) is calculated. From this calculation, an average index per chemical solution per coating is derived. Following this, a weighted average procedure is applied with 5 different weight per solution scenarios as per table [13]. The coating chemical resistance performance index is the average of the 5 different scenario results. The utility for chemical resistance of each coating 𝑢𝑖(𝐶𝑅), is therefore calculated. The results of the attained utility per coating can be seen in table [13].
Similarly to the chemical resistance test results, the paint microstructure and coherence is determined from the results of the SEM analysis, as described in paragraph 4, the results of which are also qualitative. For this case a utility has been assigned directly to each coating system. Epoxy N, having the best microstructure coherence has been given the utility of 1.0, since it is the one closest to the desired coating merit. Since Epoxy B has a very similar film microstructure structure to Epoxy N, a utility of 0.8 has been assigned, while for Epoxy A that has an incoherent film microstructure with many micro-craters being formatted has been assigned a utility of 0.5.
Chemical Resistance Test Sulphuric Acid Hydrofluoric Acid Brine 10% Muriatic Hydrochloric Acid Brine 10% DeSalin K Epoxy A Epoxy B Epoxy N
H2SO4 HF H2SO4 HCl
Muriatic & Formic
Acid
pH = 2,0 pH = 2,9 pH = 2,9 pH =1,0 pH = 0,15
Chemical Resistance
Test
Sulphuric
Acid Hydrofluoric Acid Brine 10%
Muriatic Hydrochloric Acid Brine 10% DeSalin K
H2SO4 HF H2SO4 HCl
Muriatic & Formic
Acid
pH = 2,0 pH = 2,9 pH = 2,9 pH =1,0 pH = 0,15
Ep
ox
y
A
7 days 1 5 1 1 1 6
14 days 1 5 1 3 1 6
21 days 1 5 1 3 1 6
28 days 1 5 1 3 1 6
Average
Values 1 5 1 2.5 1 6
Ep
ox
y
B
7 days 4 5 1 2 1 1
14 days 4 5 2 2 1 4
21 days 4 5 2 2 1 4
28 days 4 5 2 2 4 4
Average
Values 4 5 1.75 2 1.75 3.25
Ep
ox
y
N 7 days 1 1 1 1 1 1
14 days 1 2 1 1 1 1
21 days 1 5 1 1 1 1
28 days 1 5 1 1 1 1
Average
Scenario 1 0.17 0.17 0.17 0.17 0.17 0.17 1.00 2.96 1.38
Scenario 2 0.20 0.10 0.10 0.30 0.00 0.30 1.00 3.05 1.23
Scenario 3 0.30 0.20 0.10 0.20 0.10 0.10 1.00 3.28 1.45
Scenario 4 0.20 0.30 0.10 0.10 0.00 0.30 1.00 3.65 1.68
Scenario 5 0.30 0.30 0.00 0.10 0.00 0.30 1.00 3.88 1.68
Average Chemical Resistance Index 3.28 3.36 1.48
Attained Utility: 0.259 0.252 1.000
Table [13]: Ranking and attained utilities for Chemical Resistance
SEM Analysis Epoxy A Epoxy B Epoxy N
Attained Utility: 0.5 0.8 1
Table [14]: Attained Utility for Paint Microstructure (SEM analysis results)
The last qualitative result is that of the stain resistance testing. The assignment of utilities here follows the same approach as in the case of the microstructure SEM results described above. The Epoxy N, which is distinctly closest to the merit has been assigned with a utility of 1.0. The other two coatings have a much inferior performance, with the Epoxy A being the second after Epoxy N with a utility of 0.4. Epoxy B can be considered as having no stain resistance at all, therefore a minimum utility of 0.1 has been assigned. ‘
Stain Resistance Test Epoxy A Epoxy B Epoxy N
Attained Utility: 0.4 0.1 1
Table [15]: Attained Utility Stain Resistance
The weight of each attribute/objective is being assigned accordingly by the decision makers (in this instance the ship owner). For the study presented herein, Authors assumed three different scenarios (U1, U2 and U3) respectively in which the assignment and weight distribution for each attribute is different. In Scenario U1, all attributes have equal weights. In Scenario U2 the decision maker focuses on the practical and operational aspects of cargo hold coating, namely the ease to clean after cargo operations and its resistance to the chemicals used in such operations. The bigger weight of 0.2 has been therefore assigned to the Resistance in Chemicals, Stain Resistance and Glossiness test results. The Roughness, Hardness and the SEM examination results have a smaller weight of 0.1 and lastly, the smallest weight of 0.05 is assigned for the Abrasion Resistance results and Impact Resistance results. In Scenario U3, the biggest weights of 0.2 are assigned to the Abrasion Resistance, Hardness Resistance, Impact Resistance and SEM microstructure examination test results. While a small weight of 0.05 is assigned to all other attributes. In this scenario the decision maker thus focuses on the structural integrity and overall toughness of the coating. The assignment of attribute weights for each scenario is depicted in Table [] below.
Objective Weight U1 U2 U3
Surface Glossiness / 𝑤
𝑆𝐺 0.125 0.200 0.100Surface Roughness 𝑤
𝑆𝑅 0.125 0.100 0.050Abrasion Resistance (20 cycles) / 𝑤
𝐴𝑅 0.125 0.050 0.200Surface Hardness / 𝑤
𝑆𝐻 0.125 0.100 0.200Resistance in Chemicals / 𝑤
𝐶𝑅 0.125 0.200 0.100Impact Resistance / 𝑤
𝐼𝑅0.125 0.050 0.200
Carbon Stain Resistance / 𝑤
𝐶𝑆𝑅 0.125 0.200 0.050Microstructure SEM examination / 𝑤
𝑆𝐸𝑀 0.125 0.100 0.100Table [16]: Utility weights for each objective according to the 3 decision making scenarios.
Test Epoxy N Epoxy B Epoxy A
Glossiness 1.000 0.372 0.203
Abrasion Resistance (20 cycles) 1.000 0.442 0.358
Hardness 1.000 0.118 0.161
Resistance in Chemicals 1.000 0.440 0.451
Impact Resistance 1.000 0.641 0.451
Stain Resistance 1.000 0.100 0.400
Microstructure SEM examination 1.000 0.800 0.500
Utility Function 1 1.000 0.426 0.384
Utility Function 2 1.000 0.378 0.372
Utility Function 3 1.000 0.470 0.374
Table [17]: Utility function for each painting system
Epoxy N Epoxy B Epoxy A
Utility Function 1 1.000 0.426 0.384
0.000 0.200 0.400 0.600 0.800 1.000 1.200 Util it y
Utility Function - U1
Epoxy N Epoxy B Epoxy A
Utility Function 2 1.000 0.378 0.372
0.000 0.200 0.400 0.600 0.800 1.000 1.200 Util it y
[image:35.595.82.512.167.721.2]Figures [37] to [39]: Ranking of the painting systems with utility functions – scenarios U1 to U3
As seen from both table [17] and figures [37] to [39], the Epoxy N has a distinctively higher utility which fully validates all experimental results. It should be noted that this coating is an experimental epoxy with nano-particles designed for superior performance compared to conventional cargo hold painting systems and its strict dominance against the other systems in all testing results was expected and targeted. Furthermore, rather interestingly, the ranking between Epoxy A and Epoxy B is highly dependent on the weights chosen by the respective decision maker. For example, for scenario U1 for which there are equal weights for each objective, Epoxy A dominates Epoxy B. In scenario U2, Epoxy B also dominates Epoxy A but marginally since more weight is assigning to the chemical and stain resistance performance. In scenario U3 lastly, again Epoxy B strictly dominates Epoxy A, due to the weight assigned to the SEM examination results as well as the hardness and abrasion resistance performance.
Authors would therefore suggest that careful weight attribution, prioritization as well as a sufficient number of scenarios are generated in order to make the decision-making process safer and more efficient. Another, rather important point is that normally, such functions would be used for a much higher population of different variants and not just three. Furthermore, the Author’s from their experience already know the ranking of the Epoxy A and Epoxy B from applications and lifecycle performance on board, which is in turn validated by the results of the herein presented study. Naturally, all of the above comparisons made don’t include any commercial, marketing aspects and pricing which for decision makers in shipping companies are key drivers, as the present is a multi-criteria ranking methodology for the technical/technological aspects of coatings, however in future studies this is to be also included in order to address the decision making process in a holistic way.
5. Full Scale Assessment on board
The full-scale assessment of the herein examined cargo hold coatings took place on board a 98,000MT DWT Post Panamax bulk carrier, during her dry-docking maintenance at a shipyard in China in 2016. The full-scale application serves as a verification of the results of the laboratory tests and subsequent ranking procedure. The vessel was built in 2011 and thus that was her first dry-docking and special survey. The cargo hold paint was the original, as-built system (250μm total DFT, 36 months lifetime) from the newbuilding yard with the necessary maintenance in form of touch-ups from the crew using Epoxy A. The painting specification of the vessel is constituted by two coats of Epoxy B paint of 125 μm each totalling at 250 μm for the cargo holds. A test patch of Epoxy N was applied in order to assess it performance in actual operating conditions. No.4 Cargo Hold was selected for the test which is also heavy ballast hold and has higher corrosion rates. The patch location was at the
Epoxy N Epoxy B Epoxy A
Utility Function 3 1.000 0.470 0.374
0.000 0.200 0.400 0.600 0.800 1.000 1.200 Util it y
vessel’s port side and at the lower hopper location. The applied areas were grit blasted to Sa2.0 standards (100% at hopper areas) while adjacent locations were blasted to Sa1.0 standards in order to perform “feathering” and smoothen the profile of previous coating. The Epoxy N patch similarly to the prevailing repair painting specification had a total thickness of 250μm but was composed by two coats of 100μm primer and 150μm final coat instead.
Figure 40 - Application of EZR Primer on board No.4 (P) Cargo Hold of Post Panamax Bulker – Case A
[image:38.595.84.511.391.676.2]Figure 42 - Completed application of EZR Primer on board No.4 (P) Cargo Hold of Post Panamax Bulker – Case A . Blue line denotes application area.
[image:39.595.86.511.388.672.2]Figure 44 - Application of Epoxy N top coating on board No.4 (P) Cargo Hold of Post Panamax Bulker - Case A. Epoxy N appears glossier than surrounding coatings. Blue line denotes application area.
Figure 45 - Completed application of Epoxy N top coating on board No.4 (P) Cargo Hold of Post Panamax Bulker
– Case A. Blue line denotes application area.
[image:40.595.82.517.388.675.2]Figures 50 and 51 underline that the results are very impressive and there is a distinct difference between the two systems. Figures 52 and 53 depict the test patch area after 16 months from the application and underline the distinctive difference between the two coating systems which can be used in the qualitative technical assessment and consecutive ranking by owners for future applications. Damage areas are mainly attributed to the abrasive action of grabs and bulldozers.
[image:41.595.91.509.213.529.2]Furthermore, it should be noted that the extremely high Abrasion rate and mechanical damages observed at the hoppers, are not representative of the paint since any paint at such locations will fail. It is therefore suggested by the authors that the testing location should be reconsidered to be extended towards the frame area and also include the stool and lower bulkhead areas, including in this way the entire cargo hold lower zone.
Figure 47 - Port Side of No.4 Cargo Hold of Post Panamax Bulker, 16 months after application of Epoxy N coating.
[image:42.595.88.510.402.721.2]6. Conclusions, discussion of the results and future work
A comprehensive multi-criteria decision-making methodology for the selection of cargo hold coating for bulk carriers has been presented and applied successfully at the comparison between three real distinctive coating schemes. After the critical characteristics and desired attributes of the ideal bulk carrier cargo hold coating system were identified, a methodology was developed in order to technically and rationally assess and consecutively rank each system in both model and full scale. This methodology can be used by ship owners in the future in order to rationalize and add an enhanced technical assessment for the ranking of different painting systems for cargo holds along with the commercial aspects of this decision-making process.
Future work on this direction will include the following:
- Include cost and other key commercial drivers in the DM process - Extend and adapt comparison method for antifouling paints,
- Use of vessel motion simulation tripod with cargo hold models to simulate cargo (carbon) movements in holds and assess its interference with the coating system.
- Application of the method for new and experimental coating systems such as self-healing paints
7. Acknowledgments
The authors would hereby to express their deep gratitude to Star Bulk Carriers Corp. and its CEO Mr. Petros Pappas for guiding them through the scope of application, testing and comparison as well as for providing the application test case on board a Post Panamax vessel.
8. References
1. “Maritime Economics”, Martin Stopford, 3rd Edition 2009, Routledge, ISBN 978-0-415-27558-3 2. “Ship Design and Production Vol.II”, Chapter 33 – Bulk Carriers, The Society of Naval Architects and
Marine Engineers (SNAME), 2004, ISBN 0-939773-41-4
3. “International Maritime Dangerous Goods (IMDG) Code”, International Maritime Organization (IMO), 2016 Edition (Amendment 38-16), IMO Publishing.
4. “Corrosion wastage modeling of deteriorated bulk carrier decks”, Yordan Garbatov, Carlos Guedes Soares, Interational Shipbuilding Progress, January 2008.
5. “Corrosion wastage modeling of deteriorated ship structures”, Yordan Garbatov, Carlos Guedes Soares, Interational Shipbuilding Progress, January 2008
6. “Bulk Carriers: Guidelines for Surveys, Assessment and Repair of Hull Structure - Recommendation No.76”, International Association of Classification Societies (IACS), 1994.
7. “Time-variant ultimate longitudinal strength of corroded bulk carriers”, Jeom Kee Paik*, Jae Myung Lee, Young II Park, Joon Sung Hwang, Chang Wook Kim, Marine Structures 16 (2003) 567-600
8.
http://www.tradewindsnews.com/drycargo/1237914/stellar-daisy-tragedy-throws-converted-vlocs-into-spotlight
9. “Study on alternative approaches to corrosion protection of ballast tanks using an economic model”, Kris De Baere, Helen Verstaelen, Philippe Rigo, Steven Van Passel, Silvia Lenaerts, Geert Potters, Marine Structures 32 (2013) 1-17.
11. “Ship ballast tanks a review from microbial corrosion and electrochemical point of view”, A.Heyer, F.D Souza, C.F Leon Morales, G.Ferrari, J.M.C Mol, J.H.W de Wit, Ocean Engineering 70 (2013) 188-200
12. “Ship Painting: Current Practise and Systems in Europe” , A.M. Berendsen 13. “Marine Painting Manual”, A.M. Berendsen, ISBN 1 85333 286 0, 1989. 14. “Fitz’s Atlas 2 of Coating Defects”, 2011 by MPI Group
15. “Ballast Tanks and Cargo Holds in DNV’s Guidelines for Corrosion Protection of Ships”, Erik Arskheim, Protective Coatings Europe (June 1997) 26-35.
16. “Guidelines for the Corrosion Protection of Ships” Det Norske Veritas, July 1992.
17. “Choosing the Correct Coatings for Cargo Tanks”, Norbert Ackermann, Protective Coatings Europe (April 1998) 44-51.
18. “Resolution MSC.215(82)Performance standard for protective coatings of dedicated seawater ballast tanks on all new ships and of double-side skin spaces of bulk carriers” , International Maritime Organization (IMO), SOLAS regulations II-1/3-2, July 2008
19. “The Chemistry and Physics of coatings, 2nd Edition”, Alistair R Marrion, 2004, ISBN
978-0-85404-604-1
20. “US Code of Federal Regulations (CFR) Title 21: Food and Drugs”, Revised April 1st 2017.
21. “ISO 10545-7:1996, Ceramic Tiles – Part 7 : Determination of resistance to surface abrasion for glazed tiles”
22. “ISO 10545-6:2010, Ceramic Tiles – Part 6: Determination of resistance to deep abrasion for unglazed tiles”
23. “DIN 55945:2016-08: Paints and varnishes - Additional terms and definitions to DIN EN ISO 4618” 24. “ISO 6272-2:2011, Paints and Varnishes – Rapid Deformation (Impact Resistance) tests – Part 2:
Falling-weight test, small area indenter”
25. “ASTM D2794 – 93: Standard Test Method for resistance of organic coatings to the effects of rapid transformation (impact)”
26. “ISO 2812-1:2007: Paints and varnishes – Determination of Resistance to Liquids – Part 1: Immersion in liquids other than water”
27. http://www.mitutoyo.com/wp-content/uploads/2015/08/Surftest_SJ210.pdf
28. “Scanning electron microscopy and x-ray microanalysis”, Goldstein, J. (2003) , Kluwer Academic/Plenum Publishers, 689 p.
29. “Scanning electron microscopy: physics of image formation and microanalysis”, Reimer, L. (1998), Springer, 527 p.
30. “Fundamentals of Energy Dispersive X-ray Analysis”, Russ, J. C. (1984) , Butterworths. London. 31. “Critical Study on Scratch Resistance Test Methods” , George E. Drazinakis, Agnes Lechwar,
Performance Coatings International Laboratories, USA
32. “Advanced Microeconomic Theory (Third ed.)”, Jehle, G. A.; Reny, P. J. (2011). Prentice Hall. pp. 28– 33.
33. “Applications of Holistic Ship Theory in the Optimization of Bulk Carrier Design and Operation”, Nikolopoulos L., Boulougouris V., EUROGEN 2015 Conference, September 2015 Glasgow.
34. “Applications of Holist Ship Theory for the Simulation Driven Optimization of the Design and Operation of Large Bulk Carriers”, Nikolopoulos L., Boulougouris V., Khorasanchi M. , International Conference for Energy Efficient Ships, London 2016, Royal Institution of Naval Architects.
35. "A Holistic Methodology for the Optimization of Tanker Design and Operation and its applications", Nikolopoulos L. Diploma Thesis NTUA, July 2012.
36. “The Analytic Hierarchy Process: Planning, Priority Setting, Resource Allocation”, Thomas L. Saaty, McGraw-Hill, 1980