Contents lists available at ScienceDirect
Ultramicroscopy
journal homepage: www.elsevier.com/locate/ultramic
Energy-weighted
dynamical
scattering
simulations
of
electron
diffraction
modalities
in
the
scanning
electron
microscope
Elena Pascal
a, Saransh Singh
b, Patrick G. Callahan
c, Ben Hourahine
a, Carol Trager-Cowan
a,
Marc De Graef
b,∗aDepartmentofPhysics,SUPA,UniversityofStrathclyde,G40NG,Glasgow,UK
bDepartmentofMaterialsScienceandEngineering,CarnegieMellonUniversity,Pittsburgh,PA15213-3890,USA cDepartmentofMaterials,UniversityofCaliforniaatSantaBarbara,SantaBarbara,CA93106,USA
a
r
t
i
c
l
e
i
n
f
o
Articlehistory:
Received23October2017 Revised21December2017 Accepted17January2018 Availableonline2February2018
Keywords:
TransmissionKikuchidiffraction TKD
Dynamicalsimulations MonteCarlo Dictionaryindexing
a
b
s
t
r
a
c
t
TransmissionKikuchidiffraction(TKD)hasbeengainingmomentumasahighresolutionalternativeto electronback-scattereddiffraction (EBSD),adding totheexisting electrondiffractionmodalities inthe scanningelectronmicroscope(SEM).Theimagesimulationofanyofthesemeasurementtechniques re-quires an energydependent diffractionmodelfor which,in turn,knowledge ofelectronenergiesand diffractiondistancesdistributionsisrequired.Weidentifythesample-detectorgeometryandtheeffectof inelasticeventsonthediffractingelectronbeamastheimportantfactorstobeconsideredwhen predict-ingthesedistributions.However,tractablemodelstakingintoaccountinelasticscatteringexplicitlyare lacking.Inthisstudy,weexpandtheMonteCarlo(MC)energy-weightingdynamicalsimulationsmodels usedforEBSD[1]andECP[2]totheTKDcase.WeshowthatthefoilthicknessinTKDcanbeusedas ameansofenergyfilteringandcomparebandsharpnessinthedifferentmodalities.Thecurrentmodel isshownto correctlypredictTKDpatternsand, throughthedictionaryindexingapproach, toproduce higherqualityindexedTKDmapsthanconventionalHoughtransformapproach,especiallyclosetograin boundaries.
© 2018TheAuthors.PublishedbyElsevierB.V. ThisisanopenaccessarticleundertheCCBYlicense.(http://creativecommons.org/licenses/by/4.0/)
1. Introduction
Electrondiffractiontechniquesinthescanningelectron micro-scope(SEM)areestablishedandversatiletoolsformicrostructural investigationofcrystallinematerials.Thestrongandcomplexlocal interactionsofelectronswithcrystallinematterofferaplethoraof informationaboutthecrystalstructureandmaterialpropertiesofa samplethatcanberecoveredfromtherecordedsignal.Areviewof theseisgiveninref.[3].Kikuchipatternsareonerepresentationof thediffractingbehaviourofelectronsintheformofavariationin theangulardistributionofsignalelectrons.Thegeometryofthese patternsisdictatedby theunitcell ofthecrystalandits orienta-tion.Otherfeatures, suchasthewidthofthebands,forinstance, areneverthelessinfluencedbythespatialdistributionofelectrons
∗ Correspondingauthor.
E-mail addresses: [email protected] (E. Pascal),
[email protected] (S. Singh), [email protected] (P.G. Callahan),
[email protected] (B. Hourahine), [email protected]
(C.Trager-Cowan),[email protected](M.D.Graef).
inthesampleandtheir energydistribution(fora morecomplete discussionseeref.[4]).
Wecan distinguisha numberofdifferentSEMmodalities em-ploying the Kikuchi diffraction mechanism. If the recorded elec-trons are the backscattered ones (BSEs), then the technique is knownas electronbackscatterdiffraction(EBSD) andtheKikuchi patterns obtainedare calledelectron backscatter patterns(EBSP). Automated pattern indexing software established this diffraction modalityasoneoftheconventionaltoolsoforientationmapping, phaseidentificationand/orrelativelatticestrainestimationin crys-tallinematerials [3]. Inorder toincrease the diffractionsignal in this mode, the popular approach has been to tilt the sample to about70°fromhorizontaltowardsthedetector,whichguarantees a maximum backscattered electron yield. However, the high tilt will also spread out the information volume (or interaction vol-ume)oftheelectronswithinthesample,resultinginlimitationof theachievablespatialresolution.
Stimulated by the increased attention to nanostructured ma-terials, which promise newand enhanced propertieswhen com-paredtotheir largerscale counterparts,the interestinimproving the resolutionof established characterization techniqueshas also
https://doi.org/10.1016/j.ultramic.2018.01.003
expanded.Theuseofforward-scatteredelectrons(FSEs)througha thinsampleasdiffractionsignalcollectedfromthebottomofthe foilhasbeenshowntoimprovethelateralspatialresolutionto be-low 10nm[5,6];thistechniqueiscommonlyknownas transmis-sionKikuchidiffraction(TKD)ortransmissionEBSD(t-EBSD).
The modalities above are sometimes referred to as “channel-ing out” diffraction techniques [7]to suggest that the diffraction information has been sampled by electrons on their way out of the sample and that the volume from which the signal is col-lected is located close to the exit surface. The SEM can also be used in“channeling in” modewhenelectron channelingpatterns (ECPs)areacquired[8,9].Inthiscase, Kikuchi-likediffraction pat-ternscanalsobeobtainedbyvaryingtheincidentbeamdirection withrespecttothecrystal.Typically,thosepatternshaveasmaller solidanglecomparedtotheirEBSDcounterparts.Nevertheless,the physical scatteringmechanismsthat produce EBSPs andECPs are relatedthroughthereciprocityprinciple[10].
Theoretical models have been developed and successfully ap-pliedtoretrievethiswealthofinformationbytakingintoaccount the fulldynamical behaviour ofelectron diffraction[11–13]. Elec-tron diffractioncalculationscommonly handleinelastic scattering in a phenomenological way through the introduction of a com-plex optical crystalpotential approximation.This assumption im-plies that inelasticallyscattered electrons, once they lose even a smallamountofenergy,willceasetocontributetothediffraction pattern. The predicted diffraction patterns based on this simpli-fied modelremain meaningful[14]but, understandably, are lack-ingquantitativeprecision.Duetothestronginteractionofincident beam electrons at SEM energies with matter, the inelastic cross section is always comparabletothe elastic one,anda portionof inelastically scattered electrons will reach the detector and con-tributestotheimagedpattern.
Depending on the types of inelastic channels allowed, these electrons cansufferdiffractionafterlosing asmallamountof en-ergy, contributingthentothediffusenessofthe Kikuchipatterns. Thisprocessisespeciallyrelevantfor“channellingout” modalities whereelectronswithenergies lowerthantheincident energycan stillcontribute tothediffractionpattern. Alternatively,ifelectrons arescatteredatalargeanglemultipletimessuchthatmemoryof theiroriginaldirectionislost,theywillalsocontributetothe back-groundintensity. Thisis the caseforboth channelingmodalities. Wecallthelatertypeofinelastically(back/forward-)scattered elec-trons (B/F)SE2 in order to differentiate them from(B/F)SE1 elec-tronscarryingdiffractioninformation.
Itisthereforeessentialtoexplicitlyconsiderinelasticscattering and its effectson the signal contributingelectrons, such as their energyandspatialdistributions[1,15].Thisisespeciallyimportant iffinerfeatures oftheKikuchibands(size, absoluteintensity rel-ativeto background,band edges)are to becorrectlypredicted. A full accountofthe inelasticchannelsinelectrondiffractionposes a challenging problem. While general Schrödinger equation solu-tionsforinelasticscatteringinperfectcrystalshavebeenproposed by Yoshioka [16]and solved forvarious electron microscopy ap-plications(seeHowie[14]forsmallangleplasmon scatteringand Forbes et al.[17] for singlethermal diffusescatteringevents), to our knowledge,readily implementablesolutionsrelevant forSEM electronenergieshaveyettobeproposed.
In this work, we assume inelastic scattering events to be stochasticandthatMonteCarlo(MC)techniquescanestimateboth the trajectories of electrons that suffered such eventsas well as their energy distribution. Such models have been proposed and widelyusedtocorrectlypredictdistributionsofbackscattered elec-trons[18].Theassumptionthatthedistributionsofescapeenergies and trajectories of electrons carrying diffraction information can be estimatedfromthe last elasticeventpredictedby MC models has alreadybeensuccessfullyapplied forEBSPs [1]andECPs [2].
The electronenergy atthelast elastic event, prior to leavingthe sample,isregardedasthediffractionenergy(energyatwhichthe diffractioneventoccurs),andthedistancetotheexitsurfacefrom theelasticevent(escapeorexitdistance)isusedasthediffraction distance(electron path length over whichcoherence is not lost). Dynamical diffraction modelling is then applied for the full MC predictedelectronenergyandpathdistributions. Here,weextend thismodeltoTKDpatternsbyconsideringthegeometryofathin film samplewhere the entry (top) and escape (bottom) surfaces aredifferentsuch that theincoherenteventsactingassources of diffractingelectronsarescatteringinaforwarddirection.
Whilethisapproachmaynot takeintoaccount thefull extent ofinelastic scattering effects ondiffracted electrons proposed by the Yoshioka equations,it leadsto a modelof manageable com-plexitywhichisstraightforward toimplementandwhose predic-tionsareeasily understood.Mostimportantly,itrepresentsastep forwardintakingintoaccountthefullphysics ofelectron diffrac-tion in matter by considering the full distribution of energies of channelingelectronsandproducesaccuratepredictionswhen com-paredtoexperimentalpatterns,asshowninSection3.2.
InSection2we describethetypical geometriesforEBSD,TKD andECP data acquisition andformulate a general expression for the thickness integrated back-scattered electron intensity that is applicabletoallthreediffractionmodalities.Wedescribethe par-ticulars of the Monte Carlo trajectory simulations in Section 2.2, alongwiththeresultingdifferencesbetweenthemodalities. Mas-ter patternsforthethree modalitiesare describedandcompared inSection 3.1.InSection3.2wecompareexperimentaland simu-latedTKDpatterns,andSection3.3illustrateshowtherecently de-velopeddictionary indexingtechnique[19]canbeapplied toTKD patterns.Weconcludethepaperwithabriefdiscussionand sum-maryinSection4.
2. Theoreticalmodel
2.1. Energyanddiffractiondistanceintegratedelectronintensity
The simulationof the (back/forward-)scatteredelectron distri-bution emerging from a sampleilluminated with a fine, nearly-parallel,electron probecan be achievedingeneralby integrating over both the energyrange ofthe exiting electrons and the dis-tancetraveledin thesample betweenthescatteringsite andthe sample surface. The probability of a (B/F)SE emerging from the sampleinthe directionkˆ (the hatindicatesa unitvector)canbe writtenasfollows:
P
(
kˆ)
=n∈A.U.
Pn
(
kˆ)
, (1)whereA.U.standsforasymmetric(primitive)unitandtheindexn runsoverall positionsintheasymmetric unit.The probabilityPn isdefinedas:
Pn
(
kˆ)
=j∈Sn
σ
j EmaxEmin
dE
t0(E)
0
dt
λ
¯kˆ(
E,t)
|
kˆ
(
rj;E,t)
|
2. (2)Here,
σ
j=Z2jDj (with Z the atomic number and D the Debye– Waller factor) isthe Rutherford scatteringcross section foratom j intheset ofequivalentpositions Sn; Emax is themaximum
en-ergy(potentiallytheincidentbeamenergyE0)andEminthelowest
energyconsideredinthecalculation;tisthedistancebetweenthe scatteringsiteandthesamplesurface,measuredalongtheexit di-rection;t0(E) isthemaximumdistancetobe considered;
λ
¯kˆ(
E,t)
ei-therthe Blochwave approachorthescatteringmatrixformalism. Theweightingfunction
λ
¯ isdefinedas:¯
λ
kˆ(
E,t)
≡λ
kˆ(
E,t)
Nt0
(
E)(
Emax−Emin)
,(3)
where
λ
kˆ(
E,t)
represents an energy-depth-direction distributionobtainedfrom Monte Carlo (MC) simulations, to be discussed in thefollowingsection,andNisthetotalnumberofincidentbeam electrons.Thenormalizationfactorinthedenominatorrendersthe integrationsinEq.(2)dimensionless.
Eq. (2)is valid forall (B/F)SE diffractionmodalities, including EBSD,ECPandTKD.Thedifferencesbetweenthemlieinthenature ofthe sample(bulk vs. thinfoil), the geometry ofthe scattering process(back-scatteringvs. forwardscattering),andthesubset of electronscarryingthecoherentdiffractionsignal(allbackscattered electronsvs.(B/F)SE1electrons).Thesedifferenceswillbeencoded inthe geometrydependent weighting function
λ
¯ foreach ofthe modalities.TheMonteCarlomodelenablesustopredicthowanyofthese systemparameters influence the form ofthe weighting function. Forinstance,inthenextsectionwediscusstheimpactofdifferent samplegeometriesonTKDpatterns,whileinSection2.3theeffect offoil thicknessis investigated.Then, in Section 2.4the sample-detectorgeometryisconsideredasausefulsystemparameterthat canidentifyspecialcasesforwhich thenumericalsolutionofthe scatteringprocesscanbesimplifieddramaticallyviatheuseof so-calledmasterpatterns.
2.2.MonteCarlotrajectorysimulations
The use of MonteCarlo simulations inpredicting energy and spatialdistributionofdiffractingelectronshasbeendescribed be-foreforEBSPs[1]andECPs[2]onbulksamples.Thesesimulations employJoyandLuo’s [20]modifiedversionofBethe’scontinuous slowingdownapproximation(CSDA)asanempiricalestimationfor asumofinelasticscatteringprocessesprobabilities.The probabil-itiesof elasticscatteringevents aredetermined fromthe Ruther-fordscatteringcrosssectioninthesinglescatteringapproximation. Therefore,the lossofenergyisuniquelydeterminedby theCSDA whilethe angular deflections from the original direction are de-fined by the elastic scatteringevents. For further details on this simulationapproachwerefertothebookbyJoy[18].
We apply a similar approach for the TKD modality with the modificationthatthesampleisnowathinfilmandtheescape sur-faceisnot thesameastheentryone.Acollimated beamof elec-tronsatincidentbeamenergyenterthetopsurfaceandstartboth losingenergyandscatteringawayfromtheir original trajectories. Eventually they will suffer one final forward-scattering event af-terwhichtheywilldiffractontheirwayoutofthebottomsample surfaceandreachthedetector.Theenergyanddepthdistributions foreach scattering directionof thislast eventis predicted using theMC modelsinceall eventsleadingtoitcanbeassumedtobe stochastic.Thesedistributionsarethenbinnedforeasystorageand usedasestimatedvaluesoftheweighingfunction
λ
¯kˆ(
E,t)
.Additionally,theMonteCarlomodelcanbeusedtopredict gen-eralelectrontrajectoriesinsidethesampleandthesystem parame-tersthatmightaffectthem.InFig.1weshowangular(directional) distributionsofescapingelectronspredictedby theMCmodelfor theTKDmodality.Theintensities areshownasstereographic pro-jections(SPs)inthe sample’ssouthern hemisphere fora beamof 20 keV electrons incident on a 200nm thick Ni foil. By binning theenergyvaluesoftheelectronsescapingfromthebottomofthe foilintohighlossenergyelectrons(escapeenergy(Ee) <17.5keV), mediumlosselectrons(17.5keV ≤Ee<18.5keV)andlow-loss en-ergyelectrons(Ee>18.5keV)wecanshowtheeffectofenergy fil-teringandobservethebehaviourofdifferentenergyelectrons.
Fig.1(a)showsprojectionsforthecasewhenthesampleis hor-izontalandtheelectronbeamnormal.Herewecanobserve,as ex-pected, that higher energy transmitted electrons are much more focusedinthemiddleofthesouthernhemisphere,whichhappens tocoincidewiththedirectionoftheincidentbeam.Withincreased energylosswecanobserveanincreaseintrajectoryrandomization ordiffuseness. Thiscan be explainedby considering the possible trajectories of electrons inside the sample andtheir correspond-ingenergyloss.Electronsescapingthesamplewithenergiesclose totheincidentbeamwillnothavedeviatedfarfromtheincident direction.Relativetothis,highlosselectronsaremorelikelyto es-cape atlarge angles totheir incident direction. Veryhighenergy losselectronsappeartohavenopreferredescapedirectionandwe canexpecttheseelectronstoonlycontributetoimagebackground (FSE2).
InFig.1(b)weinvestigatetheeffectoftiltingthesampleonthe angulardistribution ofexiting electronsfromthe bottom surface. Similarly,thehighenergyelectrons willnotdeviatefarfromtheir incident trajectories.However, in thiscase, theincident direction doesnotcorrespondtothecenteroftheSPspaceandweobserve that thedirectional distribution ofthelow losselectrons clusters 30°belowtheSPhorizon.Thetrajectoriesofhigherlosselectrons starttoberandomizedintheentireSPspace.Wecanalsoobserve intheseimageshowtheradialsymmetryofelectronscatteringis broken bythe tiltangleofthesample. Finally,theangular distri-butionofthehighestlosselectrondistributionwilllookthesame asfortheflatsampleastheir“memory” oftheincidentdirection islost.
TheoutlineintherightmostcolumnofFig.1(a)and(b)depicts atypicaldetectorprojectedontothestereographicdisk.The detec-torhas dimensions24×36mm2 andisinclinedby 10°fromthe
vertical direction. The perpendicular distancefrom theexit point onthebottomofthesampletothedetectoris20mm,andthetop edgeofthedetectorliesinthesampleplaneforthe0°orientation. The detectorbottom is closest to thecenter ofthe stereographic projection.For0°sampletilt,mostofthescatteredelectrons miss the detector surface; for a −30◦ sampletilt, the intensity maxi-mum movesupwardsonto the lower partofthe detectorandat thesametime thedetectorprojection movesclosertothecenter ofthestereographicdisk,indicatingthatasignificantlylarger num-berofelectronswillreachthescintillator. Itshouldalsobenoted thatatypicalrawTKDpatternwilldisplayarathersteepintensity gradientfromtop tobottom,inagreementwiththeintensity dis-tributioninsidethedetectoroutlineinFig.1(b)(rightmostimage). It becomesapparent that thesample geometryconstitutesan importantparameterintheformationoftheKikuchipatterns. Sim-ilarlytotheEBSDcase,wherethesampletiltdeterminesthe pre-ferredtrajectoriesofelectronsofdifferentenergiesscatteringback fromthesample[1],thetiltofthethinfilminTKDwilldirectly in-fluencethe angulardistributionoftransmittedelectrons suffering diffraction atdifferent energies. In the following section we will carefullyreviewtheeffectofanothersystemparameter,the sam-plethickness,ontheTKDdiffractionpatterns.
2.3. SamplethicknessinTKD
WhilefortheEBSDandECPmodalitiesoneonlyneedstoruna singleMonteCarlosimulationtoobtaintheenergy-depth-direction histogram
λ
¯k(
E,t)
for a bulk sample, for the TKD case, the MC simulation resultsdepend onthe thickness, t,ofthe sample. The largerthe thickness, themoreenergyan electron willloseon its wayto theexitsurface, andthis willshiftthe entireexitenergy distributiontolowerenergiesforincreasingsamplethickness.thick-Fig.1. DirectionaldistributionsoftransmittedelectronsintensityinTKDgeometryfortwosampletilts(showninthefirstcolumn):0°(a)and−30◦(b).Theintensitiesare
shownhereasstereographicprojectionswheretheintersectionofthehorizontalandverticallinesindicatethemiddleofthespace(verticallineisthesemicircleinthe sketch).Thefirstthreeimagesineachcaseareshowing“energyfiltered” electronintensities(reversedcontrast)whilethelastcolumndisplaysthetotalintensitydistribution.
Fig.2. KDEplotsofelectronenergyversusescapedistancedistributionsaspredictedbytheMCmodelforTKDgeometryfortwosamplethicknesses(a)100nmand(b) 200nm.Theareaenclosedbythethicklinecontains90%ofevents.Seetextforfurtherdetails.
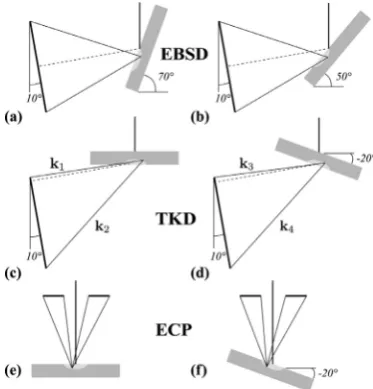
Fig.3. (a)and(b)EBSDgeometry,withthesampleinclinedat70°and50°;the de-tectorisindicatedbyathicklineandisinclinedby10°withrespecttothevertical direction.(c)and(d)showtypicalTKDgeometrieswithahorizontalsample,and oneinclinedat−20◦.Differentkdirectionsareindicatedforwhichenergy-distance KDEsdistributionsareshowninFig.4.(e)and(f)showtypicalECPgeometrieswith twodifferentsampletiltangles.
nesses, 100nm and 200nm respectively, in the TKD geometry. Darkercolours show that moreelectrons are likely toescape the samplewiththe corresponding parameters. The likelihood inten-sityacrossthetwoimageshasbeennormalizedtothemaximum valueinFig.2(a)suchthattheintensityacrossimagescanbe com-pared.Wealsoshowtheescapeenergyanddistanceregionwhere 90% of electrons are expected to come from, which is indicated by the thick line. Comparingthe two figures, 2(a) and (b),it is clearthatthethicknessofthethinsamplestronglyinfluencesthe shapeofthedistributions.Consideringthey-axis,theenergyrange ofthe electrons exiting thesample broadensandthe energy de-creases to significantly lower valuesas the thickness of the film increases.Theseobservationsalreadyindicate that weshould ex-pectmorediffusediffractionpatterns fromthickersamples when compared tothinner ones. In general, the greater theinteraction volumeofelectronswiththesample,themoreenergywillbelost by electrons before diffractionand thegreater the diffuseness of theKikuchipatterns;assupportedbyliterature[22].
[image:4.595.95.513.58.235.2] [image:4.595.82.523.278.433.2] [image:4.595.73.260.482.677.2]Fig.4. KDEplotsofelectronenergyversusescapedistancedistributionsaspredictedbytheMonteCarlomodelforTKDgeometriesanddirectionskishowninFig.3(c)and (d).Theareaenclosedbythethicklinecontains90%oftheevents.
meanfreepath.Duetothepower-lawdistributionrule,wecanbe confidentthatthevastmajorityofescapedepthsisconsidered in thismodel.
Bycomparingthe twoimagesinFig.2,itshouldbeclearthat accountingfortheeffectofsamplethicknessisessentialwhen pre-dictingaccurate electron transmissiondiffractionpatterns.In this modelthisisachievedby samplingtheabovelikelihood distribu-tionbin-wiseandconstructingthe
λ
¯k(
E,z)
weightingfunction as discussedinSection2.1.In the next section, we will investigatespecial geometries for whichelectrons reaching differentregions of thedetectorcan be describedby the same
λ
kˆ(
E,t)
function, simplifying the calcula-tionssignificantly.2.4.Specialsample-detectorgeometriesandthemasterpattern
Consider the sample and detector geometries shown in Fig.3(a–f)wherethelighterregiononthesamplesdepictsthe vol-umeinwhichelectrons suffer scatterevents.The top rowshows twopotential EBSDgeometries,onewiththesampletilted atthe standard70°anglewithrespecttothehorizontalplane,theother withthesampletiltedat50°.Aspreviouslydiscussed,thesample geometrywill determine themanner in whichthe scattering ra-dialsymmetrywillbebroken.Nevertheless,theregionofSPspace sampledbythepositionofthedetectorwillalsoinfluencethe uni-formity (or lack thereof) ofthe electron energies and diffraction distances distributions. In Fig. 3(a), the electrons that reach the topandbottomofthedetector(thicklineonthe left,inclinedat 10°fromvertical)oughttohavetravelledapproximatelythesame length inside the sample before channelling out; in Fig. 3(b) on theotherhand,theelectrons thatreachthe bottomofthe detec-torhavetraveledasignificantlylargerdistanceinsidethesample.
InTKD,thesituationissimilar:inFig.3(c)thesampleis hori-zontalandelectrons thatreachthe topofthedetectorhave trav-eled a much larger distance inside the sample before diffracting than electrons that reach the bottom. In the top row of Fig. 4, theescapeenergy-escape distancedistributionsareshownasKDE plots for electrons reaching the top (a) and the bottom (b) of the detector.We can observequalitative differencesin these dis-tributions, especially for the escape energies. The electrons that travelled larger distances before diffracted lost more energy and thereforetheirenergydistributionisshiftedtowardslowervalues. Onthe other hand,a small sampletiltof −30◦ shownin (d) re-ducesthesedifferences.Fig.4(bottomrow)showsthatthe energy-distancedistributionofelectrons reachingthe topofthedetector (c) andthe distribution of those reaching the bottom of the de-tector (d)isqualitatively the same.Notethat Fig.4 (b)–(d)show similar distributionssince allpossible trajectoriesk2, k3, k4 have similarlengthsinthesample.
Finally,fortheECPcaseillustrated inFig.3(e)and(f),asmall sampletilt does not significantly change thedistribution of path lengths inside the sample, and most trajectories have about the samepathlength.
Thisobservationhasconsequencesforthenumericalapproach to be used to obtain highquality simulated patterns. Forspecial geometries,wecannowapproximatetheweightingfunction
λ
¯ by aneffective(averaged)weightingfunction,¯
λ
kˆ(
E,t)
→λ
¯(
E,t)
, (4) [image:5.595.69.514.54.360.2]means ofbi-linear interpolation,a fastandefficientwayto com-putemanypatternsinashortamountoftime.
ForEBSDandTKDsimulationsandsampleorientationsthat de-viatesignificantlyfromthestandardorientations,one cannot ap-plytheaboveapproximation,sincetherangeofdistancestraveled inside the sample is quite broad; thus, in these cases one must carry outtheintegrationsofEq.(2)foreach individualEBSD/TKD pattern,whichresultsinaslowcomputationaltool.
ForECPs,thesituationisquite different,since onlyBSE1 elec-tronscarrycoherentdiffractioninformation;allother (BSE2) elec-tronsonlycontributetothebackgroundintensity.ABSE1electron hasnearlythesameexitenergyastheincidentelectronsincethe Rutherfordbackscattereventisthefirstmajorscatteringevent af-ter entering thesample. Therefore,nearly allBSE1 electronshave thesameexitenergyandtheenergyintegrationcanbeeliminated, leadingtothefollowingexpressionwhichisvalidfortheECPcase only(withE0theincidentelectronenergy):
PECP
n
(
kˆ)
=j∈Sn
σ
j t0(E0)0
dt
λ
¯(
t)
|
kˆ
(
rj;E0,t)
|
2, with¯
λ
(
t)
≡λ
(
z)
Nt0(
E0)
.(5)
Therefore,themasterpatternapproachisquitewellsuitedforthe ECP caseas well. For standard geometry EBSD/TKD patterns and ECPs themaster patterniscomputed onlyonce fora given crys-talstructureandmicroscopevoltage,andcanbeusedtocompute individualpatternsbyinterpolation.
TKD master pattern simulations proceed along lines similar to the previously published EBSD [1] and ECP [2] modeling ap-proaches. A uniform grid of points is generated on a spherical surfacesurroundinga hypotheticalsphericalcrystallocated atthe center;each samplingpoint representsone outgoingbeam direc-tion k, and the radius of the sphere is the maximum integra-tiondeptht0(E).Thesamplingschemeemploysthemodified
Lam-bert projection introduced in [1,23] in which a uniform grid on a square is mapped onto the sphere by means of an equal-area projection.Foreachbeamdirection, andfora givensample thick-ness,onecarriesouttheintegralsofEq.(2),usingtheMonteCarlo
λ
(E,t)weightingfunctiondeterminedforthatsamplethickness.In thefollowingsection,we showexampleTKDmasterpatternsand comparethemtosimilarpatternsfortheEBSDandECPmodalities.3. Results
3.1. ComparisonbetweenEBSD,ECP,andTKDmasterpatterns
The master pattern expression in Eq. (2) reveals that EBSD, ECP, andTKD master patternshave alot incommon; in particu-lar,thedynamicalscatteringprocessthatunderliesthegeneration of Kikuchi bands isidentical for the three diffractionmodalities. The only differences occur in the directional, depth, andenergy distributions ofthe B/FSEs that contribute to the patterns.To il-lustrate thesimilarityofthe masterpatterns,Fig.5 showsa por-tion of the upper right quadrant (centeredon the [111] pole) of the energy-weighted silicon master patterns for (a) ECP, (b) and (c) TKD for two different foil thicknesses (50 and 250 nm) and (d)EBSD.Themicroscopevoltageis20kVforallpatterns,witha specimentiltangleof70°forEBSD,0°forECP, and−20◦ forTKD. The patternsare verysimilar butdifferin smalldetails. TheTKD master patterns are plottedwith added colour in order to high-lightsubtledifferences.Fig.5(e)showslinescansthrougheachof the masterpatterns,slightlyvertically offsetto makethe profiles moreclearlyvisible.Thedifferencesindetails acrossthepatterns isseenheredistinctly.ThescanacrosstheECPpatterninFig.5(a) displayssignificantlybetterresolved peakscomparedtotheEBSD
oneFig.5(d),supportingthebetterresolutionobservedintheECP masterpattern. Since themain signal inthe ECPcaseconsistsof BSE1electrons whichhavelostonlya smallamountofenergyin thesample beforebeing backscattered,one can consider ECPs to beenergy-filteredversionsofEBSPs.
The linescans across the TKDpatterns fordifferent thickness filmsaremoresimilar toeachother,exceptfortheshiftinpeaks inthezone axis(highlightedbythe greybox).It israther appar-entthatboththepeakpositionsandthesharpnessofthethinfilm (50 nm)TKD pattern are moresimilar to the ECP pattern, while thepeaksandblurrinessofthethickfilmTKDpatternarecloserto thoseoftheEBSPs. Weexplain thisbehaviour byconsidering the energylossofelectrons contributingtothepatternsineachcase. The Monte Carlo predicted energy loss spectra for all four cases describedabove are shownin Fig.5(f) asfittedPoisson distribu-tioncurves.ThinfilmTKDpatternsareproducedbyelectronswith an energy rangevery closeto the ECP case. Similarly, increasing thesample thicknesscausesthe electron exitenergy distribution to become wider andshiftto lower energies,which corresponds to a broadening andslight blurring of the Kikuchibands due to theincreasedBraggangles; thesephenomenaarecommonto EB-SPsandthickfilmsTKDpatterns.
Itbecomesapparentthat thesamplethicknesscanbe seenas anenergyfilteringmechanisminTKD.Interms ofthetraditional Hough-basedindexingapproach,one mustthus selecta butterfly maskoftheappropriatewidth,dependingonthesamplethickness andincidentelectronenergy.Forthedictionaryindexingapproach, illustratedinSection3.3,thepatterndictionarymustbecomputed usingtheappropriateMonteCarloandmasterpatterndata,to en-sureaccurate matches betweenexperimental andsimulated pat-terns.
TheEBSDmasterpatternisanenergy-weightedaverageof indi-vidualmasterpatternsandtheintegrationovertheelectronenergy givesrisetoacontinuousrangeofBragganglesand, thus,a gen-eralblurringof themaster patternfeaturescompared to theECP case. Thiswill alsobe thecase forindividual diffractionpatterns thatareextractedfromthemasterpatternsvia bilinear interpola-tion,asexplainedin[1].
3.2.Comparisonwithexperimentalpatterns
Fig.6showstwoexperimentalTKDpatterns(leftcolumn)fora nano-crystallineAluminumsample,acquiredat30kVwitha sam-pletiltof−18◦inaFEITeneofieldemissionscanningelectron mi-croscope, usingthe TSLHikari EBSDdetectorsystem; thesample foilis approximately150 nm thick. MonteCarlo andmaster pat-ternsimulationswerecarriedoutfortheseparameters.The detec-tor parameters and grain orientations were obtained through an in-house developed interactive fitting routine, written in the In-teractiveDataLanguage[24];aninitialapproximategrain orienta-tionisobtainedbyvisually comparingthesimulatedTKDpattern with the experimental pattern. Once a reasonable orientation is obtained,thedetectorparametersarerefinedby usingadownhill simplexroutinetominimizeacostfunction,eitherthenormalized dotproductbetweenthetwopatternsortheirmutualinformation. Whenareasonablesetofparametersisobtained,thegrain orien-tationis refined, and theprocess is repeateduntil both detector parametersandgrainorientationaresatisfactory.Thisprocesswas appliedto thepatterninFig.6(a),andtheresultingdetectorand orientationparametersarelistedinTable1.
(e)
(a)
(b)
(c)
(f)
(a)
(b)
(d)
(c)
Fig.5. Portionofthestereographicprojection,centeredonthe[111]pole,ofamasterpatternforsiliconfor(a)ECP,(b)and(c)TKDforsamplethicknessesof50and250nm and(d)EBSD.Theprofilesin(e)representtheintensityalongthecentralline(markedasadashedlinein(a)),forallfourcases;theprofileshavebeenoffsetverticallyto makethemmorevisible.TheenergylossdistributionestimatedbytheMCmodelforallfourcasesisshownin(f)asPoissondistributionfittedcurves.
(a)
(b)
Fig.6. (leftcolumn)ExperimentalTKDpatternsforAluminumat30keVand(right column)correspondingsimulatedpatterns;brightnessand contrastofthe simu-latedpatternshavebeenadjustedtobettermatchtheexperimentalpatterns. Simu-lationparametersforboth(a)and(b)arestatedinthetext.Thedotproductvalues betweennormalizedpatternsareequalto0.881forthetoppairand0.834forthe bottompair,indicatingasatisfactorymatch.
(frombrightatthe bottomofthepatterntodarkatthe top) fol-lowsdirectlyfromtheuseofthedirection-dependentMonteCarlo statisticaldata,andis in goodagreement withthe intensity gra-dients of the experimental patterns. The satisfactory agreement betweensimulated and experimental patterns indicates that the
Table1
FixedandfittedparametersfortheTKDpatternsshown inFig.6;thedetectorparametersarelistedinthe tra-ditional(x∗,y∗,z∗)notationusedbycommercialEBSD
packages(distances inunits ofthe detectorwidth),as wellastheunitsusedbytheTKDsimulations,which ex-pressthepatterncenterlocationinunitsofpixelswith respecttothecenterofthedetectorandthe detector-sampledistanceLinmicrometers.TheEulerangles(ϕ1,
,ϕ2)usetheBungezxzconvention.
Fixedparameters
Acceleratingvoltage[kV] 30.0 Sampletilt[°] −18.0 Samplethickness[nm] 150.0 Detectorpixelssize[μm] 70.0 Numberofdetectorpixels 480×480
FittedParameters
x∗(xpc[pixels]) 0.5134(6.4406)
y∗(ypc[pixels]) 1.0504(264.1950)
z∗(L[μm]) 0.6985(23,471.48)
Eulerangles(a)[°] (204.20,57.54,209.26) Eulerangles(b)[°] (119.44,46.15,236.72)
energy-weighteddynamicalscatteringmodelemployedinthe pat-ternsimulationsissufficienttoobtainrealisticpatternsimulations.
3.3. DictionaryindexingofTKDpatterns
The recently developed open-source dictionary indexing ap-proach [19], an alternative to the commercially available Hough-basedpatternindexingalgorithms,isbasedontheabilityto com-pute a library (dictionary) of diffraction patterns for a uniform samplingof orientation spaceanda given setof geometrical de-tectorparameters. Thetechniquehasbeenappliedsuccessfullyto EBSPs [25]andECPs[2],andinthissection wedescribe thefirst applicationofdictionary-basedindexingtoTKDpatterns.
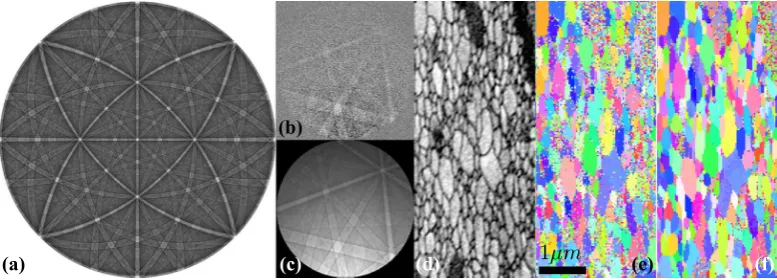
[image:7.595.57.534.56.306.2] [image:7.595.35.282.358.611.2] [image:7.595.344.513.450.563.2]Fig.7. (a)TKDmasterpatternforAlat30kVforafoilthicknessof100nm;(b)selectedexperimentalpatternusedforthedetectorparameterdetermination;(c)simulated patterncorrespondingto(b);(d)orientationsimilaritymap(seetextfordetails);(e)[010]inversepolefigure(IPF)obtainedwiththecommercialOIM-8indexingsoftware; and(f)[010]IPFobtainedusingthedictionaryindexingapproach.
DC magnetron sputtering Al on a Ag seed layer deposited on a (111)Sisubstrate;fordetailssee[26,27].FoilsforperformingTKD were shaped using e-beamlithography, then released by etching thesubstratewithXeF2.FinalremovalwasdoneusingstandardFIB
liftout techniquesonan FEIHelios dualbeamFIB-SEM.The sam-ple was mounted on a 38°pre-tilted holder andthe microscope stagewastilted20°sothatthesamplewastiltedat18°towardthe EBSDdetector,whichwastiltedat8°fromtheverticalorientation. TKDwasperformedonanFEITeneoSEMFEG-SEM,equippedwith an EDAX/TSLHikariEBSDcamerawith480×480pixelsofsizeof 70μm.Thesmalldatasetconsistsof86×196samplingpointswith a 30nm stepsize,resultinginafield ofviewof2.58×5.88μm2,
andeach TKDpatternwasbinnedby a factorof2× toa size of 240×240pixels. Thepatterns werefirst indexedinreal-time us-ingtheEDXOIM-8indexingsoftware[28],resultinginanindexing successrateof95.6%.
A TKD master pattern, shown in Fig. 7(a), was computed us-ing the approach described in Section 2, and orientation space was uniformly sampled using the cubochoric sampling approach described in [13,29], to obtain an orientation set consisting of 333,227uniqueorientationsinsidethecubicRodrigues fundamen-talzone;thiscorrespondstoasamplingoforientationspacewith anaverageangularstepsizeof1.4°.ThepatternshowninFig.7(b) wasusedtorefinethedetectorparametersusingtheapproach de-scribedinSection3.2andusedalongwiththeTKDmasterpattern to index the experimental patterns; the corresponding simulated patternisshowninFig.7(c).TheexperimentalandsimulatedTKD patternswerepre-processed(high-passfilter,followedbyadaptive histogramequalization [30]) beforecomputationofthe dot prod-ucts; pre-processing,computation of the 333,227 simulated pat-terns, and indexing of the 16,856 experimental patterns took a total of 35 min on 24Intel Xeon E5-26702.30GHz CPU threads (forthepatternsimulation)andanNVidiaGeForceGTX1080GPU (forthedotproductcalculation).Theresultingorientationsand re-latedinformationwere exportedtobothabinaryHDF5file anda CTF fileforfurther processing. Thebulk ofthe computationtime isspent onthe simulatedpatterns;pre-computingthosepatterns andstoringtheminafilewouldsignificantlyspeedupthe index-ingprocess.
Fig.7(d)showsanorientationsimilaritymap.Thedictionary in-dexingapproachproducesalistofthetopNbestmatches (dictio-narypatternswiththeNhighestdotproducts,whereNistypically set to 30). For each sampling point, the orientation similarity is computedbydeterminingtheaveragenumberoftopmatchesthat this sampling point has incommon with its four nearest neigh-bors;thisvalueisthendisplayedasagrayscaleimage,asshown inFig.7(d).Sincesamplingpointsneargrainboundarieswillhave
fewerbestmatchesincommonwiththeir neighbors,the orienta-tion similaritymap (OSM)provides an easy overview ofthe mi-crostructureinwhichgraininteriorshaveauniformintensitylevel andallgrainboundarieshavelowerintensity.
The[010]inversepolefiguresinFig.7(e)and(f)wereobtained by thestandard commercial OIM-8 indexing package (e)and the dictionaryindexingapproach(f).Thedarkregionsnearthetopof thefieldofview inFig.7(d)correspondto surfacecontamination fromtheXeF2etchingstepandresultinclustersofincorrectly
in-dexedorunindexablepointsinbothindexingapproaches;patterns were deemed to be unindexable when either the Image Quality waslow(according tothecommercial softwareanalysispackage) orthe Pattern Sharpness parameter, as definedin [31], waslow. Overall,thedictionaryindexingapproachhasfewerincorrectly in-dexedpoints,inparticularneargrainboundaries.
4. Discussionandconclusions
Inelasticscattering,aphenomenonusuallydiscardedin diffrac-tion simulations, has direct influence on the energy distribution ofdiffracting electrons and, consequently, on the imagedKikuchi patterns. The broader the energy distribution of diffracting elec-trons, the more diffuse the Kikuchi band edges. Using a Monte Carlo modelwe canobserve that the length ofelectron trajecto-riesbeforediffractionisadeterminingfactorinthebroadeningof the energydistribution. This factor, in turn,can be controlled in the Transmission KikuchiDiffraction modality through the thick-nessofthesample,actingeffectivelyasanenergy-filtering mecha-nism.Anotherdeterminingfactorfortheenergydistributionisthe sample-detector geometry which influences both TKD and EBSD modalities.
[image:8.595.108.497.57.197.2]whenthe TKD detector ifmounted horizontally,below the sam-ple,theelectrontrajectoriesinsidethesamplewillhavea narrow rangeofescapedistances, sothatcontrastinversions arealsonot expectedtooccur.Astatisticalmodelmoresensitivetotheoutlier casesoflongdistancechannelingelectrons isthereforenecessary ifwearetocorrectlypredictbandcontrastinversion.
The energy-weighted scattering model is shown to correctly predictKikuchibandssharpness(definedassignal tonoise inten-sity) forthe differentSEM modalities. When usedfor the dictio-naryindexingapproachitwasshowntoproduceindexedTKD pat-ternswithfewerincorrectlyindexedpointscomparedto commer-cialHoightransformbasedindexingsoftware.
Acknowledgements
The authorswouldliketothankProfessorXinghang Zhangfor providingthe nano-crystallineAl andD.S. GianolaandE. Yao for helpfuldiscussions.EP wouldliketo acknowledgeSUPAfortravel support and EPSRC and NPLfor funding; SSand MDG acknowl-edge a Vannevar Bush Fellowship, ONR # N00014-16-1-2821, for financialsupport;PCacknowledgesONRN00014-16-1-2982for fi-nancialsupport. Theauthors would alsolike to acknowledgethe instrumentationandcomputationalfacilitiesoftheMaterials Char-acterization Facility at Carnegie Mellon University under grant # MCF-677785.
Supplementarymaterial
Supplementary material associated with this article can be found,intheonlineversion,at10.1016/j.ultramic.2018.01.003.
References
[1] P.Callahan,M.DeGraef,DynamicalEBSDpatternspartI:patternsimulations, Microsc.Microanal.19(2013)1255–1265.
[2] S.Singh,M.DeGraef,Dictionaryindexingofelectronchannelingpatterns, Mi-croscosc.MicroAnal.23(2017)1–12.
[3] A.Schwartz,M.Kumar,B.Adams,D.Field(Eds.),ElectronBackscatter Diffrac-tioninMaterialsScience,Springer,2009.
[4] A.Winkelmann, G. Nolze, S. Vespucci, G. Naresh-Kumar, C. Trager-Cowan, A.Vilalta-Clemente,A.Wilkinson,M.Vos,Diffractioneffectsandinelastic elec-trontransportinangle-resolvedmicroscopicimagingapplications,J.Microsc. 267(2017)330–346.
[5] R.Keller,R.Geiss,TransmissionEBSDfrom10nmdomainsinascanning elec-tronmicroscope,J.Microsc.245(2011)245–251.
[6] P.W.Trimby,Orientationmappingofnanostructuredmaterialsusing transmis-sionKikuchidiffractioninthescanningelectronmicroscope,Ultramicroscopy 120(2012)16–24.
[7] D.Joy,Channelinginandchannelingout:theoriginsofelectronbackscattering andelectronchannelingcontrast,in:Proceedingsoftheannual meeting-Elec-tronsMicroscopySocietyofAmerica,SanFranciscoPress,1994,pp.592–593.
[8]D.Coates,Kikuchi-likereflectionpatternsobtainedwithscanningelectron mi-croscope,Philos.Mag.16(144)(1967)1179–1185.
[9]D.Joy,D.Newbury,D.Davidson,Electronchannelingpatternsinthescanning electronmicroscope,J.Appl.Phys.53(1982).
[10]L.Reimer,ScanningElectronMicroscopy– PhysicsofImageFormationand Mi-croanalysis,Springer,Berlin,1998.
[11]A.Winkelmann,C.Trager-Cowan,F.Sweeney,A.Day,P.Parbrook,Many-beam dynamical simulation ofelectron backscatter diffraction patterns, Ultrami-croscopy107(2007)414–421.
[12] Y.Picard,M.Liu,J.Lammatao,R.Kamaladasa,M.DeGraef,Theoryof dynam-icalelectronchannelingcontrastimagesofnear-surfacecrystaldefects, Ultra-microscopy146(2014)71–78.
[13]S. Singh, M.DeGraef,Orientationsampling fordictionary-based diffraction patternindexingmethods,Modell.Simul.Mater.Sci.Eng.24(2016).
[14]A.Howie,InelasticscatteringofelectronsbycrystalsI.Thetheoryof small-an-gleinelasticscattering,Proc.R.Soc.Lond.A271(1963)267–287.
[15]A.Winkelmann,G.Nolze, M.Vos,F.Salvat-Pujol, W.Werner, Physics-based simulationmodelsforEBSD:advancesandchallenges,IOPConf.Ser.109(1) (2016)012018.
[16]H.Yoshioka,Effectofinelasticwavesonelectrondiffraction,J.Phys.Soc.Japan 12(1957)618–628.
[17]B.D.Forbes,Thermaldiffusescatteringintransmissionelectronmicroscopy, Ul-tramicroscopy111(2011)1670–1680.
[18]D.Joy,MonteCarloModelingforElectronMicroscopyandMicroanalysis, Ox-fordUniversityPress,USA,1995.
[19]Y. Chen,P.S.U., D.Wei,G. Newstadt, M.Jackson, J.Simmons,M. DeGraef, A.Hero,AdictionaryapproachtoEBSDindexing,Microsc.Microanal.21(2015) 739–752.
[20]D.C.Joy,S.Luo,Anempiricalstoppingpowerrelationshipforlow-energy elec-trons,Scanning11(1989)176–180.
[21]D.Scott,MultivariateDensityEstimation:Theory,Practice,andVisualization, JohnWiley&Sons,NewYork,Chicester,1992.
[22]K.P. Rice, R.R. Keller,M.P. Stokyovich,Specimen thickness effectson trans-missionKikuchipatternsinthescanningelectronmicroscope,J.Microsc.254 (2014)129–131.
[23]D.Ro¸sca,Newuniformgridsonthesphere,Astron.Astrophys.520(2010)A63.
[24]E.V.I. Solutions, Interactive data language (version 8.6), 2016. URLhttps:// search.library.wisc.edu/catalog/9910207172502121.
[25]K. Marquardt,M. DeGraef, S.Singh,H. Marquardt,A.Rosenthal,T.Hiraga, Quantitativeelectronbackscatter diffraction(EBSD) dataanalysesusingthe dictionaryindexing(DI)approach:overcomingindexingdifficultiesin geologi-calmaterials,Am.Mineral.(2017).(inpress)
[26]D.Bufford,H.Wang,X.Zhang,Highstrength,epitaxialnanotwinnedAgfilms, ActaMater59(1)(2011)93–101.
[27]D.Bufford,Y.Liu,Y.Zhu,Z.Bi,Q.Jia,H.Wang,X.Zhang,Formation mecha-nismsofhigh-densitygrowthtwinsinaluminumwithhighstacking-fault en-ergy,Mater.Res.Lett.1(1)(2013)51–60,doi:10.1080/21663831.2012.761654.
[28]S.Wright,M.M.Nowell,S.P.Lindeman,P.P.Camus,M.DeGraef,M.A.Jackson, IntroductionandcomparisonofnewEBSDpost-processingmethodologies, Ul-tramicroscopy159(2015)81–94.
[29]D.Ro¸sca,A.Morawiec,M.DeGraef,Anewmethodofconstructingagridin thespaceof3Drotationsanditsapplicationstotextureanalysis,Model.Simul. Mater.Sci.Eng.22(2014)075013.
[30]S.Pizer,E.Amburn,J.Austin,R.Cromartie,A.Geselowitz,T.Greer,B.Romney, J.Zimmerman,K.Zuiderveld,Adaptivehistogramequalizationanditsvariation, Comput.Vision,Graph.ImageProcess.39(1987)355–368.

![Fig. makeand5. Portion of the stereographic projection, centered on the [111] pole, of a master pattern for silicon for (a) ECP, (b) and (c) TKD for sample thicknesses of 50 and 250 nm (d) EBSD](https://thumb-us.123doks.com/thumbv2/123dok_us/1405743.93527/7.595.344.513.450.563/makeand-portion-stereographic-projection-centered-pattern-silicon-thicknesses.webp)