City, University of London Institutional Repository
Citation
:
Wang, Y., Wei, Y., Liu, T., Sun, T. ORCID: 0000-0003-3861-8933 and Grattan, K.
T. V. ORCID: 0000-0003-2250-3832 (2018). TDLAS detection of propane/butane gas mixture
by using reference gas absorption cells and partial least square (PLS) approach. IEEE
Sensors Journal, 18(20), pp. 8587-8596. doi: 10.1109/JSEN.2018.2865508
This is the accepted version of the paper.
This version of the publication may differ from the final published
version.
Permanent repository link:
http://openaccess.city.ac.uk/id/eprint/20719/
Link to published version
:
http://dx.doi.org/10.1109/JSEN.2018.2865508
Copyright and reuse:
City Research Online aims to make research
outputs of City, University of London available to a wider audience.
Copyright and Moral Rights remain with the author(s) and/or copyright
holders. URLs from City Research Online may be freely distributed and
linked to.
City Research Online:
http://openaccess.city.ac.uk/
[email protected]
Abstract—Propane/butane gas mixtures are frequently used in the petroleum industry and sensors that provide early warning of the concentrations of such mixtures are essential for avoiding explosion hazards. Tunable diode laser absorption spectroscopy (TDLAS) underpins this work, exploiting infrared absorption spectroscopy and providing the potential to provide a highly accurate, in-situ and intrinsically safe method for the detection of propane/butane gas mixtures. In consideration of the significant spectral overlap of the absorption spectral features of propane and butane, an experimental approach using reference gas cells has been proposed to remove the severe absorption spectral overlapping that occurs, by using known samples of both propane and butane gas in the reference gas cells. The partial least squares method (PLS) was used to calculate the concentrations of propane and butane individually in the mixture. The spectral overlapping can be effectively removed, resulting in all the fitting correlation coefficients for the spectral extraction being higher than 0.96. A field test carried out using simulated gas samples shows that near both the first and second alarm values set, high accuracy can be obtained in the measurement, with all the relative errors in the calculated concentrations of propane and butane (in the gas mixture samples) below 3% lower explosion limit (LEL), which meets the requirement of the detection standards in the petroleum industry. This work provides an experimental verification which then supports this being an effective TDLAS-based field sensor system for the petroleum industry to be used in practice.
Index Terms—propane detection, butane detection, TDLAS, reference gas cells, PLS
I. INTRODUCTION
P
ROPANE and butane are important constituents of fossil fuels and they are used widely in the petrochemical industries internationally[1]-[5]. Both propane and butane areThis work was supported by The National Natural Science Foundation of China (F050304), Natural Science Foundation of Shandong Province, China (ZR2016QZ006), Natural Science Foundation of Shandong Province, China (ZR2016FB03) and Youth Science Foundation of Shandong Academy of Sciences (2017QN004). The support of the Royal Academy of Engineering and the George Daniels Educational Trust are also gratefully acknowledged.
Yin Wang, Yubin Wei, and Tongyu Liu are with the Laser Research Institute, Qilu University of Technology (Shandong Academy of Sciences), Jinan, China( e-mail: [email protected]; [email protected]; [email protected]).
Tong Sun and K.T.V. Grattan are with the City Graduate School and School of Mathematics Computer Science and Engineering, City, University of London, London, UK( e-mail: [email protected]; [email protected]).
colorless and combustible and have similar chemical structures[6]. Explosions can readily be caused when propane/butane gas mixtures are ignited by flames, or even by sparks[7][8]. Furthermore, propane and butane are volatile at pressures around 1 atmosphere and across the daytime temperature range (which compares with hydrocarbons which are non-volatile and having more than 5 carbon atoms frequently used in petroleum and petrochemical materials). Moreover, compared with other hydrocarbon constituents with 1-2 carbon atoms and which have a high vapor pressure (such as ethane and methane), together with butane and propane they are more dense than atmospheric gases and thus tend to accumulate in low-lying areas (and thus are more difficult to eliminate)[9][10]. These characteristics mean that propane/butane gas mixtures frequently present an industrial hazard and thus early warning of potential explosions is needed. It is thus imperative that monitoring systems for these gas mixtures which work well outside the laboratory are available. Currently, there are different types of sensors that could be used, such as electrochemical sensors and semiconductor sensors[11]-[14]. However, such sensors cannot be considered to be ‘safe’ under all circumstances (due to the potential spark hazards that occur due to being mains electricity-powered), and thus they do not offer the secure, in-the-field monitoring of propane/butane gas mixtures that are needed.
Infrared absorption spectroscopy is a good method for such monitoring of propane/butane gas mixtures in practical applications and outside the laboratory, due to its high sensitivity and potential for intrinsically safe detection[15]-[17]. The underpinning technique behind the work is the use of Tunable Diode Laser Absorption Spectroscopy (TDLAS) which employs laser diode sources and thus allows the determination of the gas concentration from the infrared absorption of the laser light in the gas mixture. The stability of these laser sources makes them well suited to this application to detect the group of hydrocarbons, in gaseous form, discussed earlier. A key feature is the stability of the source, the excellent resolution seen and the opportunity to make sensors which work well outside the laboratory [18][19]. Furthermore, TDLAS systems are readily compatible with fiber optic components from the communications industry, allowing compact systems – allowing a feature which is highly efficacious in propane/butane gas mixture sensing to be developed and which is safe to use, with no electrical currents flowing at the sensor head, making the detection approach
TDLAS detection of propane/butane gas mixture
by using reference gas absorption cells and
partial least square (PLS) approach
intrinsically safe. Thus such TDLAS-based sensor systems are well suited to monitoring purposes near the oil-gas storage and transportation applications mentioned.
In recent years, the literature shows a number of papers which discuss propane and butane monitoring, by the use of TDLAS-based techniques. Kluczynski et al. first reported using TDLAS detection of propane used for propylene manufacture, employing a GaInAsSb/AlGaInAsSb DFB laser which operates at 3.37µm[20]. Jana Jágerskáet et al. described the TDLAS approach to the detection of propane and butane (using a wavelength of ~3.3μm, exploiting the properties of a (VECSEL)[21]). Jiang Meng et al. reported the design of a TDLAS-based propane leak detection system using a (DFB-ICL) type laser system, which uses distributed feedback in an inter-band cascade approach[22]. However, a weakness with all these systems is that current commercial tunable lasers, emitting at wavelengths of near 3.3μm are not readily compatible with the cheap communications grade optical fiber and other optical components that are readily available. Optical fibers transmitting well in this 3.3μm wavelength range are often less readily available and expensive. This limits the potential to use this mid-infrared sourced method, especially for the monitoring applications of the type discussed. Using the near-infrared wavelength band allows the much greater variety of lasers, optical fiber and components operating in that spectral region to be used. However, comparing with the absorption feature at ~3.3μm, the near-infrared absorption spectral features of propane and butane (seen in the region from 1680nm to 1690nm) mainly consist of multiple spectral bands which overlap with each other, in the case of propane and butane, combined with an absorbance level in the near infrared that is not as strong as that at ~3.3μm[23]-[24]). Thus while it is difficult to find obvious ‘standalone’ absorption peaks to allow calculation of the individual component concentrations (which would follow the usual approach to TDLAS spectral analysis) from across the total absorption spectrum, what is worse is that for a propane/butane gas mixture, the absorption spectra of propane and butane severely overlap with each other in that near infrared region. Thus calculating the individual component concentrations is problematic because the spectra include the absorption features of both propane and butane at every wavelength considered between 1680 and 1690 nm. An appropriate algorithm, such as PLS, has been used as it has the potential to allow calculation of the individual components in the gas mixture. The PLS algorithm is a basic tool of chemometrics[25] and has been widely used in infrared spectroscopy analysis[26]-[28]. For the detection of the components of the propane/butane mixture, prior published research also used the PLS approach to undertake a calculation of the component concentrations of propane and butane directly, by using the absorption spectral data of the gas mixture[29]. However, the weakness of the light signal and the noise detected limits the use of the calibration model and the results obtained for the individual gas concentrations would be inaccurate by a significant factor. This problem is exacerbated when the sensor systems are physically distributed in the space where there are petroleum storage tanks, because greater light signal losses may be expected. These losses may be different across the sensor network due to the different lengths of transmitting optical fibers employed. Currently, there are few
reports on in-the-field use of such systems for quantitative detection of propane/butane gas mixtures using the TDLAS technique, whether at wavelengths near 3.3μm or in the near infrared band.
Aiming to overcome the problems discussed, this work makes use of the spectral features of propane, butane and their mixtures in the spectral region from ~1682nm to ~1686nm to allow for more accurate detection of the component concentrations of the propane and butane present in typical mixtures seen in industry. In this paper, the real-time absorption spectra of propane and butane in the gas mixture were firstly separately extracted by using the real-time spectra of known samples of both propane and butane gas placed in the reference gas absorption cells, in an approach which can also simultaneously eliminate the noise arising from the different signal losses along the transmission optical path. Thus each absorption spectrum ‘weight’ of the propane component and that of the butane component in each gas mixture sample could be obtained. Following that, the ‘weights’ and the concentrations of the propane and butane components in the sample mixtures were utilized to build the PLS model. Due to the isolation of the spectral overlap, only a few samples are needed to build the PLS model and high measurement precision can be obtained, based on the model. Unlike the traditional PLS modeling approach, instead of the absorption spectra data themselves, the spectral weights of the corresponding components in the gas mixture were utilized to build the PLS model used in this work. The PLS approach helped in avoiding the multi-collinearity of the model matrix used[30]. The combination of the spectral overlap isolating and the PLS method made it possible to obtain the model precisely, with a small number of training samples. Finally the accurate measurement of the concentrations of the individual propane and butane components in the gas mixture samples used was obtained, based on the PLS model of the absorption spectra weights and concentrations created. The quality of the test results obtained are such as to satisfy the requirements for the type of system that could be used practically for early warning of the levels of gas concentrations that could result in an explosion hazard. This work shows that the proposed approach has real potential for the important applications in the oil and gas industry considered.
II. SPECTROSCOPICPRINCIPLESANDEXPERIMENTALALSET-UP
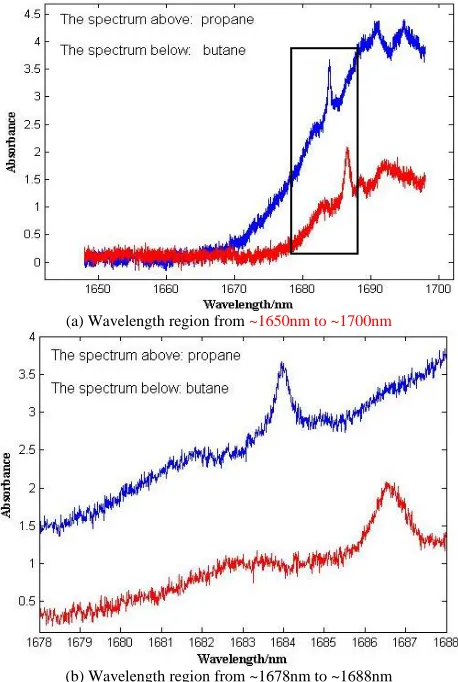
The absorption spectra of separate, individual samples of ~9% propane and of ~3% butane, obtained in the region from ~1650nm to ~1700nm (with the gas at 25℃ and a pressure of 1 atm) are shown as Figure 1a. These spectra show that the most important features lie in the narrow region from ~1678nm to ~1688nm, a region marked on Figure 1a by a rectangle (and shown in greater detail in Figure 1b).
it comes to separating out the individual spectral components. However, the two peaks are close in spectral terms, which means that only one tunable laser is needed to cover the wavelength range encompassing the two peaks. With a single laser system, the sensor system price is reduced, as is the use of electrical power (important for battery powering of such sensor systems in-the-field). Thus satisfying these important requirements of low cost and reduced power consumption, this makes such a system well suited to being used in the oil and gas (and indeed other) industries. Based on this, a VCSEL laser source operating over the range from 1678.7 nm to 1686.1nm was selected – this laser can only cover part of the absorption peak feature of butane at ~1686.5nm, but the difference in the spectral features of propane and butane in this wavelength range are sufficient for the removal of the overlap in the spectra, allowing subsequent quantitative analysis of the propane and butane features, which then is confirmed by the experimental analysis carried out below.
The practical arrangement to validate this was set up, as shown in Figure 2. The VCSEL was ‘pigtailed’ and supported by using a dedicated control system, operated at a repetition rate of 25Hz. The FWHM of the laser is ~1pm, over the operating wavelength range used and the laser operating temperature was fixed at 25℃. The laser beam transmitted along the low loss single mode fiber used which allowed a
>1km separation of the laser source from the site to be observed of >1km: showing that this approach is suitable for in-the-field measurements of propane and butane leakage, and doing so and across large sites.
In light of the important spectral band overlap between propane and butane that can cause problems with the analysis of the spectra received and focusing on resolving their spectral band features shown in Figure 1, four similar gas cells were used in the process of analyzing the spectral bands and allowing the removal of the overlapping features in the spectra. The three Gas Cells, labeled 1,2 and 3, were all sealed and filled with gas at 1 atm, and used as reference cells for the species in gaseous form, as discussed below.
Gas Cell 1 contained only N2, while Gas Cell 2 contained a carefully prepared propane/nitrogen mixture with a propane component fraction of 2.2%, which is the lower explosive limit (LEL) of propane. Gas Cell 3 was also filled with standard butane/nitrogen mixture, with a butane component fraction of 1.8%, which is the LEL of butane. Gas Cell 4 then was the actual sensor cell for the unknown sample, forming the gas-containing actual sensor probe to allow the detection of the propane/butane mixture at the monitoring site. To interrogate the cells, four beams, each of the same intensity given by I0 were used, created using several beam splitters. As a result, beam 1 travelled along a single mode fiber to the first of the gas cells and the residual intensity was measured using a photodetector, labeled PD1. A similar interrogation arrangement was used for the second, third and fourth beams and their residual intensities I2, I3 and I4 were measured by using photodetectors PD2, PD3 and PD4 (after the corresponding beams passed through Gas Cell 2, then to Gas Cell 3 and finally Gas Cell 4), as illustrated in Figure 2. In Gas
VCSEL
DAQ
Computer
Spliter Fiber Laser Diode
Controller
Reference Gas Cell 1 (Only Nitrogen)
Probe Gas Cell
(Mixture Gas: Propane+Butane+Nitrogen(
Amplifier1 PD1 Amplifier2 Amplifier3 Amplifier4
PD2 PD3 PD4
Fiber
Fiber
Fiber
Fiber Reference Gas Cell 2 (Standard Gas of Propane)
[image:4.612.321.557.210.511.2]Reference Gas Cell 3 (Standard Gas of Butane)
Fig. 2. Experimental setup used. VCSEL – laser used; DAQ – data acquisition and processing; PD1-4 – photodetectors (a) Wavelength region from ~1650nm to ~1700nm
(b) Wavelength region from ~1678nm to ~1688nm Fig. 1. Major absorption spectral features of propane and butane at 25℃
[image:4.612.56.285.271.612.2]Cell 1, no absorption by the nitrogen occurred over the wavelength range while by contrast, the propane in Gas Cell 2, the butane in Gas Cell 3 and the propane/butane mixture (this is the unknown mixture whose composition is to be determined) in the probe Gas Cell 4 caused some absorption of the laser beam. Multiple reflections do occur in this gas cell itself and so a diminution intensity thus cannot be avoided, even in the absence of any gas absorption at all. Thus intensity I1 can be given by:
I1= I0e−β1 (1)
where β1 equates to an intensity change due only to absorption in the gas containing vessel. The Beer-Lambert Law yields the following, where the intensities I2, I3, and I4 can be given individually as: I2= I0e−PC2SpϕpL−β2 (2)
I3= I0e−PC3SbϕbL−β3 (3)
I4= I0e−PC41SpϕpL−PC42SbϕbL−β4 (4)
where the pressure, P, is a single atmosphere, the total pressure of gas in the gas-containing vessel, since the monitoring was undertaken at this (normal) pressure; C2 and C3 are the individual partial concentrations of propane in Gas Cell 2 and butane in Gas Cell 3 respectively; C41 and C42 are separately the concentrations of propane and butane in Gas Cell 4; Sp and Sb are the spectral feature line strengths of the propane and butane separately; ϕp and ϕb are the line shape functions of the propane and butane separately; L is the overall absorption length of the absorption path (here all of the four gas cells were of the same length); β2, β3 and β4 are separately the intensity losses caused by light passing through the corresponding gas cells themselves. The resultant four photocurrent signals Ic1, Ic2, Ic3 and Ic4 were generated by detectors PD1, PD2 PD3 and PD4 when the light beam with intensities of I1, I2, I3 and I4 were monitored by the four PDs and are given by: Ic1= α1I1 (5)
Ic2= α2I2 (6)
Ic3= α3I3 (7)
Ic4= α4I4 (8)
whereα1, α2, α3and α4 are the photoelectric conversion coefficients of PD1, PD2, PD3 and PD4 respectively. Four similar Herriot optical gas cells were employed[31] – they had a 9m optical path. Losses of intensity, of values β1, β2, β3 and β4 (arising from the light passing through the gas-containing vessels) were the same and are given by: β1= β2= β3= β4 (9)
Equations (1)-(9), govern the absorbance of the propane sample in Gas Cell 2, that of the butane in Gas Cell 3 and of a propane/butane gas mixture in Gas Cell 4. These can be represented respectively, by: Ip= log ( Ic1 Ic2) = PC2SpϕpL + log( α1 α2) (10)
Ib= log ( Ic1 Ic3) = PC3SbϕbL + log( α1 α3) (11)
Im= log ( Ic1
Ic4) = PC41SpϕpL + PC42SbϕbL + log(
α1 α4) (12)
where log(α1/α2), log(α1/α3) and log(α1/α4) are constants;
PC2SpϕpL, PC3SbϕbL and PC41SpϕpL + PC42SbϕbL increase
linearly with the corresponding concentrations of propane and butane. By using four gas cells with identical structures, any signal noise caused by the intensity jitter of the laser and the laser beam energy loss along the long transmitting path can be
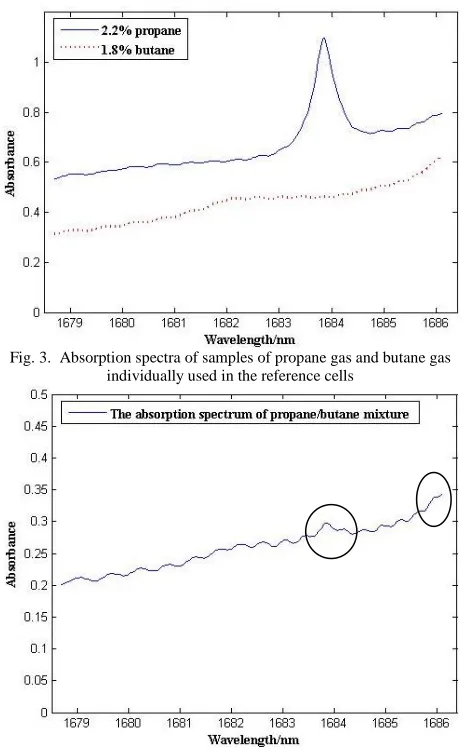
eliminated and the background spectra caused by the losses in gas cells can be simultaneously compensated through a knowledge of the ratios, Ic1/Ic2, Ic1/Ic3 and Ic1/Ic4, which enhances the signal to noise ratio for in-the-field monitoring. Based on equations (10) - (12), the spectrum showing the gas absorption of the propane gas sample in the second gas cell (number 2) and the known butane sample in Gas Cell 3 were obtained, as shown in Figure 3. The absorption spectrum of the sample of propane/butane gas mixture to be investigated was also obtained, as shown in Figure 4. By comparing Figure 4 with Figure 3, several low-level absorption features dueto both propane and butane can be observed in the spectrum of this mixture, these being marked by the circles in Figure 4. However analysis of these features is not sufficient for the quantitative analysis of propane and butane components in the mixture, needed to allow the extraction of the absorption spectra of the separate propane and butane components. Based on the absorption spectra of the known pure ‘standard’ propane and butane obtained, the spectral overlap feature seen from the absorption spectrum of the gas mixture can be removed. Doing so is a precondition for the quantitative analysis of the individual propane and butane gas concentrations.
III. ANALYSIS
The focus of this work is on detection of propane/butane gas mixture leaks, especially during transportation or in the region of petrochemical storage tanks. In this work, to evaluate the procedure that is needed in sensor operation, for the effective removal of the spectral overlap problem and to undertake a corresponding quantitative analysis of the concentrations of a sample, propane/butane gas mixture samples with known propane concentrations of between 3% - 9% LEL and known butane concentrations of between 20% - 35% LEL were created in the laboratory. The samples were created to mimic the relative concentrations of gas samples acquired from the low-lying regions close to storage tanks of actual petrochemical products which have separately been analyzed, in that way to make the samples used representative of ‘real’ situations. (Here, the ‘LEL’ corresponding to propane is the threshold concentration for an explosion to occur – 2.2%, (while the similar figure for butane is 1.8%). Specifically, in the experiment carried out, there were in total 20 sample mixtures used, consisting of different (and known) fractions of propane, butane and nitrogen, among which the concentrations of propane used which were 3% LEL, 5% LEL, 7% LEL and 9%
LEL. Further, corresponding with each of these propane concentrations, there were 5 different concentrations of butane used, set to be 20% LEL, 24% LEL 27% LEL, 31% LEL and 35% LEL. These samples were used to simulate the sort of gas mixtures that would be experienced as typical leaks in the area around oil-gas storage tanks of petrochemical products. As a result, the analysis carried out will allow not only a spectral investigation but the subsequent quantitative analysis needed to determine the individual propane and butane components present in these sample mixtures.
A. Isolating Spectral Overlap
Equation (12) indicates that the absorption spectrum of any of the propane/butane mixtures studied arises from a linear combination of the absorption of the propane component and that of the butane component. No matter what concentrations of propane and butane are present in the mixture, the concentration of propane, C41 in the mixture can be given by the following relationship:
C41= K1C2 (13)
where K1 is the proportionality coefficient between C41 and C2. Similarly, for the concentration of butane, given by C42 in the mixture, the relationship shown holds:
C42= K2C3 (14)
where K2 is the proportionality coefficient between C42 and C3. Arising from this, according to equations (10) - (14), the absorption of the propane/butane mixture can further be expressed as:
Im= PK1C2SpϕpL + PK2C3SbϕbL + log
α1
α4
= K1Ip+ K2Ib− K1log
α1
α2
− K2log
α1
α3
+ logα1 α4
= K1Ip+ K2Ib+ I0 (15)
where I0 is given by −K1log α1
α2− K2log
α1 α3+ log
α1
α4. Equation
(15) shows that the absorption spectrum of the mixture, Im is an exact linear superposition of Ip, the absorption spectrum of the pure propane gas in Gas Cell 2 and Ib, that of butane in Gas Cell 3. K1, K2 and I0 are the coefficients of this linear superposition and K1Ip represents the absorption of propane components in the mixture, K2Ib represents the absorption of butane component in the mixture and I0 represents the compensation for the spectral background caused by the difference of the PD photoelectric conversion coefficients. From the theoretical analysis, the coefficients K1, K2 and I0 can be determined by fitting K1Ip+K2Ib+I0 with Im, using the least squares method, and thus, K1, K2 and I0 can be given by:
( K1
K2
I0
) = A−1B (16)
where the matrix A is given by:
A = (
IpIp′IpIb′sum(Ip)
IpIb′IbIb′sum(Ib)
sum(Ip)sum(Ib)180
) (17)
The matrix B is given by:
B = ( IpIm′
IbIm′
sum(Im)
) (18)
[image:6.612.54.286.51.426.2]Fig. 3. Absorption spectra of samples of propane gas and butane gas individually used in the reference cells
Fig. 4. Absorption spectrum of a sample of propane/butane gas mixture used in the probe cell. Circles show the low-level absorption features due
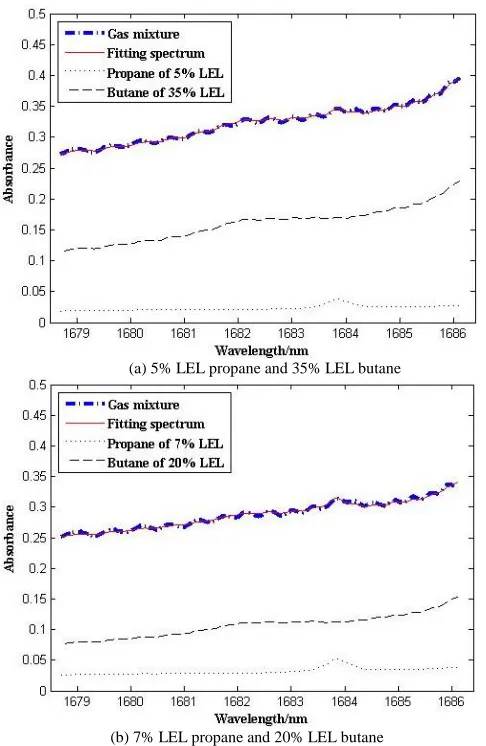
where sum(Ip) is the sum of the intensity values of Ip (at all the sampling wavelengths) and similarly, sum(Ib) and sum(Im) can be defined for the sums of Ib and Im respectively. Based on the spectral overlap removal method discussed, the absorption spectrum arising from the propane component and that due to the butane component in the gas mixture can be extracted separately from the total absorption spectrum of gas mixture. As an example, Figure 5 shows the results of the spectral overlap removal method being applied to two gas mixture samples, the first of which corresponds to a sample with 5% LEL propane (1100ppm) and 35% LEL butane (6300ppm), where the second corresponds a sample consisting of 7% LEL propane (1540ppm) and 20% LEL butane (3600ppm). The fitting correlation coefficients using K1Ip+K2Ib+I0 and Im of a total of 20 sample mixtures are shown in Figure 6, from which it can be seen that all the coefficients obtained are greater than 0.96, with more than half of these higher than 0.99.
With the introduction of the three reference gas cells (which individually were filled with pure nitrogen gas, pure propane gas and pure butane gas), the absorption spectra of the propane gas and the butane gas samples could be obtained separately, and in real time, and thus the spectral overlap of the propane/butane gas mixture can also be removed in real time by extracting the absorption spectrum of the propane component and that of the butane component and obtaining the coefficients corresponding to the linear superposition of K1, K2 and I0. The 3 coefficients can then be used to determine the absorption spectrum ‘weights’ of the propane component and that of the butane component in the overall absorption spectrum of the gas mixture. The spectral overlap removal has thus provided the prerequisite for the next stage quantitative analysis of the propane and butane components in the mixture.
B. Quantitative Analysis With PLS
[image:7.612.321.551.51.245.2]Theoretically, the concentrations of the propane and the butane components can be obtained directly after determining the coefficients of the linear superpositions, K1 and K2, according to equations (13) and (14), since C2 and C3 are the known concentrations of the standard gases used. However, it is almost impossible to ensure that the optical structures of the four gas cells are entirely similar and thus the small differences, for example in the loss of laser energy caused only by the gas cells themselves cannot be eliminated completely. This may cause an additional spectral background element in the spectra of the propane/butane gas mixtures recorded. When the spectral overlap removal approach discussed is applied, there is inevitably an influence of one gas upon the other when the analysis is carried out to separate the absorption spectra of propane and butane. Thus large errors could be introduced in determining the final calculated concentrations of the propane and the butane fractions separately, lowering the detection accuracy achieved if the concentrations of the propane and the butane in the mixture are determined only by using equations (13) and (14). In order to improve the accuracy in determining these important unknown individual gas concentrations, the coefficients K1, K2 and I0 for the samples considered were further calibrated with the corresponding concentrations of propane and butane in the 20 samples considered. Usually the
Fig. 6. Fitting correlation coefficients using the relationship K1Ip+K2Ib+I0 and Im
(a) 5% LEL propane and 35% LEL butane
(b) 7% LEL propane and 20% LEL butane
[image:7.612.55.298.247.620.2]multiple linear regression (MLR) method can be utilized for the calibration since there is a linear relationship between the concentrations of propane and butane and the coefficients K1, K2 and I0. However, collinearity may be present in the coefficients K1, K2 and I0, which may bring additional errors during the calibration[30]. In order to avoid this problem, the multiple nonlinear regression-partial least squares method was used for the calibration to offer better detection accuracy. The coefficient matrix for the 20 samples used is given by:
X =
(
x11x12x13
x21x22x23
… xi1xi2xi3
…
x201x202x203)
(19)
where xi1, xi2 and xi3 are separately the coefficients, K1, K2 and I0 of the ith sample. The matrix of the concentration groups is given by:
Y =
(
y11y12
y21y22
… yi1yi2
… y201y202)
(20)
where yi1, yi2 are separately the concentrations of the propane and butane in the ith sample. Matrices, X and Y can be determined through a calculation of both the eigenvalues and the eigenvectors of the covariance matrix of X and Y. In the work carried out, these two eigenvalues (and thus the eigenvectors that relate to that) were seen as forming the loading matrix Px for X (and similarly the loading matrix Py was obtained for Y). Therefore, the corresponding score matrices, Tx and Ty, can be obtained from:
Tx= XPx (21)
Ty= YPy (22)
where Tx and Ty are separately the projections of the coefficients and the concentration groups. By transforming the coefficient matrix and the matrix of the concentration groups to their corresponding score matrices, there is little multi-collinearity in Tx and Ty, and the useful information included in the coefficients matrix and the matrix of the concentration groups is preserved. Thus, the appropriate relationship between Tx and Ty can be then built, based on the MRL method:
Ty= TxBT (23)
where BT is the regression matrix. According to MRL, BT can be given as:
BT= (TxTTx)−1TxTTy (24)
Thus, according to equations (19) - (24), the concentration vector, Cdetect, which involves the concentrations of the propane and the butane components in the sample mixture to be detected can be given by:
Cdetect= TxdetectBTPy−1= Txdetect(TxTTx)−1TxTTyPy−1 (25)
where Txdetect is then given as the ‘score vector’ of the coefficient vector of the sample of gases that is under investigation.
IV. EXPERIMENTAL VERIFICATION OF THE APPROACH
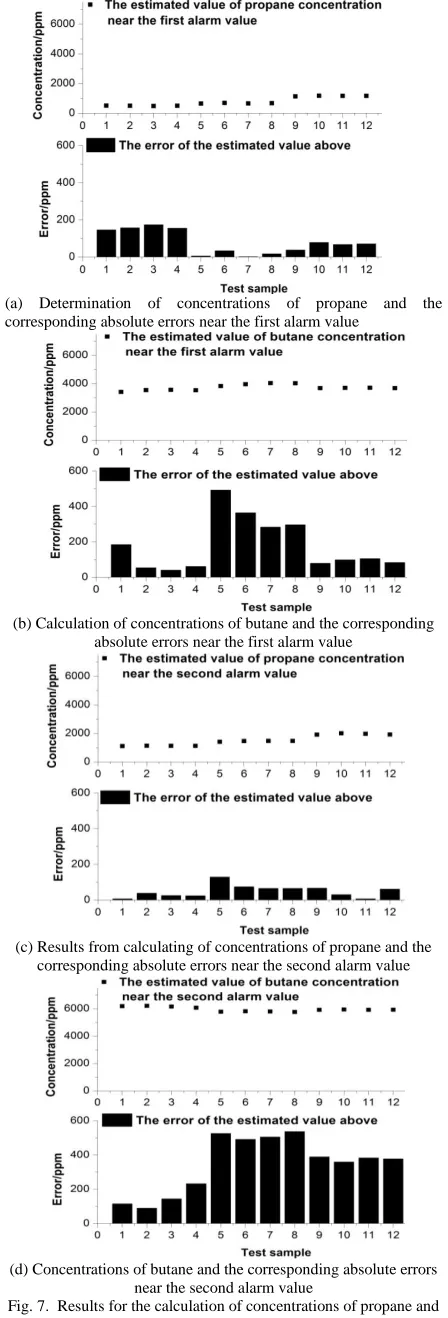
In order to determine the accuracy achievable when measuring the concentrations of the propane and butane components in the gas mixture, a simulation using typical measurement conditions was undertaken. In this test, four gas cells were used, comprising three reference gas cells and the gas cell which acted as the probe. The four gas cells were placed in a low-lying pit outside the laboratory where the simulated gas mixtures were released. The gas cells were connected to the laser source and the photoelectric detection system, by means of optical fibers. In the tests carried out, different simulated leakage gas mixture samples (consisting of different, known concentrations of propane, butane and nitrogen) were successively transmitted to the pit (through the gas piping from the gas supply system) and each gas mixture used was sampled and the spectral signature detected on four different occasions. The LEL of butane itself, 1.8%, is considered as the LEL of the gas mixture since the LEL of butane is lower than that of propane and butane is the major component of the mixture used. The first concentration value that corresponds to an ‘explosion alarm’ situation was set at ~25% LEL and the second at 40% to 50% LEL[32][33]. In the tests carried out, the combinations of the concentrations (of propane and butane respectively) in the samples used were as follows: (660ppm, 3600ppm), (660ppm, 4320ppm), (1100ppm, 3600ppm), (1100ppm, 6300ppm), (1540ppm, 6300ppm) and (1980ppm, 6300ppm). For the first three samples, the sums of the concentrations of propane and butane are 4260ppm, 4980ppm and 4700ppm, (which are between 23% and 28% of the LEL, which is near the first alarm value). For the other three samples, the sums of the concentrations of propane and butane are 7400ppm, 7840ppm and 8280ppm, which are between 41% and 46% of the LEL, near the second alarm value set. Near the first alarm value, the first three samples were successively transmitted to the pit and each sample was evaluated 3 times. Near the second alarm value, the other three samples were used, and the process was similar to that used for the experiment near the first alarm value. Based on the PLS model constructed and mentioned above, the concentrations of propane and butane in the simulated leakage gas mixture samples could be calculated, according to the spectral data acquired from the four gas cells. Then the measurement errors were obtained by comparing the calculated concentration values with the real values which were known.
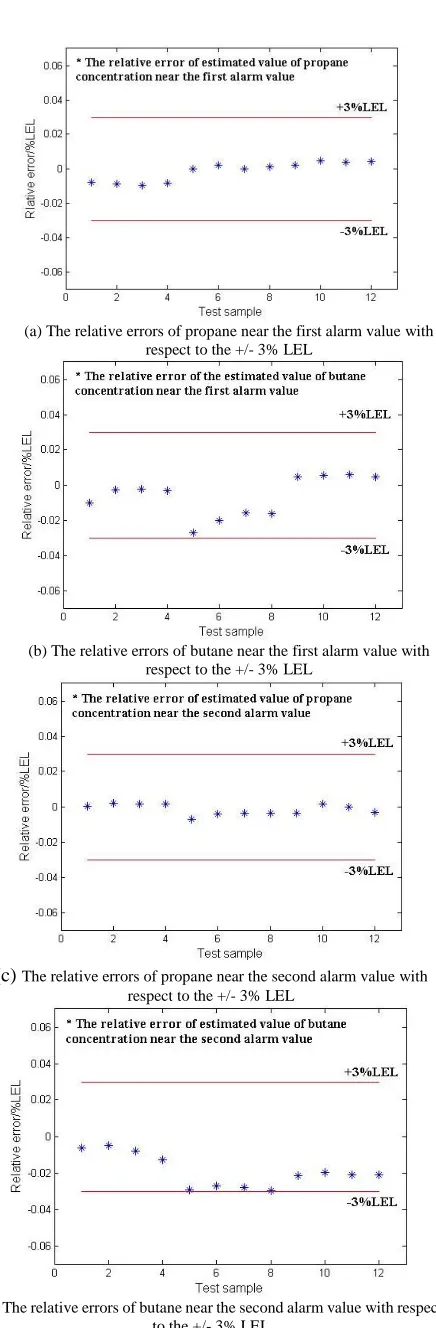
all restricted to below 3% LEL, which can be seen from Figure 8. In field measurements, this level of accuracy is difficult to achieve by using other methods based on TDLAS, such as the traditional PLS modeling approach, which is problematic to use in the field. The data further show that most of the results obtained in calculating the concentrations of propane and butane fractions in the gas mixture samples used in the pit are sufficiently accurate, with the relative errors below 1% LEL. Further, only a few larger random errors can be seen (with the relative errors close to 3% LEL), but all are below this limit. This is an encouraging result, as it meets the requirements from industry discussed previously for the better and accurate monitoring of combustible gases, (such as the propane/butane
gas mixtures [32][33] in the oil industry targeted here). (a) Determination of concentrations of propane and the corresponding absolute errors near the first alarm value
(b)Calculation of concentrations of butane and the corresponding absolute errors near the first alarm value
(c) Results from calculating of concentrations of propane and the corresponding absolute errors near the second alarm value
[image:9.612.336.560.55.714.2](d) Concentrations of butane and the corresponding absolute errors near the second alarm value
Fig. 7. Results for the calculation of concentrations of propane and butane and the corresponding absolute errors near the first alarm
V. CONCLUSIONANDDISCUSSION
The inherent features of the absorption spectra of propane and butane and their overlap over several wavelength bands bring major difficulties for the accurate, in-the-field monitoring of these important combustible gases familiar from the oil-gas industries, particularly monitoring propane and butane gas mixtures. The TDLAS method has been identified as an excellent approach for a better monitoring solution for industry where volatile petroleum samples are to be monitored, including samples in transit. In this work, a VCSEL laser source was utilized to scan over the spectral region from 1678.7 nm to 1686.1nm, within which spectral region there are obvious absorption features for both propane and butane gases. In this work, three reference gas cells were utilized to obtain the absorption spectra of standard propane gas, standard butane gas and several propane/butane gas mixtures allowing, in the analysis, the noise caused by the laser energy loss along the laser transmitting path and the slight differences in the performance of the gas cells used to be eliminated or compensated. By fitting a linear superposition of the known absorption spectra of propane and butane with the absorption spectrum of gas mixture detected, the measurement problem that comes from the spectral overlap can be effectively removed – with fitting coefficients higher than 0.96 (and more than half of them higher than 0.99) actually observed. The PLS method was utilized to calibrate the relationship between the absorption spectra ‘weights’ and the concentrations of propane and butane in the mixture, to allow the calculation of the actual individual concentrations of propane and butane, when used in a realistic simulation of in-the-field monitoring conditions. The field tests carried out using known gas mixtures shows that near the first alarm value and the second alarm value set, a high measurement accuracy can be obtained with the relative errors in the results of the determination of the concentrations of propane and butane in the gas mixture sample. For tests carried out with mixtures below 3% LEL (here the ‘LEL’ is the LEL of butane, 1.8%, which is considered as the LEL of the mixture since the LEL of butane is lower than that for propane – and butane is the major part of the mixture as mentioned above), the positive results obtained are important as they meet the requirements from the industries the authors work with for the better, intrinsically-safe monitoring of combustible propane/butane gas mixtures[32][33].
While the results have shown the potential of the method, before the TDLAS-based technology can be exploited further for the monitoring of dangerous gases used in the industries mentioned above, further work needs to be done to ensure that different types of interference (such as noise caused by pressure and temperature changes and vibrations that inevitably occur) can be fully eliminated and such work is on-going. However, this research has shown a possible solution for the detection of gas mixtures with similar absorption spectral features and severe spectral overlap. This work has provided an excellent ‘proof of principle’ evaluation of the approach to underpin the design of a TDLAS-based field sensor system to monitor combustible gas mixtures, with complex components, and the hazards caused by the propane/butane gas mixtures which are so widely used by industry today.
(a) The relative errors of propane near the first alarm value with respect to the +/- 3% LEL
(b) The relative errors of butane near the first alarm value with respect to the +/- 3% LEL
(c) The relative errors of propane near the second alarm value with respect to the +/- 3% LEL
[image:10.612.64.282.41.705.2](d) The relative errors of butane near the second alarm value with respect to the +/- 3% LEL
REFERENCES
[1] R.A. Meyers, “Handbook of Petrochemicals Production Processes,” New York, NY, USA: McGraw-Hill, 2005. [2] S. M. Thompson, G. Robertson, “Liquefied petroleum gas,”
Ullmann’s Encyclopedia of Industrial Chemistry, New York, NY, USA: Wiley, 2005.
[3] P. Bryce, P. Jax, J. Fang, “Leak-detection system designed to catch slow leaks in offshore Alaska line,” Oil & Gas Journal, 100, 53–59, 2002.
[4] D. Canziani, P.M. Ndiaye, Elton Franceschi, Marcos L. Corazza, J. Wladimir Oliveira, “Phase behavior of heavy petroleum fractions in pure propane and n-butane and with methanol as co-solvent,” J. Chem. Thermodynamics, 41, 966-972, 2009.
[5] W. Chew, P. Sharratt, Anal. “Trends in process analytical technology,” Analytical Methods, 2, 1412–1438, 2010. [6] R. M. Rodríguez-Méndez, H. H. Cerecedo-Nuñez, J.
García-Guzmán, P. Padilla-Sosa, M. A. Basurto-Pensado, “Spectral switch for butane/propane gas mixture detection,” Advanced Photonics Congress, 2016.
[7] A. Demirbas, “Fuel properties of hydrogen, liquefied petroleum gas (LPG), and compressed natural gas (CNG) for transportation,” Energy Sources, 24, 601–610, 2002. [8] H. Feng, “The progress of the technology of geophysical
survey to preventing gas accident occurring in the colliery in China,” Progress in Geophysics, 20, 1171–1175, 2005. [9] Jin Liang’ an, Bai Xuelian, Xu Yuming, “The
countermeasure study on the harm from the oil-gas going into air,” Techniques and Equipment for Environmental Pollution Control, 2, 59-61, 2001.
[10] Anindya Nag, Asif Iqbal Zia, Xie Li, Subhas Chandra Mukhopadhyay, Jürgen Kosel, “Novel Sensing Approach for LPG Leakage Dtection: Part I-Operating Mechanism and Preliminary Results,” IEEE SENSORS JOURNAL, 16, 996-1003, 2016.
[11] Noboru Yamazoe, “Toward innovations of gas sensor technology,” Sensors and Actuators B, 108, 2-14, 2005. [12] U. Guth, J. Zosel, “Electrochemical Solid Electrolyte Gas
Sensors-Hydrocarbon and NOx Analysis in Exhaust Gases, Ionics, 10, 366-377, 2004.
[13] T. Wenhu, Y. Qiuxiang, R. Xiaofan, H. Xintang, “Design of SnO2-based highly sensitive ethanol gas sensor based on quasi molecular-cluster imprinting mechanism,” Sensors and Actuators B: Chemical, 212, 47-54, 2015.
[14] N. Van Toan et al., “Fabrication of highly sensitive and selective H2 gas sensor based on SnO2 thin film sensitized with microsized Pd islands,” Journal of Hazardous Materials, 301, 433-442, 2016.
[15] Jeremy J. Harrison, Peter F. Bernath, “Infrared absorption cross section for propane (C3H8) in the 3μm region,” Journal of Quantitative Spectroscopy & Radiative Transfer, 111, 1282-1288, 2010.
[16] S. V. Kireev, E. M. Podolyako, I. G. Symanovsky, S. L. Shnyrev, “Optical Absorption Method for the Real-Time Component Analysis of Natural Gas: Part 1. Analysis of Mixtures Enriched with Ethane and Propane,” Laser Physics, 21, 250-257, 2011.
[17] Robert Heinrich, Alexandru Popescu, Andreas Hangauer, Rainer Strzoda, Sven Höfling, “High performance direct absorption spectroscopy of pure and binary mixture hydrocarbon gases in the 6-11 μm range,” Applied Physics B, 123:223, 2017. [Online]. Available:
https://link.springer.com/article/10.1007/s00340-017-6796-6.
[18] Gao Shanhu, Liu Wenqing, Liu Jianguo, Zhang Yujun, Kan Ruifeng, Wang Min, Tu Xinghua, Wang Tiedong, “Methane detection research with tunable diode laser absorption spectroscopy,” Chinese Journal of Quantum Electronics, 23, 388-392, 2006.
[19] Pan Weidong, Zhang Jiawei, Dai Jingmin, Song Kai, “Tunable Diode Laser Absorption Spectroscopy System for Trace Ethylene Detection,” Spectroscopy and Spectral Analysis, 32, 2875-2878, 2012.
[20] P. Kluczynski, S. Lundqvist, S. Belahsene, Y. Rouillard, L. Nähle, M. Fischer, J. Koeth, “Detection of
propane using tunable diode laser spectroscopy at 3.37 μm,” Applied Physics B, 108, 183-188, 2012.
[21] J. M. Rey, M. Fill, F. Felder, M. W. Sigrist, “Broadly tunable mid-infrared VECSEL for multiple components hydrocarbon gas sensing,” Applied Physics B, 117, 935-939, 2014. [22] Jiang Meng, Wang Xuefeng, Wang Junlong,
Wang Yizhao, Li Pan, Feng Qiaoling, “Research on propane leak detection system and device
based on mid infrared laser,” Applied Optics and Photonics China, 2017. [Online]. Available as:
https://www.spiedigitallibrary.org/conference-proceedings-of-spie
[23] K. Chan, H. Ito, H. Inaba, “All-Optical Remote Monitoring of Propane Gas Using a 5-km-long, Low-Loss Optical Fiber Link and an InGaP Light-Emitting Diode in the 1.68-μm Region,” Appl. Phys. Lett., 45, 220-222, 1984.
[24] Jihyung Yoo, Nicholas Traina, Michael Halloran, Tonghun Lee, “Minute Concentration Measurements of Simple Hydrocarbon Species Using Supercontimuum Laser Absorption Spectroscopy,” Applied Spectroscopy, 70, 1063-1071, 2016.
[25] Svante Wold, Michael Sjostrom, Lennart Eriksson, “PLS-regression: a basic tool of chemometrics,” Chemometrics and Intelligent Laboratory Systems, 58, 109-130, 2001.
[26] Bart M. Nicolai, Katrien Beullens et. al., “Nondestructive measurement of fruit and vegetable quality by means of NIR spectroscopy: A review,” Postharvest Biology and Technology, 46, 99-118, 2007.
[27] Esra Al Hosani, Mahmoud Meribout, et al., “A New Optical-Based Device for Online Black Powder Detection in Gas Pipelines,” IEEE TRANSACTIONS ON INSTRUMENTATION AND MEASUREMENT, 63(9), 2238-2252, 2014.
[28] YANG-Ya-han, LI Gou-lin et al., “Partial Least Squares Algorithm Application in TDLAS Based Trace H2S
Analyses in Natural Gas,” ACTA PHOTONICA SINICA, 46(2), 0230002-1-0230002-8, 2017.
[29] DU Zhen-hui, Qi Ru-bin et al. “Quantitative Detection of Propane and Isobutene Based on NIR Spectroscopy,” Journal of Tianjin University, 41, 589-592, 2008.
[30] Chu Xiaoli, “Molecular Spectroscopy Analytical Technology Combined with Chemometrics and its Aplications,” Beijing, China: Chemical Industry Press, 2011. [31] J. Barry McManus, Mark S. Zahniser, and David D. Nelson, “Dual quantum cascade laser trace gas instrument with astigmatic Herriott cell at high pass number,” APPLIED OPTICS, 50(4), A74-A85, 2011.
[32] Su Feng, Wang Jie, Yang An, “The Layout, Lectotype, Installation and Maintenance of the Combustible Gas Detector Used in the Offshore Platform,” SHIPBUILDING OF CHINA, 48, 43-47, 2007.
[33] GB 15322.1-2003, “Combustible gas detectors-Part 1: Point type detectors for 0-100% LEL combustible gas,” Beijing, China: Standards Press of China, 2003.
Yin Wang received the B.S. degree in physics from Qufu Normal University, China, in 2010 and Ph.D. degree in optics from University of Chinese Academy of Sciences, China, in 2015.
more than 25 journal and conference papers and more than 10 patents.
Yubin Wei received the B.S. degree, M.S. degree in automation from Liaoning Shihua University, China, in 2002, 2005, and the Ph.D. degree in optical engineering from Shandong University in 2016, respectively.
He joined Laser Institute of Shandong Academy of Sciences in 2005, undertaking research in novel optical fiber sensor development for coal mine, petrochemical and power industries. He has authored and co-authored more than 30 journal and conference papers and more than 10 patents.
Tongyu Liu received the B.Eng. degree in radio electronics from Shandong University, Jinan, China, in 1983, and the Ph.D. degree in materials science from Brunel University London, U.K., in 1999. After 14 years of study and work in U.K., he joined Laser Institute of Shandong Academy of Sciences in 2004, undertaking research in novel optical fiber sensor development for physical and gas sensing. His recent research interests have been focused on fiber optic sensors for safety monitoring in coal mine, petrochemical, and power industries. He has authored and co-authored more than 150 journal and conference papers and more than 20 patents.
Tong Sun received the B.Eng., M.Eng., and D.Eng. degrees in mechanical engineering from the Department of Precision Instrumentation, Harbin Institute of Technology, Harbin, China in 1990, 1993, and 1996 respectively, and the D.Phil. degree in applied physics from City University, London, U.K., in 1999. She joined City University as an Academic Visitor and , latterly, as a Research Fellow to work in the field of fiber-optic temperature measurement using luminescent techniques. She was an Assistant Professor is at Nanyang Technological University, Singapore, from 2000 to 2001, and she is currently a Senior Lecturer at City University, which rejoined again in 2001. She has authored or coauthored more than 80 scientific and technical papers. Her research interests are in optical fiber sensors, optical communications, and laser engineering.
Kenneth T.V. Grattan received the B.S degree in physics and the Ph.D. degree from Queen’s University, Belfast, U.K., in 1974 and 1978, respectively.
He became a Postdoctoral Research Assistant at Imperial College, London, U.K. His research during that period was on laser systems for photophysical systems investigations, and he and his colleagues constructed some of the first of the then new category of excimer lasers (XeF, KrF) in Europe in 1976. His work in the field continued with research using ultraviolet and vacuum ultraviolet lasers for photolytic laser fusion driver systems and studies on the photophysics of atomic and