TRACE ELEMENTS PROFILE IN
VIPER ENVENOMATION
Dissertation submitted for
MD Degree (Branch I) General Medicine
September 2006
CERTIFICATE
This is to certify that this dissertation titled “TRACE ELEMENTS PROFILE IN VIPER ENVENOMATION” submitted by Dr. P. RAVIKUMAR to the faculty of
General Medicine, The Tamilnadu Dr. M.G.R. Medical University, Chennai in partial fulfillment of the requirement for the award of MD degree Branch I (General Medicine) is a bonafide research work carried out by him under our direct supervision and guidance.
Place : Madurai Dr.P.Thirumalaikolundu Subramanian M.D.,
Date: Professor and Head,
DECLARATION
I, Dr. P.RAVIKUMAR, solemnly declare that the dissertation titled “TRACE ELEMENTS PROFILE IN VIPER ENVENOMATION” has been prepared by me.
This is submitted to the Tamil Nadu Dr. M.G.R. Medical University, Chennai, in
partial fulfillment of the regulations for the award of MD Degree Branch I (General
Medicine).
It was not submitted to the award of any degree/ diploma to any University either
in part or in full form previously.
Place : Madurai
Date : Dr. P.RAVIKUMAR
ACKNOWLEDGEMENT
At the outset, I wish to thank our Dean Dr.R.Saraswathi M.S., for permitting me
to use the facilities of Madurai Medical College and Govt. Rajaji Hospital to conduct this
study.
My beloved unit chief and Head of the department of Medicine,
Prof.Dr.P.Thirumalaikolundu Subramanian M.D., has always guided me, by example
and valuable words of advice and has always given me his moral support and
encouragement through the conduct of the study and also during my postgraduate course.
I owe my sincere thanks to him.
Knowledge and kindness abounds my beloved teachers, Dr.Nalini Ganesh M.D., Dr.A.Ayyappan M.D., Dr.P.Selvaraj M.D., Dr.M.Kamaraj M.D., Dr.A.Radhakrishnan M.D., and Dr.C.Ashok Kumar M.D. I owe them a lot and
sincerely thank them.
I offer my heartfelt thanks to my Assistant Professors Dr.David Pradeep Kumar M.D., Dr.C.Dharmaraj M.D., Dr.K.Senthil M.D., Dr.D.D.Venkataraman M.D., and Dr.M.Ranisolai M.D., for their constant encouragement, timely help and critical
suggestions throughout the study and also for making my stay in the unit both
I thank the Department of Biochemistry, Lady Doak College for estimating serum
trace element levels.
My family and friends have stood by me during my times of need. Their help and
support have been invaluable to this study.
My patients, who form the most integral part of the work, were always kind and
cooperative. I cannot but pray for their speedy recovery and place this study as a tribute
to them and to the numerous others likely affected.
ABBREVIATIONS AND ACRONYMS
AMPase – Adenosine monophosphatase LT – Leucotriene
APC – Antigen presenting cell MBP – Mannose binding protein APP – Acute phase protein MCAF – Monocyte chemoattractant
factor
APR – Acute phase reaction NADase – Nicotinamide adenine dinucleotidase
ASV – Anti snake venom NGF – Nerve growth factor ATPase – Adenosine triphosphatase PAF – Platelet activating factor cAMP – Cyclic AMP PGE2 - Prostaglandlin E2 CPK – Creatine phosphokinase PLA2 – Phospholipase A2 CRP – C-Reactive protein RA – Rhematoid arthritis DHL– apo A1- High density lipoprotein-
apolipoprotein A1
TfR – Transferrin receptor
DIC – Disseminated Intravascular Coagulation
TGF β – Transforming growth factor β
DNase – Deoxy ribonuclease TNF – Tumor necrosis factor ECM – Extracellular matrix TTR – Transthyretin
HR – Hemorrhagins VCAM- Vascular cell adhesion molecule ICAM – Intercellular adhesion molecule VLA – Very late antigen
IL – Interleukin
IL-1–RacP – IL-1 receptor accessory protein
CONTENTS
Page
No.
1. TITLE PAGE i
2. CERTIFICATE ii
3. DECLARATION iii
4. ACKNOWLEDGEMENT iv
5. ABBREVIATIONS AND ACRONYMS vi
6. INTRODUCTION 1
7. REVIEW OF LITERATURE 2
8. AIM AND OBJECTIVE 27
9. MATERIALS AND METHODS 28
10. RESULTS 35
11. DISCUSSION 45
12. CONCLUSION 51
13. SUMMARY 52
BIBLIOGRAPHY
APPENDIX I - APPROVAL FROM ETHICAL COMMITTEE
APPENDIX II – PRO FORMA
INTRODUCTION
Snake envenomation is one of the important environmental and occupational problems
in India and other developing countries where there are lots of lands for agricultural
work. The incidence is 2, 00,000 per year in India of which 15,000 die due to the
complications of envenomation (Swaroop and Garb, 1954). It is also a social problem,
where cases are mismanaged in the hands of the native traditional medical practitioners
with lots of false beliefs regarding snake bite. This also accounts for the time lag for the
patients to reach the hospital for definitive management.
The expenses that are put forth for the treatment of snake envenomation and its
complications are enormous. It consumes a major chunk of budget allotted for health by
the government. Apart from a general statistics of snake bite and envenomation, this
study also analyses the changes in trace elements especially zinc, magnesium and iron
during envenomation, an acute inflammatory state.
Snake envenomation alters the internal biochemical milieu of the body which is due to
inflammatory response induced by the combined effect of the toxins present in the venom
predominantly, and to a lesser extant due to infection produced by bacterial flora in the
mouth of the snake. This proceeds as a vicious cycle. These alterations may be influenced
by the genetic susceptibility, chemical constituents, quantity and metabolic degradation
of the venom, and the surface area of the patient. There is a possibility for these
alterations to produce changes in the trace element levels in the serum. Hence the
hypothesis considered for the present study is “Trace elements level is not affected by
inflammatory response”. However, the proposed study will also help to confirm or refute
REVIEW OF LITERATURE
Snake envenomation
Ophitoxemia is the term that characterizes the clinical spectrum of snake
envenomation. Of the 2500-3000 species of snakes distributed worldwide, about 500 are
venomous. Based on their morphological characteristics including arrangement of scales,
dentition, osteology, myology, sensory organs, etc., snakes are categorized into families.
The families of venomous snakes are Atractaspididae, Elapidae, Viperidae and
Hydrophidae (Warrell, 1996). The major families in India are:
Elapidae - cobra and krait.
Viperidae-Russell’s viper, pit viper, saw scaled viper.
Hydrophidae-sea snakes(less common).
Of the 52 poisonous species in India (Kochva, 1978), majority of the bites are attributed
to 5 species:
King cobra - Ophiophagus hannah.
Common cobra - Najanaja.
Russell’s viper - Daboia russellii.
Saw scaled viper - Echis carinatae.
Common krait - Bungarus caeruleus.
Identification of snakes:
Kochva (1978) studied the anatomy of snakes including their oral glands and fangs
(venom apparatus) which are mainly used for the identification of them.
1) Elapidae:
2) Viperidae:
They have a triangular head with tiny head shields. The front fangs are big,
hinged (reverse fangs), erectile, canaliculated and covered by sheath. They are curved
and have a wide range of motion.
The pupils are vertical. The dorsum has different colors. The ventral surface is
white with black spots at the two ends of scales.
In pit viper, a pit is seen beyond the nasal shield.
3) Sea snakes:
They have a sky blue color dorsally and white color ventrally. The body is
compressed posteriorly. The tail being flat is shaped like a paddle and the body is round.
Venom:
The approximate amount of venom inoculated per bite and the lethal dose is as
follows:
Type of snake quantity per bite lethal dose
Cobra 200mg 120mg
Krait 20mg 60mg
R.viper 150mg 150mg
S.viper 5mg 80mg
The maximum output of venom is in summer and monsoon which leads to
increased mortality. In winter, venom is viscous and small in quantity. They secrete about
10% of the available venom per bite, except R.viper, which exhausts about ¾ of the
venom in the gland with the first strike. There is no support for the belief that snakes are
1 ml of Haffkins institute ASV neutralizes about 0.6 mg of venom of all the four
snakes.
Chemical characters and composition:
The venom is acidic with a specific gravity of 1030-1070. It is crystalline in
nature (needle shaped crystals), and is soluble in water. It consists of enzymatic and non
enzymatic proteins. It is not toxic when taken orally as it is degraded by enzymes of GIT.
Most venom get bound to kidney and excreted through them. A few get excreted through
bile. Mostly they do not cross the blood brain barrier (Parrish, 1980).
Enzyme proteins:
They have a facilitator effect in the spread of venom.
1) Hydrolytic- hydrolase, lecithinase, hyaluronidase, exopeptidases, DNase,
phosphatases, exonucleases, pyrophosphatase(ATPase, NADase) and
5’nucleotidase(AMP ase)
2) Non hydrolytic-L-amino acid oxidase. Enzymes specific to viper:
These include arginine ester hydrolase, kininogenase, factor X and prothrombin
activating enzyme.
Enzymes specific to Elapid:
They are acetyl choline esterase, alkaline/acid phosphomonoesterase, phospho
Non enzyme proteins:
They have the lethal effect.
Those of Viper include nerve growth factor (NGF) and hemorrhagins, and of
Elapids are nerve growth factor, polypeptide neuro and cardio toxins.
a) Hemorrhagins - There are two types of hemorrhagins as HR1 and HR2. They
are acidic, non proteolytic and, heat and pH stable.
b) NGF - It stimulates and control growth of sensory and sympathetic nerve cells.
c) Neurotoxins - They include: i) cobra toxin (cobra),
ii) α,β,γ bungarotoxins (krait) and iii) erabutoxin (sea snakes).
There are no free –SH groups and they are always bridged which is important for
their toxic properties.
EPIDEMIOLOGY: Incidence:
Snake bite is a common medical emergency and is an occupational hazard in
India. Around 15,000 people die out of nearly 2, 00,000 bites every year. Myint-Lwinet
et al., (1985), who worked in Burma, found that 3.3 deaths/lak populations has occurred
in the Burmian farmer groups which is as high as 5th most common cause of all deaths.
But the exact incidence cannot be estimated in developing countries due to improper
reporting system. The precise estimate of incidence is possible in industrialized countries
Patient factors: Age:
The spectrum of age group commonly involved is 11-50 years with fewer
incidences in young children and elderly. This may be due to reduced outdoor activity in
this age group where there is increased possibility of snake bite (Sawai, Homa, 1974).
Sex:
Males sustain more bites in the ratio of 3:1, as their outdoor activity is more when
compared to females (Sawai, Homa, 1974).
Part of the body involved:
Lower extremity is involved much, about 70%, of which foot is involved in 40%.
Next comes to upper extremities about 25% with fingers involved in 13%.
Environmental factors: Season:
The amount of venom is less during winter months as it is highly viscous. So the
morbidity and mortality is less during winter. Also the incidence is less during winter as
there is less of agricultural work. The incidence is more during warmer months and also
during monsoon due to increased egress of snakes from their dwelling. It is also increased
during ploughing and harvesting times.
Time of bite:
Usually snake bite occurs during hours of working from morning 6 am to late
Place of bite:
It has been observed that snakes do not ingress human dwelling except for kraits
which will enter homes and bite. Rural population is the most affected when compared to
semi urban and urban dwellings. The main place of snake bite is the agricultural fields,
followed by bushy areas and forests when people are indulged in clearing the bushes.
Clinical features
About 25% to 30% of poisonous snake bites do not result in envenomation because
of
1. failure of venom gland –fang mechanism,
2. insufficiency of venom and
3. indirect injury with the fangs which results in minor scratches.
Local features:
The earliest symptom is pain, followed by bleeding from fang marks. Swelling
follows that, extending proximally going for regional lymphangitis and adenitis.
Pain:
It is more severe with viper bite. Cobra bite causes burning sensation.
Swelling and bruising:
It occurs due to increased permeability of vessels caused by phospholipids,
proteases, membrane damaging polypeptides, toxins, endogenous autocoids eg.
histamine, 5-hydroxy tryptamine, kinins. It is less with cobra and krait. Skip lesions are
common with cobra. Viper bites causes more cellulitis with ecchymosis with blood
stained discharge through the fang marks. Absence of swelling even after 2 hours shows
Tissue necrosis:
It is due to myotoxic and lipolytic factors, ischaemia from thrombosis,
compartment syndrome or tourniquet application (Moura- da- silva et al, 1996).
Lymphadenitis:
It is a sign of impending systemic envenomation.
General Systemic features:
Vomiting, diarrhea, colic, angioedema, wheeze, syncope can occur. Psychological
symptoms due to fright may resemble neurotoxicity where patients can have flushing,
dizziness, breathlessness, constricting chest pain, palpitations, sweating, acroparaesthesia.
A clue to these symptoms to be psychological is that it appears too soon and proceeds
more rapidly than the minimum time taken for neurotoxicity to occur.
Neurotoxicity: Symptoms:
They include vomiting, heaviness of lids, blurred vision, paraesthesia around
mouth, hyperacusis, headache, dizziness, vertigo, hypersalivation, congested conjunctiva
and goose flesh.
Signs:
Ptosis is the earliest sign followed by external ophthalmoplegia. There is also
palatal and pharyngeal paralysis, dysphonia, and flaccid limb paralysis. Respiratory
paralysis results in drowsiness, convulsions, and coma. These effects wear off
Tensilon test performed differentiates presynaptic and postsynaptic toxicity. It is
done by administering 0.6 mg of atropine on glycopyrollate i.v, followed by 10mg
edrophonium i.v. post synaptic toxicity will improve but not the presynaptic.
With sea snakes there will be myotoxicity which presents as thick swelling of
tongue, stiffness, aches and tenderness of muscles, trismus which will proceed to
generalized flaccid paralysis. Myoglobinuria, hyperkalaemia occurs in 3-8 hours as a
result of rhabdomyolysis which can result in acute renal failure (Philips, 1988).
Cardiotoxicity:
It presents with hypotension, arrythmias and cardiac arrest.
Haemotoxicity :
Hemorrhagic bleb with uncontrolled bleed from the bite site is the earliest sign
and is diagnostic of hemotoxicity of viper. Purpura, hematoma or generalized ecchymosis
can occur. Painful large ecchymosis, purpura gangrenosa of lips, tips of nose, finger and
toes can occur. Conjunctival and facial edema can occur.
Mucosal bleed in the form of hematuria, hemoptysis, gingival bleed, hematemesis
and malena can occur. One should look for bleed in each gingical sulcus.
Cerebral hemorrhage, Sheehan’s syndrome (Warrel, 1996) are also part of the
reported hemotoxic manifestations.
Hypotension due to hypovolemia secondary to internal bleed, vasodilation, local
inflammation and myocardial dysfunction can occur. Hemolysis is not common with
Hypoalbuminemia, albuminuria, serous effusions and pulmonary edema can
occur. Pulmonary and coronary thromboembolism can cause early collapse. Renal
ischemia can cause loin pain and oliguria (Ratcliffe, 1989).
The time taken for features of envenomation to become evident and the mean
time of death following envenomation is as follows:
In hospital management:
All patients require admission and observation for at least 24 hours. All the vital
parameters are checked initially and then as frequently as required based on which
progression of disease is assessed and the appropriate treatment is planned (Malasit,
1986).
Available data and observations clearly show variations in symptoms, signs,
clinical course, complications and recovery. Reasons for all such variations may be
attributed to molecular basis of systemic inflammatory response syndrome related to the
release of cytokines following severe envenomation. In the ensuing paragraphs these
details are provided.
Onset Death (without treatment)
Neurotoxic 6½ hrs (20min - 15hrs) Cobra – 8hrs; krait - 18hrs
Hemotoxic 15½ hrs (2 - 24hrs) R.viper - 3days
S.viper - 5days
CYTOKINES:
The communication between numerous cell types involved in inflammation
occurs through a complex network of molecular mediators-the cytokines that direct all
stages of response from initiation to repair. They act in autocrine, paracrin and endocrine
manner. They include polypeptides, neuropeptides, lipids, vasoactive amines,
nucleotides, metabolites of oxygen and nitrogen.
GENERAL CHARACTERISTICS OF CYTOKINES:
Cytokines are a diverse group of proteins of relatively low-molecular weight
(rarely more than 8-25 k Da) with multiple functions (Blackwill, 1989). They regulate
important biological processes, such as cell growth and differentiation, cell activation,
inflammation, immunity, tissue repair, fibrosis, and morphogenesis. Although cytokines
are considered to be a "family", this is a functional rather than a structural concept; these
proteins are not all chemically related. Cytokines are produced by immune cells and other
cells when challenged with various environmental or inflammatory insults, and these
molecules are the soluble message of cell communications (Hoch et al, 1993). The
functions of cytokines are often redundant, and they can influence the synthesis and
action of other cytokines, creating the "cytokine-network". Cytokines are effective at low
concentrations (at a few pg/ml). This is due to their mode of action, involving binding to
high-affinity receptors on the cell surface, which transmit cytokine signals to the nucleus.
Cytokines often consist of a single chain and most cytokine receptors are made up of a
single chain that binds to the cytokine, but does not contain signal transduction motifs. It
transducing chains are bound to this complex, initiating cell activation. In many cases,
signal transduction chains are shared by numerous cytokines, and families of cytokine
receptors have been characterized based on similarities in their extracellular domains.
Various T helper cell cytokines like IL-1, IL-6 and TNF-α are involved in the mediation of hypersensitivity reactions to venom components (Akira et al, 1990).
CHEMOKINES:
Chemokines are small polypeptides (8-10 kDa) that are synthesized by several
cells, such as phagocytes, endothelial cells, keratinocytes in the skin, fibroblasts, and
smooth muscle cells of connective tissues, as well as T helper cells and platelets (Miller,
1992).
OTHER INFLAMMATORY MEDIATORS:
In addition to cytokines, there are other important mediators that participate in
inflammatory responses and allergic reactions that are relevant to venomous bites. These
mediators are released by macrophages, and other tissue-resident cells, such as mast cells,
neutrophils, eosinophils, basophils, lymphocytes and platelets (Dayer, 1994). This group
includes a variety of molecules such as arachidonic acid metabolites-prostaglandins,
thromboxanes, leukotrienes, particularly leukotriene B4 (LTB4), platelet-activating factor
(PAF), oxygen free radicals, nitric oxide and vasoactive amines. Plasma contains four
mediator-producing systems such as the kinine system, clotting system, fibrinolytic
system and complement system. Following the activation of these systems, endothelial
permeability, vasodilatation, neutrophil chemotaxis and smooth-muscle contraction
(Marshall and Herrmann, 1983). The activation of the complement system, both by
classical and alternative pathways, contributes to the inflammatory mediators C5a (the
most potent), C3a, and to a lesser extent, C4a (Vogt,1990). C5a, apart from being an
inflammatory mediator by its own, also activates mast cells, inducing the release of their
granule contents including histamine, serotonin, and LTB4. However, it should be
emphasized that these mediators cooperate with cytokines in the control of inflammation.
SEQUENTIAL INVOLVEMENT OF CYTOKINES IN ACUTE INFLAMMATORY RESPONSES:
Alarm and secondary cytokines:
The cell most commonly associated with the initiation of tissue inflammatory
responses is the macrophage (Larsen, 1983). Activated macrophages release a broad
spectrum of cytokine and inflammatory mediators; the IL-1 and TNFα being of utmost
importance for the initiation and propagation of the inflammatory process. At the
inflammation site other cellular events, such as mast cell degranulation and platelet
aggregation and activation can also result in the release of mediators, which are
chemotactic for macrophages and monocytes and activate their functions.
IL-1 and TNFα (Gearing et al, 1994) are especially important in initiating the
next series of reactions. As IL-1β is active in its secreted form, its effects on
inflammatory responses are more widespread and prominent than those of IL-1α which is
considered as early or "alarm" cytokines with pleiotropic activities, acting both locally
and distally. However, the most important activity of these cytokines is the induction in
stromal cells (fibroblasts) of a second wave of cytokines. This amplifies the inflammatory
signal and mediates the various phenomena that are seen in the inflammatory process.
The cytokines of this second wave include IL-6, chemokines, IL-1 and TNF (Barraviera
et al, 1971). IL-1 and TNF are also capable of inducing their own production. The
synthesis of a wide array of non-cytokine inflammatory mediators is also induced by IL-1
and TNF in macrophages and other tissue-resident or stromal cells. IL-1, TNF and IL-6
are considered the most important pro-inflammatory cytokines, as they produce a wide
spectrum of biological activities that help coordinate the body responses to infection
(Akira, 1992).
Pro-inflammatory cytokines induce local and systemic inflammatory
manifestations. The local effects include the activation of vascular endothelium, increase
in vascular permeability, and access of leukocytes into the affected tissue and their
activation and local tissue destruction. The systemic manifestations include fever, the
acute-phase response and induction of a systemic shock in severe inflammatory processes
(Miller, 1992).
Vascular effects and cell exudation:
The first cytokine-mediated inflammatory manifestations include the dilatation
and leakage of blood vessels, particularly the post-capillary venules. This results in tissue
edema and, in some cases, red-cell extravasation, manifested by tissue redness. IL-1 and
for white blood cells and platelets (Butcher, 1991). Local release of cytokines leads to an
influx of fluid, cells, and proteins that participate in host defenses at the inflammation
site. Later the small vessels clot, preventing the spread of infection or inflammation in the
blood and the residual fluid drains to regional lymph nodes, where an adaptive immune
response is initiated. In addition, IL-1 and TNF-induced low molecular-weight mediators
released by the inflamed tissue, including reactive oxygen species, nitrous oxide, and
metabolites of arachidonic acid contribute to the vasoconstriction and vasodilatation of
the blood vessels. Local effects of inflammation caused by the release of histamine,
serotonin and platelet-activating factor also contribute to these vascular effects.
Leukocyte exudation and accumulation at the inflammation site involve changes
in the adhesion patterns of leukocytes to endothelial cells, ultimately resulting in a tight
binding of leukocytes to endothelial cells and their migration into the inflamed tissue.
IL-1 and TNF induce the expression of adhesion molecules, such as the intercellular
adhesion molecule-1 (ICAM-1) and the vascular intercellular adhesion molecule-1
(VCAM-1) on endothelial cells which bind with high affinity to their counter receptors
on leukocytes, leukocyte function antigen-1 (LFA-1) and the very late antigen-4
(VLA-4), respectively. The interaction of these adhesion molecules arrests the rolling of
leukocytes and induces a tight binding between leukocytes and endothelial cells, allowing
them to squeeze between the endothelial cells and extravasate into the affected tissue.
IL-1 and TNFalso induce the secretion of chemokines by endothelial cells, which
further recruit leukocytes to the inflamed site and amplify the inflammatory response
molecules, both in the extracellular matrix and on endothelial cell surfaces, exhibiting the
chemokines on a solid substrate along which leukocytes can migrate. Thus, the role of
chemokines in cell recruitment is twofold: to bind to their receptors on leukocytes
converting the initial rolling interaction of the leukocytes with endothelial cells into
stable binding, and to direct leukocyte migration along a gradient of the chemokine that
increases in concentration towards the inflamed site.
Once the leukocytes cross the endothelium and the basement membrane to enter
the tissues, their migration to the site of the injury or infection is directed by the gradient
of matrix-associated chemokines. The ability of some chemokines, such as IL-8 and
MCAF to activate the function of their target cells is also very important. They act on
bone marrow endothelium to release neutrophils into the blood that will subsequently
migrate, at an enhanced rate, to the inflammation sites.
After entering the inflamed tissue, leukocytes are again activated by cytokines,
predominantly IL-1 and TNF, and to a lesser extent, by IL-6. As a result, they start to
secrete a whole array of cytokines and inflammatory products, which subsequently
amplify the response. This also applies to endothelial cells. Thus, due to the cytokine
cascade that is initiated and propagated by IL-1 and TNF, many cell types may be
involved in the inflammatory response.
Fever induction:
IL-1, TNF and IL-6 are endogenous pyrogens, raising the body temperature that is
on the thermoregulatory center in the hypothalamus. The cytokine-induced prostaglandin
E2 (PGE2) is the second messenger of fever induction. The effects of IL-1, TNF and IL-6
on muscle and fat cells also contribute to fever induction by altering energy mobilization
and increasing body temperature. Most pathogens grow better at lower temperatures, and
immune responses, such as the processing of antigen are more intense at higher
temperatures. At later stages, the effects of IL-1, TNF and IL-6 on the activation of T and
B cells, which together with enhanced processing of antigen, increase the adaptive
immune response.
The acute phase response:
The liver is the main target of inflammation and the source of essential
metabolites that the body needs to overcome stress. It also supplies the necessary
components for immediate defense at the site of tissue damage, as well as confining
tissue destruction, eliminating harmful agents, and aiding tissue repair. The liver response
is also characterized by significant changes in the transport of ions and metabolites, the
activities of most metabolic pathways, and the coordinate stimulation of the acute-plasma
proteins (APP s). This involves a shift in the proteins secreted by the liver into the blood
plasma and is the result of the action of IL-1, TNF and mainly IL-6 on hepatocytes. In the
acute-phase response some plasma proteins decrease, while the levels of others markedly
increase. The precise function of the acute-phase response is unknown. The increase in
opsonizing proteins and anti-proteinases is believed to aid natural immunity and protect
against tissue injury, respectively. Direct opsonins enhance the phagocytosis of
phophorylcholine portion of certain bacterial and fungal cell wall lipopolysaccharides.
When CRP binds to bacteria, it opsonizes them, but also activates the classical
complement cascade by binding to C1q. The second APP of interest is mannose-binding
protein (MBP). MBP is a calcium-dependent sugar binding protein or lectin, a member of
collectins family. MBP binds to mannose residues on many bacteria, acting as an
opsonin. Its structure resembles that of C1q of the complement system, and similar to
C1q may activate a proteolytic enzyme complex that cleaves C4 and C2 to initiate
complement activation. CRP and MBP do not bind to mammalian cell membranes, as
phosphorylcholine in membrane phospholipids is in a form that does not react with CRP,
whereas mannose residues on mammalian cells are covered with other sugars and cannot
bind to MBP. CRP and MBP have the functional properties of antibodies such as
enhancing phagocytosis, as they can bind to a broad range of microorganisms, providing
defense mechanisms within a day or two after the initiation of injury or infection before
specific immunity develops.
Protease inhibitors (α1-antitrypsin, α1-antichemotrypsin, α1-antiplasmin, and
plasminogen activator inhibitor-I) neutralize lysosomal hydrolases released from
macrophages and neutrophils and limit tissue damage.
Pro-inflammatory cytokines are the major inducers of APP synthesis, mainly
through the activation of gene transcription in the hepatocytes.
In conclusion, the result of early activation of macrophages, with some
contributions from platelet aggregation and the secretion of alarm cytokines (IL-1 and
RESOLUTION OF INFLAMMATORY REACTIONS:
The net amount of pro-inflammatory cytokines, especially the "alarm cytokines"
(IL-1 and TNF) and the duration of their secretion determine the nature of the
inflammatory response. Low amounts of cytokines usually result in local inflammation,
while high amounts of IL-1 and TNF may result in septic shock and death. The
generation of local low-moderate amounts of IL-1 and TNF for extended periods also
contributes to the pathogenicity of autoimmune processes, as in rheumatoid arthritis and
other organ-specific autoimmune diseases.
Pro-inflammatory cytokines, especially IL-1 and TNF, also participate in tissue
repair and wound healing. These cytokines stimulate cells (phagocytes, fibroblasts,
chondrocytes and other stromal cells) to generate and secrete degradative enzymes such
as metalloproteinases necessary to mediate tissue remodeling for subsequent
phagocytosis by tissue macrophages, also stimulated by IL-1 and TNF. In addition, IL-1
and TNF stimulate fibroblast proliferation and deposition of extracellular matrix
constituents (ECM), contributing to scar formation.
Acute inflammatory responses are usually limited by the decay in the initiation
events, which usually also results in the cessation of synthesis of pro-inflammatory
cytokines. In addition, there are inflammation-mediated mechanisms, which actively
suppress pro-inflammatory cytokine synthesis. IL-1 and IL-6 act on the adrenal-pituitary
axis to generate adrenocorticotropic hormone (Fantuzzi, 1994) that induces the
production of cortisol which inhibits cytokine gene expression. The IL-1 receptor
IL-1 receptors (IL-1R) without inducing agonistic effects. It is produced by several cells
usually in conjunction with IL-1, functioning as a natural inhibitor. It has recently been
shown that IL-1Ra fails to bind to the IL-1 receptor accessory protein (IL-1RAcP), a
signal transducing chain that binds to complexes of IL-1 bound to its receptor, and thus
fails to transmit the activation signal. Soluble cytokine receptors, which limit the amount
of IL-1 and TNF in the various microenvironments in the body, have been characterized.
Soluble receptors may originate from proteolytic cleavage of cell surface receptors or
from alternative splicing of receptor encoding mRNAs.IL-1, one of the two types of
receptors for IL-1, acts as a decoy target binding to IL-1 but not leading to signal
transduction. Disturbances in the ratio between the cytokine and its natural inhibitors
have been characterized in various pathological cases, such as IL-1 and TNF in septic
shock and chronic inflammatory diseases (i.e. RA) (Dinarello, 1996). In these
pathological conditions, excess of the cytokine in comparison to its natural inhibitors is
observed. In addition, anti-inflammatory cytokines, such as IL-4 and IL-10, IL-13 and
TGFβ inhibit the production of pro-inflammatory cytokines. These cytokines are mainly
generated by TH 2 cells, macrophages and other stromal cells.
Changes in levels of acutephase proteins are associated with increased plasma
levels ofsome indicators of micronutrient status, such as ferritin, anddecrease of others,
such as retinol. Alterations in the plasmalevels of acute phase proteins can occur from
hemodilution,sequestration and increased or decreased rates of synthesisand breakdown.
How much these relate to functional deficiency is not known. Assays that are less
perturbed by inflammation, such as the transferrin receptor assay, and adjustment of
are helpful but they do not enable precise assessment of micronutrient status among
individuals who areinfected. Improving assessment of micronutrient status is importantif
micronutrient interventions are to be targeted to those withthe greatest need.
Assessing micronutrient status in human samples is difficult.Assays may be made
for micronutrients in body fluids, such asserum, plasma or breast milk; tissues such as
red blood cellsand their binding or transport proteins; or measurement of
micronutrient-dependent enzymatic activities. Many factors affect micronutrient levels, and plasma
levels of several important micronutrients fluctuate considerably after meals. They
change during the hemodilution at certain stages of pregnancy and are influenced by
exercise.The most marked changes occur during the inflammatory processesof infection
(Beisel et al, 1971).
The effect of inflammation on micronutrient status has beenrecognized for many
decades. The classic publication Interactions of Nutrition and Infection by Scrimshaw,
Taylor and Gordon in1968, reviewed what was known about the effect of inflammation
on vitamin A, thiamin, riboflavin, ascorbic acid, vitamins Dand K, iron, zinc and copper.
Two lines of evidence were exploredin that review. The first concerned the association
betweensevere clinical infections and low plasma levels of micronutrients.Despite the
close interaction between micronutrient malnutrition and inflammation, in which it is
often, rather difficult to knowwhich the prime driver is, the authors identified reports of
sequential measurements in infected individuals that showeda key role for inflammation
as a primary cause of changes inlevels in biological fluids. The second line of evidence
were introduced under controlled conditions and micronutrient levels followed at
different stages of the disease process. Subsequently, the work of Beisel et al (1995)
identified the time course of changes in micronutrient levelsduring detailed experimental
infections.
Althoughthere were striking changes in micronutrient levels during theclinically
apparent illness and during the periods of peak pyrexia,important changes also occurred
during the incubation and convalescentperiods when pyrexia and clinical illness were not
present.This indicated that sub clinical infections also played a keyrole in influencing
micronutrient status (Hurt et al, 1994).
Most of these studies relied on measurements of micronutrients in plasma or
urine. They gave important information on the overallrelationship between inflammation
and micronutrient malnutrition.
The characteristics of the biochemical and immunological responseto infection
are now reasonably well characterized. The term "acute phase response" is used to
describe a short-term metabolicchange evidenced by increased plasma concentrations of
certain proteins—positive acute phase proteins (APP s)—such as C-reactive protein
(CRP), haptoglobin, fibrinogen and α–1 antitrypsin and decreased concentrations of certain proteins—negative APP s—such as albumin, retinol binding protein (RBP),
transthyretin(TTR), and high-density lipoprotein-apolipoprotein A1 (DHL-apoA), which
tend to fall during infection (Fleck, 1989). This is associated with a wide range of
are often supplementedby physiological changes such as altered pulse rate, temperature
and blood pressure.
In recent years the development of reactive oxygen species has been described
during the acute inflammatory phase of many illnessesand experimental studies. This
development leads to oxidativestress in which there is increased use of antioxidants such
as vitamins C and E, selenium and carotenoids, with a reductionin plasma levels. There
seems to be an increased consumptionof antioxidants leading to lower plasma levels but
whether changes in rates of turnover of these antioxidants compensates for theirlower
levels in plasma is not yet clear (Allard et al., 1994).
Iron:
The lability of serum iron during infection is well known. In view of the
ubiquitous requirement for iron by microbes infectinghumans, it is just as well that the
inflammatory response reduces levels of free circulating iron and increases levels of
circulatingof binding proteins. Many studiesshow the marked elevation of ferritin during
the acute and chronicphases of inflammation (Witte, 1991). When ferritin levels are low
(e.g., <10 µg/L), there can be little doubt that iron status is deficient. However when
inflammation is present, ferritinlevels may often be >20 µg/L even in the presence of
marked iron deficiency, as assessed by red blood cell indicesand plasma ferritin levels
when the infection is gone.
More recently the transferrin receptor (TfR) assay has beenused because it was
infection such as malaria on plasma TfR levels; although changes occur during acute
infection in non immune subjects, these areconsiderably less than changes in ferritin.
Zinc:
Zinc status is often assessed by measurements of zinc in plasma,white blood cells
or hair. However many dietary and physiological factors such as exercise, eating,
pregnancy and rapid growthin childhood may all alter plasma zinc levels. Whetherthis
really represents zinc deficiency is arguable, and Golden (1982) has discussed the criteria
for assessing zinc status. Attemptsat measuring metallothionein, an alternative indicator
of zinc deficiency, have not resulted in robust indicators of assessment.Overall, mean
plasma zinc levels in a population can be usedto indicate deficiency. Plasma zinc and
metallothionein are both reduced during acute phase response In addition there are
considerable urinary losses of zinc in systemic infection, particularly those with a
pronounced metabolic stress leading to breakdown of muscle. The reduction of
circulating zinc reduces zinc availability for microbial metabolism during infection
(Isaksen, 2001), providing an advantage similar to that achieved byreducing iron levels.
The recent recognition that calprotectin is released (from damaged neutrophils) during
inflammation provides another mechanism for reducing plasma zinc levels during
inflammation.
The amount by which plasma zinc falls in spontaneous infectionwas examined in
Peruvian children in whom infection was diagnosed according to clinical signs or
elevated CRP (Brown, 1998). A plasma zincdifference of around 0.5 m mol/L was noted
differences in mean ferritin levels (10.0 µg/L in uninfected vs. 3.9 µg/L in infected
children). An indirect method of assessing zincstatus using alkaline phosphatase has been
recognized for years.This changes when zinc supplements are given to children butits
functional importance is difficult to assess because of the changes in plasma alkaline
phosphatase during rapid growth.
Magnesium:
Higher serum magnesium levels are seen in APR patients. It may be attributed to
sub clinical renal ischemia and possibly to increased serum glucose level (da Cunha et al,
1999). The development of reduced levels of ionized magnesium while in intensive care
was associated with higher mortality and more severe organ dysfunction. Sepsis was an
independent risk factor for ionized hypomagnesaemia. Prolonged disease and diuretic
administration may also be contributory. It may be that low levels contribute to critical
illness, or that just the converse is true. The outcomes of supplementing magnesium in
these situations need to be explored (Justin kirk-bayley, 2003). Higher level of
magnesium is known to protect against soft tissue calcification which may be the basis
for apparent protection that dietary magnesium exerts against myocardial infarction
deaths (Sherman bloom, 1989).
How much does inflammation change micronutrient status?
This key question has several components. The first is whether it is possible to
measure micronutrient status in an individualeven without the presence of inflammation.
The studies reviewedhere indicate that for certain micronutrients such as folate,assays
less satisfactory.The second component concerns the proportion by which micronutrient
levels change as a result of the inflammatory process.
There is no linear relationship betweenchange in inflammatory proteins level and
change in micronutrient status.Around 10 years ago Brown et al (1993) concluded that
the effect of concurrent infections may differ by nutrient, nutritional status of the
population and prevalence and severity of theinfection.
According to international criteria there are levels of ferritinand retinol at which
iron deficiency and vitamin A deficiency, respectively, are recognized. There are clear
guidelines for public health nutrition interventions. However, using the available
indicators in populations burdened with a high prevalence ofinfection may lead to an
underestimate of some micronutrientdeficiencies like iron and an overestimate of others
AIM AND OBJECTIVE
To estimate the levels of trace elements viz., zinc, magnesium and iron
in viper envenomation induced acute inflammatory status
and
MATERIALS AND METHODS
Setting: Department of medicine, Rajaji hospital and Madurai medical college, Madurai.
Design of study: analytical study.
Period of study: October 2003 to September 2004.
Ethical committee approval: The present project was approved by the ethical committee.
Criteria for selection of subjects:
Rigid criteria were adopted for inclusion and exclusion of cases and controls for
the present study. The details are furnished below.
Inclusion criteria:
1. Patients who were brought to the hospital with a history of viper bite and
developed features of envenomation.
2. Patients who developed complications of envenomation which did not have a
direct effect on trace element levels in the serum.
Exclusion criteria:
1. Patients with history of snake bite but had not identified the snake.
2. Patients with history of snake bite without features of envenomation.
3. Bites other than viper.
4. Previous envenomation and administration of ASV.
5. Patients having underlying hematological disorders.
6. Patients having previous kidney disease.
7. Patients having any other inflammatory pathology.
8. Patients having evidence of immune and nutritional deficiency.
10. Patients who had received any other (native) treatment for envenomation.
11. Patients who were not willing to participate in the study.
12. Pregnant and lactating women.
13. Patients who were treated for any other infections during the past 15 days.
14. Patients who were unconscious, in shock, developed acute renal failure.
15. Patients who were administered diuretics.
16. Children below 12 years.
Consent:
Informed consent was obtained from all those who participated in the study.
Materials:
Thus a total of 20 cases that satisfied the inclusion and exclusion criteria stated
above were taken up for the study. A total of 20 age and sex matched subjects who did
not have any underlying nutritional, inflammatory, renal or hematological pathology as
per the exclusion criteria, were included as control.
Definitions:
The definitions adopted during the study period with reference to selected entities
are furnished below.
1) Envenomation:
Patient was considered envenomated if he/she had evidence of cellulitis and
regional adenitis and with one or more hematological manifestations of snake bite.
2) Non specific complaints:
Patients who had symptoms due to fear and anxiety like palpitation, headache,
3) Native procedures:
It included any of the following invasive and non-invasive procedures. Invasive
procedures might be biting and applying suction, incising or cauterisation over snake bite
site. Noninvasive procedures included topical application of ice, KMnO4, calcium
hydroxide or green leaves extract or oral administration of green leaves extract.
4) Tourniquet application:
Tourniquet application was taken into account if it was tight enough to occlude
arterial or venous blood flow using nylon rope, which forms a tight constriction band.
6) Fang marks:
Presence of two prominent bite marks was taken into account as the impression of
the fangs. Multiple bite marks that showed the impression of the teeth of the snake were
not considered as fang marks.
7) Compartment syndrome:
This included the presence of neurovascular deficit, in the affected limb due to the
spread of inflammation beyond the subcutaneous plane into the muscular compartment.
8) Complications during hospital stay:
It constituted mainly the infective complications as urinary tract infection,
respiratory tract infection and secondary infection of any skin lesions if present. It also
included complications of invasive procedures undertaken while treating snake
envenomation.
Methods:
Selected sociodemographic, clinical and laboratory data were collected from the
Socio demographic data comprised of:
- age
- sex
- locality
- occupation
- place of bite
- time between bite and admission
- native procedures
- application of tourniquet
Clinical data comprised of:
- cellulitis
- urine output
- mucocutaneous bleed
- systemic examination
Laboratory data included:
- Clotting Time
- Urine - albumin, deposits, RBC s, casts.
- Sugar
- Urea
- Creatinine
- Electrolytes
- ECG
- Serum zinc
- Serum magnesium
- Serum iron
Clotting time was measured using a clean and dry ampoule. 1 ml of blood was
taken by vene puncture immediately after admission and poured into the ampoule. The
ampoule was slightly tilted at the end of 20 minutes. If the blood had not clotted till then,
it was taken as non clotting one. If it was < 20 minutes, the procedure was repeated after
6 hours. It was also repeated 6 hours after the administration of ASV.
Urine analysis was completed by adopting standard bedside procedure.
Blood sugar and urea, and serum creatinine and electrolytes were estimated using
ERBA XL 300 automated analyzer.
Blood grouping and typing was done in required cases using standard slide
method.
ECG: 12 lead ECG was taken in all the patients.
For estimating the serum levels of zinc, magnesium and iron, blood was taken by
vene puncture within 24 hours of snake bite. Vene puncture site was cleaned properly and
blood was collected in clean disposable tubes available in the market. The sample was
immediately transported to a quality controlled laboratory where the sample was
analyzed using atomic absorption spectrometry. The instrument was started up. After
start up, a pipette appeared from the instrument. Blood sample was fed to the instrument
by the principal worker. The pipette drew the necessary amount of serum and withdrew
on its own. Atomic absorption spectrometry used an atomizer to produce atoms from the
which were housed in a rotating turret so that the correct lamp can be quickly selected.
There was also an optical system and detector where a monochromator was used to select
the specific wavelength of light which was absorbed by the atom and to exclude other
wavelength which allowed the determination of selected element in the presence of
others. A calibration curve was used to determine the concentration of the element in the
sample. The instrument was calibrated using several solutions of known concentrations.
It was continuously rescaled as more concentrated solutions were used; the more
concentrated solutions absorbed more radiation up to a certain absorbance. The
calibration curve showed the concentration against the amount of radiation absorbed. The
sample solution was fed into the instrument and the concentration of element was then
displayed on the calibration curve. The instrument was standardized for quality control
repeatedly.
Conflict of interest:
There was no conflict of interest.
Financial support:
Nil.
Limitations:
1) The levels of the trace elements after complete recovery had not been measured due
to ethical reasons.
2) Whether the changes in the serum levels of the elements were absolute or due to
sequestration had not been elucidated.
3) The probable mediators for the alteration in trace elements could not be identified
4) Heterogeneity of the patients based on their phenotype and genotype could alter the
inflammatory response.
5) Pre envenomation levels, which might depend on their food habits and socio environ,
could not be assessed in view of the unnatural illness.
Statistical analysis:
Data were entered in Microsoft Excel spread sheet and analyzed utilizing the
software - epidemiological information package 2002 (Epi Info 2002) - developed by
centre for disease control and prevention, Alaska for World Health Organization. Range,
mean, standard deviation and ‘p’ values were calculated using this package. Paired‘t’ test
was done to find out the significance of relationships between the groups. Significance
RESULTS
The total number of subjects included in the study was 40. Among the 40
subjects, 20 were cases and 20 were controls and their profile is furnished below.
Age:
The age of the cases ranged from 15 to 75 years and that of controls ranged from
20 to 56. The mean and standard deviation for the cases were 38 ± 16.27 years and those
for the controls were 34.5 ± 9.82 years. Among the cases the mean age of males was 43 +
19.44 years and that of females was 33 + 11.22 years. A comparative analysis did not
show statistically significant difference (‘p’=0.3408).
Sex composition:
Among 20 cases studied, there were 10 males and 10 females. Among controls,
there were 10 males and 10 females. The differences in the sex composition among cases,
and between cases and controls were not significant.
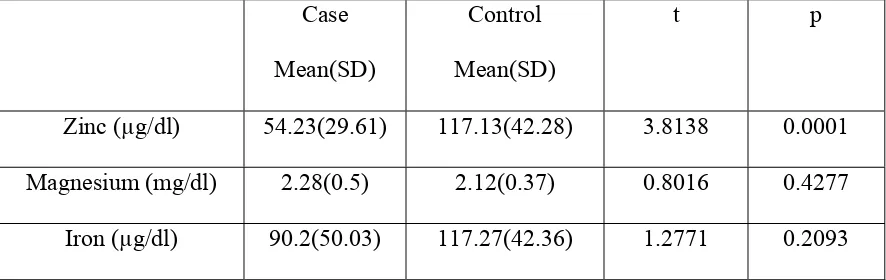
Relationship between serum trace elements among total cases and controls:
The serum zinc value in the cases was 54.23 ± 29.61 µg/dl and that of controls
was 117.13 ± 42.28 µg/dl. A comparative analysis of these values showed a statistically
significant difference (‘p’=0.0001).
The mean value of serum magnesium in the cases was 2.28 ± 0.5 mg/dl and that
µg/dl and that of controls was 117.27 ± 42.36 µg/dl. A comparative analysis of the values
of serum magnesium (‘p’=0.4277) and iron (‘p’=0.2093) among cases and controls did
not show any statistically significant difference. The details are depicted in the table-1
[image:46.612.85.528.280.420.2]given below.
Table-1
Serum level of zinc, magnesium and iron in cases and controls
Case
Mean(SD)
Control
Mean(SD)
t p
Zinc (µg/dl) 54.23(29.61) 117.13(42.28) 3.8138 0.0001
Magnesium (mg/dl) 2.28(0.5) 2.12(0.37) 0.8016 0.4277
Iron (µg/dl) 90.2(50.03) 117.27(42.36) 1.2771 0.2093
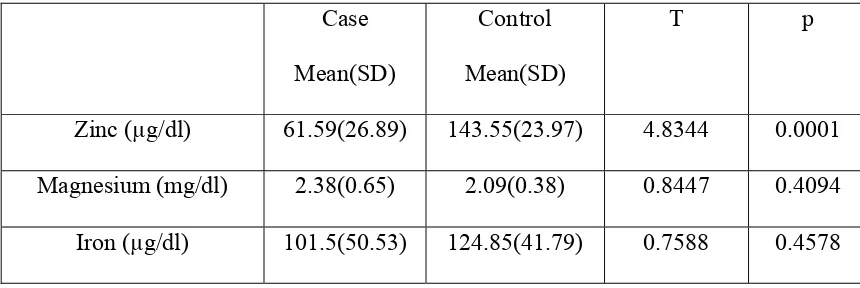
Relationship between serum trace elements among male cases and controls
The serum zinc level in male cases was 61.59 ± 26.89µg/dl and that in male
controls was 143.55 ± 23.97µg/dl. A comparative analysis of these values showed a
statistically significant difference (‘p’=0.0001).
The serum level of magnesium among male cases was 2.38 ± 0.65 mg/dl and that
among male controls was 2.09 ± 0.38 mg/dl. The iron level among male cases was 101.5
± 50.53 µg/dl and among control males was 124.85 ± 41.79µg/dl. A comparative analysis
controls did not show any statistically significant difference. The details are depicted in
[image:47.612.84.514.223.367.2]table-2 given below.
Table-2
Serum level of zinc, magnesium and iron in male cases and controls
Case
Mean(SD)
Control
Mean(SD)
T p
Zinc (µg/dl) 61.59(26.89) 143.55(23.97) 4.8344 0.0001
Magnesium (mg/dl) 2.38(0.65) 2.09(0.38) 0.8447 0.4094
Iron (µg/dl) 101.5(50.53) 124.85(41.79) 0.7588 0.4578
Relationship between serum trace elements among female cases and controls
The serum zinc level in female cases was 47.45 ± 31.88 µg/dl and that in female
controls was 90.7 ± 40.58 µg/dl. A comparative analysis of these values showed a
statistically significant difference (‘p’=0.0402).
The serum level of magnesium among female cases was 2.2 ± 0.29 mg/dl and that
among female controls was 2.16 ± 0.37 mg/dl. The iron level among female cases was
78.9 ± 49.47 µg/dl and among control females was 109.69 ± 43.75 µg/dl. A comparative
analysis between serum magnesium (‘p’=0.8578) and iron (‘p’=0.3349) among female
cases and controls did not show any statistically significant difference. The details are
Table-3
Serum level of zinc, magnesium and iron in female cases and controls
Case
Mean(SD)
Control
Mean(SD)
t p
Zinc (µg/dl) 47.45(31.88) 90.7(40.58) 2.7906 0.0402
Magnesium (mg/dl) 2.2(0.29) 2.16(0.37) 0.1818 0.8578
Iron (µg/dl) 78.9(49.47) 109.69(43.75) 0.9909 0.3349
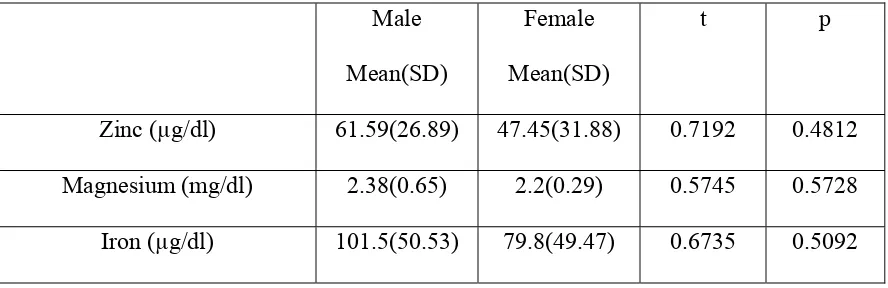
Relationship between serum trace elements among male and female cases:
Among the cases the mean serum values of zinc, magnesium and iron did not
show statistically significant difference when compared between males and females
(‘p’ > 0.05). The details are depicted in table-4 below.
Table-4
Serum level of zinc, magnesium and iron in male and female cases
Male
Mean(SD)
Female
Mean(SD)
t p
Zinc (µg/dl) 61.59(26.89) 47.45(31.88) 0.7192 0.4812
Magnesium (mg/dl) 2.38(0.65) 2.2(0.29) 0.5745 0.5728
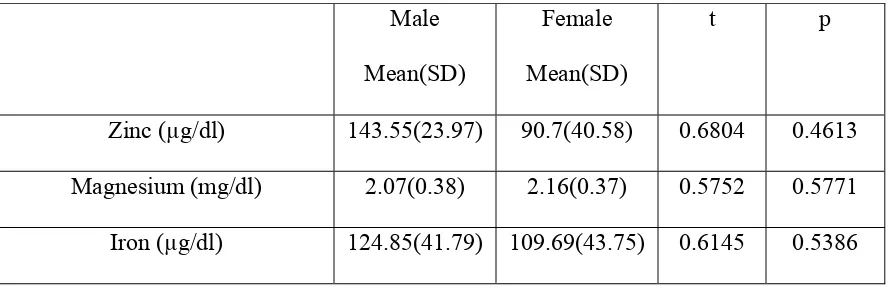
[image:48.612.85.529.530.674.2]Relationship between serum trace elements among male and female controls:
Among the controls the mean serum values of zinc, magnesium and iron did not
show statistically significant difference when compared between males and females (‘p’
[image:49.612.86.523.291.437.2]> 0.05). The details are depicted in table-5 below.
Table-5
Serum level of zinc, magnesium and iron in male and female controls
Male
Mean(SD)
Female
Mean(SD)
t p
Zinc (µg/dl) 143.55(23.97) 90.7(40.58) 0.6804 0.4613
Magnesium (mg/dl) 2.07(0.38) 2.16(0.37) 0.5752 0.5771
Iron (µg/dl) 124.85(41.79) 109.69(43.75) 0.6145 0.5386
Relationship between time of bite and admission, and trace element levels:
The serum levels of zinc, magnesium and iron did not show statistically
significant difference due to delay in reaching the hospital for management (‘p’ > 0.05).
Table-6 shows this detail. The mean time period between the time of bite and admission
to the hospital was 6.13 + 10.53 hours and the time of starting ASV to the patients was
9.53 + 10.5 hours. The reduction in serum zinc level among the patients with
envenomation was significantly lower than healthy control irrespective of the interval
[image:49.612.85.530.292.437.2]Table-6
Serum trace element level and time lapse for admission to hospital:
< 2 hrs (n=11)
Mean(SD)
2-6 hrs (n=6)
Mean(SD)
> 6 hrs (n=3)
Mean(SD)
t p
Zinc (µg/dl) 52.84(31.25) 65.98(26.68) 46.83(35.26) 0.5195 0.6194
Magnesium (mg/dl) 2.85(0.45) 2.38(0.74) 2.23(0.29) 0.2799 0.7877
Iron (µg/dl) 83.47(53.7) 114.62(49.47) 81.8(30.97) 0.7455 0.4802
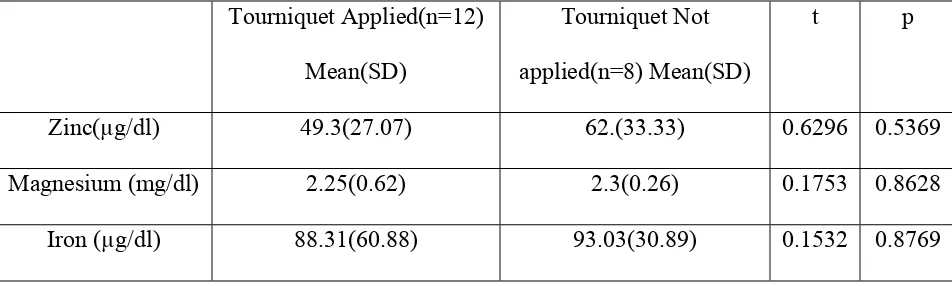
Relationship between tourniquet application and trace elements:
The relationship between application of tourniquet and the alterations in the levels
of zinc, magnesium and iron were studied. There was no statistically significant
difference which was shown by ‘p’ > 0.05. The following table shows this detail.
Table-7
Serum trace element level and application of tourniquet:
Tourniquet Applied(n=12)
Mean(SD)
Tourniquet Not
applied(n=8) Mean(SD)
t p
Zinc(µg/dl) 49.3(27.07) 62.(33.33) 0.6296 0.5369
Magnesium (mg/dl) 2.25(0.62) 2.3(0.26) 0.1753 0.8628
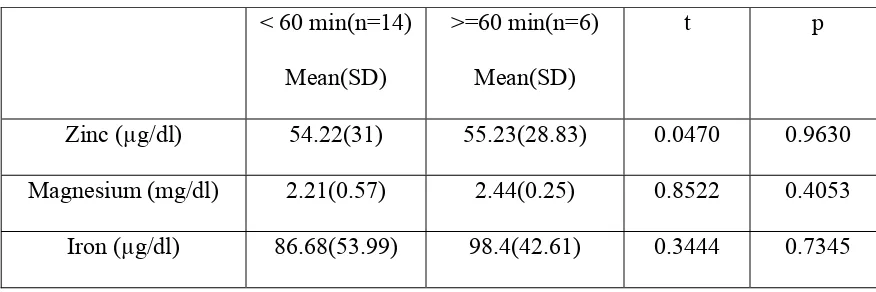
[image:50.612.74.550.531.674.2]Relationship between time of onset of cellulitis and serum trace element levels:
The time of onset of cellulitis and the serum levels of zinc, magnesium and iron
was studied. There was no statistically significant difference as ‘p’ is > 0.05. Table-8
[image:51.612.84.522.290.436.2]shows this detail. The average time of onset of cellulitis was 72.75 + 133.94 minutes.
Table-8
Serum levels of trace elements and time of onset of cellulitis
< 60 min(n=14)
Mean(SD)
>=60 min(n=6)
Mean(SD)
t p
Zinc (µg/dl) 54.22(31) 55.23(28.83) 0.0470 0.9630
Magnesium (mg/dl) 2.21(0.57) 2.44(0.25) 0.8522 0.4053
Iron (µg/dl) 86.68(53.99) 98.4(42.61) 0.3444 0.7345
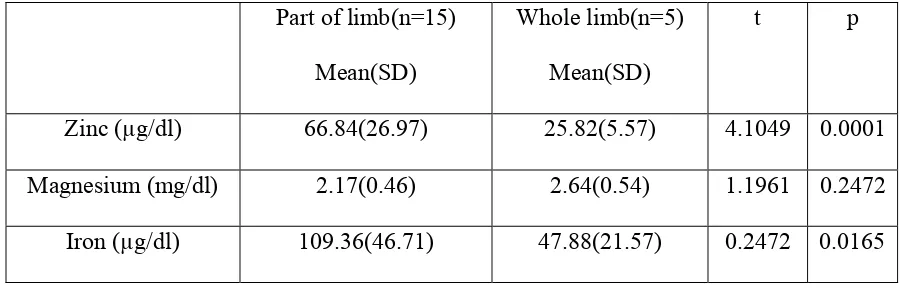
Relationship between extent of cellulites and serum trace elements levels:
The serum level of zinc in patients who had developed cellulitis over the entire
limb in which bite had acquired was 25.82 + 5.57 µg/dl, whereas that in patients who had
developed cellulitis was 66.84 + 26.97 µg/dl. Comparing these two values showed
statistically significant difference (‘p’= 0.0001), thus indicating the fall in serum zinc
level was significantly associated with the nature/manifestation of inflammatory
Similarly the serum iron values also showed statistically significant difference of
‘p’ = 0.0165, but serum magnesium did not show statistically significant difference (‘p’ >
[image:52.612.96.546.251.395.2]0.05). These details are shown in table-9.
Table-9
Serum zinc, magnesium and iron, and extant of cellulitis:
Part of limb(n=15)
Mean(SD)
Whole limb(n=5)
Mean(SD)
t p
Zinc (µg/dl) 66.84(26.97) 25.82(5.57) 4.1049 0.0001
Magnesium (mg/dl) 2.17(0.46) 2.64(0.54) 1.1961 0.2472
Iron (µg/dl) 109.36(46.71) 47.88(21.57) 0.2472 0.0165
Relationship between the presence of mucocutaneous bleed and trace elements:
The relationship between the presence of mucocutaneous bleed and serum levels
of trace elements was studied. Observations did not show any statistically significant
difference in their levels when compared between the patients with and without
mucocutaneous bleed as the ‘p’ value was > 0.05. These details are shown in table-10
Table-10
Mucocutaneous bleed and trace element level
Mucocutaneous bleed
present(n=16)Mean(SD)
Mucocutaneous bleed
absent (n=4) Mean(SD)
t p
Zinc (µg/dl) 48.33(26.33) 79.27(24.94) 1.1254 0.2872
Magnesium (mg/dl) 2.27(0.53) 2.29(0.18) 0.1405 0.8591
Iron (µg/dl) 80.22(45.5) 130.07(40.3) 1.0627 0.3516
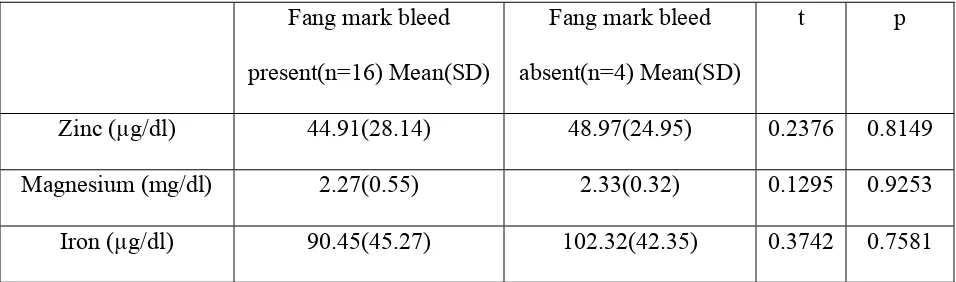
Relationship between bleeding from fang marks and trace elements:
Comparing the levels of trace elements among patients with and without bleeding
from the fang marks did not show any statistically significant difference as the ‘p’ value
was > 0.05. Table-11 shows these details.
Table-11
Fang mark bleed and trace element level
Fang mark bleed
present(n=16) Mean(SD)
Fang mark bleed
absent(n=4) Mean(SD)
t p
Zinc (µg/dl) 44.91(28.14) 48.97(24.95) 0.2376 0.8149
Magnesium (mg/dl) 2.27(0.55) 2.33(0.32) 0.1295 0.9253
[image:53.612.72.550.572.713.2]ASV vials per patient:
The total number of vials of ASV given per patient on an average was 14.4 +
7.17.
Total days of inpatient stay:
On an average each patient stayed for a period of 3.95 + 0.94 days in the hospital.
There were no deaths, and none of them underwent fasciotomy or hemo dialysis.
DISCUSSION
Snake bite is an important health hazard in developing countries like India. As the
victims of snake bite are mostly healthy and belong to the economically productive age
group, the study about inflammation and its effects in the human body is essential in
order to introduce specific or supportive therapy or modifying the current therapeutic
programme.
Among these 20 cases studied, the mean age of the patients who suffered from
snake bite was 38 +16.25 years, with a range of 15 to 75 years. This is in par with the
observations of Sawai and Homa (1974), who observed a range of 11 to 50 years.
Regarding the sex distribution previous studies had shown a 3:1 ratio among
males and females (Sawai and Homa, 1974), but in the present study male and female
ratio was 1:1 because of the criteria adopted for inclusion and exclusion.
Snake bite and envenomation is a major health hazard mainly in the rural areas. In
the present study 75% of the cases were from rural areas. Similarly 95% of our cases
were agricultural workers. All the bites had been acquired in outdoor environment, during
the working hours from morning 6 am to evening 6 pm, except only one patient who
acquired the bite during the mid night.
80% of the bites were over the lower limbs especially on the foot. This shows that
wearing of shoes might have protected them. However people who work in the fields
holy places and wearing a shoe while working is a sin. All other bites were over the
hands, where wearing a glove could have protected them.
Envenomation does not depend on the age and size of the snake (Kochva, 1978).
Even though the snake might have swallowed a prey just before bite, there is a possibility
of envenomation. In the present study also a person with features of envenomation was
bitten by a small snake which had swallowed two rats.
30% of the patients had nonspecific complaints mainly due to fear and anxiety.
The commonly encountered symptoms were headache, vomiting, giddiness and sweating.
The primary task was to differentiate this from neurotoxicity, but none developed
neurotoxicity in the present study.
Skin lesions developed in only two of our patients in the form of cutaneous bleb
going for ulceration and the other developed hematoma with skin discolouration. There
was no significant correlation between skin lesion and the intensity of envenomation.
None developed compartment syndrome.
All the patients had prolonged clotting time (> 20 min). All had normal ECG.
Only one patient was transfused with fresh blood, as she developed massive UGI bleed.
None of them underwent any surgical procedure or dialysis or mechanical ventilation. On
an average 14.4 vials of ASV was given per patient. Among them seven patients
developed reactions to ASV. The common symptoms were itching and rash. Two of
them had fever with chills and rigors, and the other one had vomiting. One of the patients
were taken before the administration of ASV and so the allergic reactions might not have
any effect on the trace elements estimated here.
The duration of stay in the hospital on an average was four days. As the duration
was less, there were no significant complications during stay.
Studies show alterations in the serum levels of trace elements during acute
inflammation. The mechanisms by which these alterations occur have not been elucidated
as also the effects of these alterations. Various hypotheses have been put forth for these
alterations like changes in renal handling of these elements by the actions of cytokines
which are the key mediators of inflammation (Beisel et al, 1995). The other one is
sequestration of these elements from serum into tissues of the body. This supports the
view that, tissue estimate of trace elements by biopsy should have been done along with
serum levels, to assess their alterations during inflammation. Similarly, sequential
measurement is necessary to assess the changes in their levels (Scrimshaw, Taylor and
Gordon, 1968).
The effects of these changes may be a protective auto regulatory mechanism to
minimize the damage produced by inflammation. For example, reduction in serum zinc
and iron levels decreases the vigor of inflammation due to infection where iron serves as
an enrichment medium for growth and multiplication of organisms (Gordeuk et al, 2001).
Similarly it decreases the formation of free radicals. A zinc deficient state may also