d i r e c ti o n d e fici t t o e v al u a t e
c u t ti n g a b ility
C u t h b e r t , M , D o s ' S a n t o s , T, T h o m a s , C a n d Jo n e s , PA
h t t p :// dx. d oi.o r g / 1 0 . 1 5 1 9 /J SC. 0 0 0 0 0 0 0 0 0 0 0 0 2 3 4 6
T i t l e T h e a p p lic a tio n of c h a n g e of d i r e c tio n d eficit t o e v al u a t e c u t ti n g a b ility
A u t h o r s C u t h b e r t , M , Do s ' S a n t o s , T, T h o m a s , C a n d Jo n e s , PA
Typ e Ar ticl e
U RL T hi s v e r si o n is a v ail a bl e a t :
h t t p :// u sir. s alfo r d . a c . u k /i d/ e p ri n t/ 4 4 2 7 0 /
P u b l i s h e d D a t e 2 0 1 7
U S IR is a d i gi t al c oll e c ti o n of t h e r e s e a r c h o u t p u t of t h e U n iv e r si ty of S alfo r d . W h e r e c o p y ri g h t p e r m i t s , f ull t e x t m a t e r i al h el d i n t h e r e p o si t o r y is m a d e f r e ely a v ail a bl e o nli n e a n d c a n b e r e a d , d o w nl o a d e d a n d c o pi e d fo r n o
n-c o m m e r n-ci al p r iv a t e s t u d y o r r e s e a r n-c h p u r p o s e s . Pl e a s e n-c h e n-c k t h e m a n u s n-c ri p t fo r a n y f u r t h e r c o p y ri g h t r e s t r i c ti o n s .
ABSTRACT
The purpose of this study was to examine the application of the change of direction deficit
(CODD) to a 90° cut test in order to examine whether CODD provides a unique evaluation of
an individual’s cutting ability. Thirty-six male collegiate team–sport (23 Rugby/ 13 Soccer)
athletes (age: 20 ± 1.4 years; height: 1.80 ± 0.08 m; mass: 83 ± 13.2 kg) participated in the
study. Each athlete performed 3 trials of a 20 m sprint (with 5 m and 10 m splits) and 2
change of direction [COD] tests (90° cut and 505 tests) cutting/ turning from both limbs.
Completion times for all sprint and COD tests were measured using timing cells. For both
COD tests, CODD was determined (COD completion time – 10 m sprint time). Pearson’s
correlation was used to explore relationships between sprint times and CODD and completion
times. Significant (P < 0.001) moderate to large (r ≥ 0.467) correlations between sprint times
and 90°cut completion times for left and right cuts were observed. Non-significant (P > 0.05)
trivial to small correlations (r ≤ 0.199) were found between sprint variables and 90° cut
CODD. Significant (P < 0.001) large to very large correlations (r ≥ 0.531) were revealed
between left and right 90° cut and 90° cut CODD. The results suggest the CODD could be
applied to isolate and assess cutting ability in COD speed tests that involve a single cutting
maneuver. Failure to inspect CODD could lead to incorrect evaluation of an athletes cutting
or COD ability.
INTRODUCTION
Development of change of direction (COD) speed is important to provide the physical
and technical foundation to develop agility (12). Due to this importance, sports science
practitioners need to select an appropriate test to evaluate COD speed. There are a large
variety of tests available to practitioners and researchers to assess this quality including; the
505 (1,4,10), pro-agility (16), L-run (5,16), T-test (11) and Illinois test (19). However, a
limitation of many of these tests is their duration. The emphasis an assessment has on COD
speed declines the longer the test, becoming more reliant on anaerobic capacity and sprint
ability, as more time is spent running between COD actions (12). For instance, typical test
durations for the T-test, Illinois, L-Run and Pro-Agility are 8-12 seconds (11,19), 14-18
seconds (19), 6-8 seconds (5,16) and 4-5 seconds (13,16), respectively. Therefore,
performance on all of these tests may be influenced by metabolic limitations (19) and sprint
ability (12) and less on COD ability.
Typical completion times for the 505 test are 2-3 seconds, and thus may potentially
avoid the limitation of test duration (5,10,12). The 505 removes much of the task complexity
of other tests as with only one turn involved it provides a measure of an individual’s ability to
negotiate a 180° turn. However, the completion time of a 505 test may not necessarily
provide a measure of COD ability. Nimphius et al. (13) found that only 31% of the time
during a 505 test is spent turning, with the remainder of the time decelerating and
accelerating. Therefore, linear sprinting ability may also influence 505 completion times.
Several studies have found a relationship between linear sprinting speed and 505 test
performance (5,10,12,14), despite the acknowledgement that speed and COD speed are
different physical qualities (20). Furthermore, Sayers et al. (14), using 3D motion analysis to
examine 505 performance times over distances 0.3, 0.5 and 1 m before and after the turn
revealed strong relationships between 505 time and 5, 10 and 20 m sprint performance.
However, the strength of these relationships reduced when COD ability was measured 0.5 m
and 0.3 m before and after the turn, highlighting that 505 performance time could be biased
by linear sprinting ability.
An innovative approach to overcome this limitation is to apply the COD deficit
(CODD) (12,13), whereby a 10 m sprint time is subtracted from the 505 time. The lower the
value, the greater the COD ability. This concept was initially proposed and investigated in 66
collegiate American football players by Nimphius et al. (13), whereby a 10 yard sprint split
time was subtracted from a 10 yard split time during a pro-agility test (the resultant time
provided an indication of the time taken to negotiate a 180° turn). Significant (P < 0.001)
correlations were observed between pro-agility scores (total and split) time and 10 yard sprint
performance. However, a low non-significant correlation was observed between CODD and
10 yard sprint time (r = 0.19), but significant moderate correlations were observed to
pro-agility (r = 0.54) and pro-pro-agility split times (r = 0.61). This data suggested that the CODD
offered a measure of COD speed independent of linear sprinting speed. More recently,
Nimphius et al. (12) investigated the application of the COD deficit within the 505 test in 17
cricketers. The authors found that CODD strongly correlated to 505 (r = 0.74 - 0.81), but not
10 m sprint time (r = -0.11-0.10), whilst 505 time correlated with sprint time (r = 0.52 - 0.70).
Furthermore, when Z scores were examined, 5 of the 17 subjects were classified differently in
terms of COD ability when using 505 or CODD. The results provided further support for the
use of CODD to quantify an individual’s COD ability, rather than being confounded by linear
sprinting speed. Although, it should be noted that 180° turns are prevalent in cricket and thus,
it is unknown whether such findings apply to sports performers where 180° turns are less
utilized (i.e., American football, basketball, soccer and rugby league). Moreover, the authors
different angles, particularly for sports where cutting 45° to 90° might be more prevalent
(3,7).
A test to evaluate cutting ability using a single cut maneuver might be more useful for
certain sports, such as rugby union (7) and soccer, where the majority of CODs are reported
to be between 0 and 90° (3). However, again such a test would also be influenced by linear
running speed. Therefore, the aim of this study was to examine the application of the CODD
principle to a 90° cut test, to see if the CODD provides a unique evaluation of an individual’s
cutting ability. It was hypothesized that there would be a strong relationship between linear
sprint times and 90° cut completion times and between 90° cut completion times and CODD
during the 90° cut test. It is further hypothesized that there would be no relationship between
linear sprint times and 90° cut CODD.
METHODS
EXPERIMENTAL APPROACH TO THE PROBLEM
This study used a cross-sectional design where 36 subjects performed three 20 m sprints with
5, 10 and 20 m sprint times recorded. All subjects also performed 2 COD tests; a 505 test and
a 90° cut test (3 trials each turning from right and left limbs). Completion times were
recorded along with CODD (COD test completion time – 10 m linear sprint time) for both
COD tests. To test the study hypothesis Pearson’s correlations (normally distributed data)
were used to explore relationships between linear sprints times and COD completion times
and CODD. Furthermore, for the 90° cut test, Z scores were used to evaluate each subject
within the sample using both test completion time and CODD, to examine whether subjects
SUBJECTS
36 male collegiate team–sport athletes (23 rugby union/league and 13 soccer players) aged
between 18 and 22 years (height: 1.80 ± 0.08 m; mass 83 ± 13.2 kg) participated in the study.
For inclusion in the study, all players needed to have played soccer or rugby for a minimum
of 5 years and regularly performed 1 game and 2 structured skill based sessions per week. All
players were free from injury during the course of the study and none of the player’s had
suffered prior traumatic knee injury such as anterior cruciate ligament injury. Data collection
took place during the player’s pre-season. The study was approved by the University’s Ethics
committee and all subjects were informed of the benefits and risks of the investigation prior
to signing an institutionally approved informed consent document to participate in the study.
PROCEDURES
Each subject attended the lab on one occasion and performed a sprint assessment, 90° cut test
(Figure 1) and 505 test (Figure 2). Each subject was familiar with the test protocols. Each
subject attended the lab in a fed and hydrated state, with no caffeine or food intake within 2
hours of data collection. Each subject also performed no training or vigorous exercise within
24 hours of the data collection session. Prior to data collection, each subject performed a
typical pre-game warm-up routine incorporating low-intensity jogging (10 minutes) sprint
and low intensity plyometric drills (i.e., high knee marching, running, skipping over 20
meters), short sprint (20 m) and change of direction drills (90° cuts and 180° turns),
increasing intensity of each effort (e.g. 50%, 75% and 100%).
Sprint Assessment (5m, 10m & 20m Sprint).
20m sprint times were recorded using Brower (single beam) timing gates (model number
positioned 0 m, 5 m, 10 m and 20 m down an indoor running track (Mondo, SportsFlex, 10
mm; Mondo America Inc., Mondo, Summit, NJ, USA). Players were instructed to stand 0.5
m behind the first gate, preventing early triggering, in a two-point staggered stance. Players
performed two warm up trials at 50% and 75% maximum effort before being instructed to
give a maximal effort for the whole 20 m. Three trials were completed with one minute’s rest
between each trial.
Change of Direction Speed Assessment
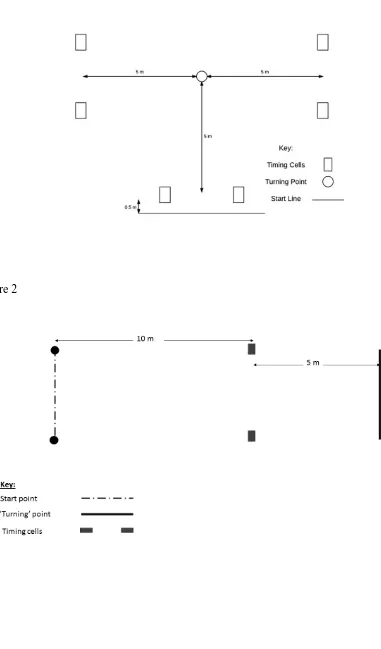
90° cut test
Brower timing gates were placed at a starting point 5 m away from a marked turning point
with two sets placed a further 5 m away at an angle of 90° (Figure 1). Subjects again started
0.5 m away from the first gate, and were instructed to sprint maximally towards the turning
point. At the turning point, subjects performed the 90° cut (by ‘planting’ the designated leg
on the marked turning point and ‘cutting’ to the opposite side) before sprinting through the
second set of timing gates set up on the left or right side, depending on which leg was
designated to act as the ‘plant’ leg for the cut. Right and left 90° cut performance was defined
by the leg in which the subjects used to turn (the ‘plant’ leg). The trials were carried out
turning on each leg for 3 trials and the time in seconds was recorded. The average of all trials
was determined and used for further analysis. Two minutes’ rest between each trial was given
to the athletes.
<<INSERT FIGURE 1 HERE>>
505 test
For comparison purposes, each subject performed 3 trials each of the 505 test performed
approximately hip height (1 m), 5 m from a marked turning point (Figure 2). The 505 test
started 15 m away from the turning point (Figure 2). Instructions were given to accelerate as
quickly as possible to the turning point (passing the timing gates after 10 m), turn 180° on the
left or right leg and sprinting back through the timing gates. Players had two minutes’ rest
between each trial. Each player performed 3 trials on the left leg and 3 trials on the right leg
in a randomized order. The average of all 3 trials on each leg was determined and used for
further analysis. For both the 90° cut and 505 test, CODD was determined using the formula;
average COD task completion time – average 10 m sprint time. The average COD task
completion time referred to either the 505 test time or 90° cut test time, so that CODD was
calculated for each task turning or cutting with right and left limb (4 different measures).
<<INSERT FIGURE 2 HERE>>
STATISTICAL ANALYSES
Within session reliability for sprint and COD performance was assessed using intraclass
correlation coefficients (ICC) and coefficient of variation (%CV). Minimum acceptable
reliability was determined with an ICC >0.7 and CV <15 (2). Statistical analysis was carried
out using SSPS software (version 23.0, SPSS, Inc., IL, USA). Normality of all data was
confirmed using a Shapiro-Wilks test. Therefore, Pearson’s correlation (r) and co-efficients
of determination (r2 × 100) were used to explore relationships between sprint (5, 10 and 20
m) and COD assessments (90° cut, 505 test and corresponding CODD values). All P-values
were Bonferroni adjusted to control for Type 1 error. Statistical significance was set at P <
0.05. Correlations were evaluated as follows: trivial (0.0-0.09), small (0.10 – 0.29), moderate
(0.30 – 0.49), large (0.50 – 0.69), very large (0.70 – 0.89), nearly perfect (0.90 – 0.99), and
perfect (1.0) (9). In addition, using a similar approach to Nimphius et al. (12) for the 90° cut
completion times and 90° CODD to identify whether athletes were classified differently
when using the CODD.
RESULTS
Descriptives for each variable are presented in Table 1. Low within session
co-efficient of variation was reported for all sprint and COD tests, whilst acceptable ICC’s were
reported for all tests with the exception of 5 m sprint time and 505 right (5m; ICC = 0.68, CV
= 2.77%; 10m; ICC = 0.85; CV = 2.17%; 20m; ICC = 0.86; CV = 1.65%; 505 left; ICC =
0.72; CV = 2.76%; 505 right; ICC = 0.63; CV = 3.10%; 90° cut left; ICC = 0.77; CV =
2.92%; 90° cut right; ICC = 0.72; CV = 3.13%).
**INSERT TABLE 1 HERE**
Table 2 revealed significant (P < 0.001) moderate to large (r ≥ 0.47; r2 ≥ 22%)
correlations between sprint times and 90° cut completion times for left and right cuts.
However, non-significant (P > 0.05) trivial to small correlations (r ≤ 0.199; r2 ≤ 3.96%) were
found between sprint variables and 90° cut CODD (Table 2). Significant (P < 0.001) large to
very large correlations were revealed between left and right 90° cut and 90° cut CODD
(Table 2).
**INSERT TABLE 2 HERE**
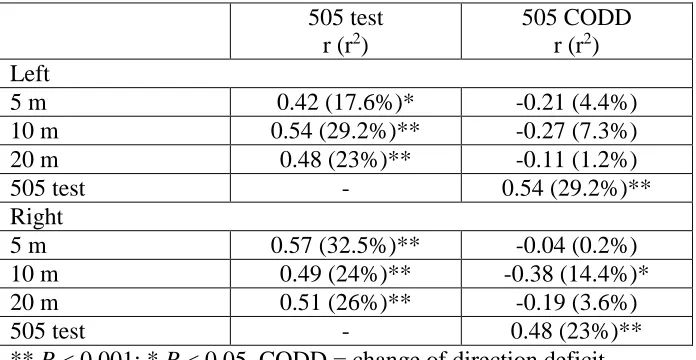
Sprint times revealed significant (P < 0.001) moderate to large (r ≥ 0.42; r2 ≥ 17.6%)
correlations to 505 test completion times for left and right turns (Table 3). However, only one
significant (P < 0.05) moderate correlation was revealed between 10 m sprint and right 505
CODD, whereas all other correlations between sprint and 505 CODD were trivial to small
(Table 3). Significant (P < 0.001) moderate to large correlations were revealed between left
**INSERT TABLE 3 HERE**
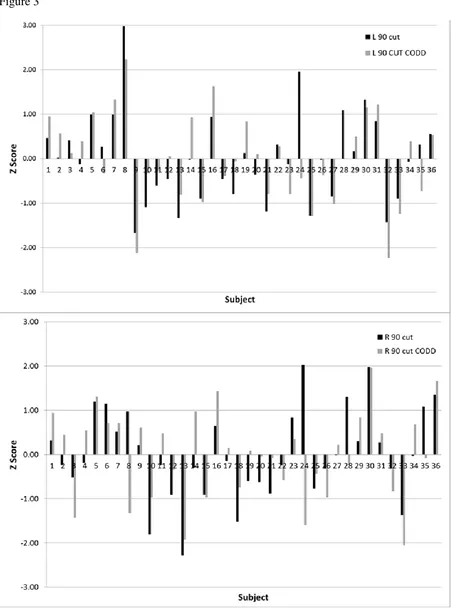
Figure 3 shows z-scores for 90° cut completion times and 90° cut CODD, in which
large changes in z scores can be seen between the two measures for each subject. For the
right leg cuts, 12 of the 36 subjects were re-classified based on COD ability using the CODD
(i.e., the Z score shifted from positive (slower than average) to negative (faster than average)
or vice versa). Similarly for left leg cuts, 8 out of 36 players were re-classified in a similar
way.
**INSERT FIGURE 3 HERE**
DISCUSSION
The aim of the present study was to examine the application of the CODD to a 90° cut
task, to see if the CODD deficit provided a different evaluation of an individual’s cutting
ability. The main findings of the study were that significant (P < 0.001) moderate to large (r ≥
0.47; r2 ≥ 22%) correlations were observed between sprint times (5, 10 and 20 m) and 90° cut
completion times for left and right cuts. However, when using the 90° cut CODD,
non-significant (P > 0.05) trivial to small correlations (r ≤ 0.20; r2 ≤ 4%) were found between
sprint variables and 90° cut CODD, with significant (P < 0.001) large to very large
association between left and right 90° cut and 90° cut CODD remaining. 505 test completion
times revealed significant (P < 0.001) moderate to large (r ≥ 0.42; r2 ≥ 17.6%) correlations to
sprint times. However, when using CODD with the exception of a moderate significant (P <
0.05) correlation between 10 m sprint time and right 505 CODD, all other correlations
between sprint and 505 CODD were trivial to small, whilst significant (P < 0.001) moderate
to large correlations remained between 505 times and 505 CODD. In addition, when
examining calculated individual Z-scores for right leg cuts 12 of the 36 subjects were
were re-classified based on CODD. The findings substantiated the study hypothesis and that
the CODD deficit can be applied to a 90° cut test to isolate COD ability, rather than be
confounded by linear sprinting speed.
The results of present the study support the findings of Nimphius et al. (13) and
Nimphius et al. (12) for the 505 test or single 180° turns, in that 505 test performance was
moderately to largely correlated to linear sprint times, but when using the CODD the
correlations to linear sprinting ability were small or absent. Furthermore, 505 test
performance showed a moderate correlation (r = 0.48) to CODD in the 505 test; suggesting
that 23% of the variation in 505 test performance could be explained by COD ability as
measured by the CODD. The results of the present study provide further support for the
utilization of CODD to quantify COD ability during a 505 test, particularly in sports where
the 180° turn is common such as running between wickets when batting in cricket, or during
certain running routes in American football (i.e., a ‘stop n go’).
An advantage of the present study is that the results show that the CODD can be used
to quantify COD ability during a sharp cutting task, which often is more widely observed in
field and court sports such as basketball (15), American football (6), netball (18), soccer (3)
and rugby union (7). The 90° cut task used in the present study revealed large correlations to
linear sprint performance (5, 10 and 20 m). When using the CODD, the correlations to linear
sprint times were trivial to small (r ≤ 0.32). Whereas large (r ≥ 0.53) correlations were
observed between 90° cut completion times and 90° cut CODD. These results suggested that
applying the CODD to a 90° cut within a COD speed test isolates ‘cutting’ ability, and is not
influenced by linear running speed, which is the case with the 90° cut completion times. This
finding is similar to what was observed with the 505 test in this study and in previous
The calculated Z scores (Figure 3) revealed that for the right and left leg turns, 12 and
8 out of 36 athletes, respectively, were classified differently with regard to COD ability when
using 90° cut CODD compared to completion times. These results provided further support
for the application of CODD to the 90° cut task to isolate COD ability. These findings are
similar to the findings of Nimphius et al. (12) and suggest that without applying the CODD to
such tasks could lead to incorrect training prescription with regard to COD training of
athletes. Furthermore, 5 athletes observed similar trends across both legs. However, 7 athletes
were classified differently on right leg cuts, but classified the same on left leg cuts, whereas 3
athletes where classified differently for left leg cuts, but the same for right leg cuts. This
further highlights the need to assess CODD across both limbs to ensure that training
prescription is directed to ensure athletes become equally proficient at cutting from either
limb.
Although, low and acceptable CV’s were reported (≤3.13%) for all variables in the
present study. Only moderate to acceptable ICC’s (0.63 – 0.86) were found. This lower
relative reliability reported may be due to the use of single beam timing cells. The reliability
(ICC’s) of these variables would be enhanced with the use of dual-beam timing cells (8).
Therefore, application of the CODD and the 90° cut test in future research or applied practice
should use dual-beam timing cells to enhance within session reliability of these tests. Further
limitations pertain to the University-level male soccer and rugby athletes used in the study.
Although, both sports involve high prevalence of cutting actions (3,7), the heterogeneity in
subject population may have influenced the magnitude of correlations observed. Future
studies should evaluate the application of CODD to individual sports and consider the
application of CODD to high level professional athletes. Finally, it was beyond the scope of
the study to collect additional biomechanical data to evaluate the biomechanical
influence this variable to inform future training prescription. Future research into the
technical determinants of CODD is required to inform future practice.
To conclude, the CODD can be applied to a 90° cut task and thus, could be applied to
sports where cutting ability is of high importance. The CODD when applied to a 90° cut
provides an isolated measure of ‘cutting’ ability, removing the influence of running speed on
such tests of COD ability. Future research is required to apply the CODD to cutting tasks in a
variety of cutting sports to provide information of how CODD differs between different
levels and populations of athlete. Furthermore, an investigation on the technical determinants
of CODD in cutting is required to inform coaches with regard to instructing athletes to
enhance ‘cutting’ ability.
PRACTICAL APPLICATIONS
Sports scientists should apply the CODD to COD speed tests that involve a single
cutting movement to isolate and assess the athletes ‘cutting’ ability from linear running
speed. Failure to apply the CODD to such cutting tasks could lead to incorrect evaluation of
an athletes cutting (COD) ability and lead to errors in training prescription. The 90° cut test
modified from the 505 test to involve a cutting maneuver is recommended in sports where
REFERENCES
1. Barber OR, Thomas C, Jones PA, McMahon JJ, and Comfort P. Reliability of the 505
Change-of-direction test in Netball Players. Int J Sports Physiol Perf 11:377-380,
2016.
2. Baumgartner TA, and Chung H. Confidence Limits for Intraclass Reliability
Coefficients. Meas Phys Educ Exerc Sci 5:179–88, 2001.
3. Bloomfield J, Polman R, and O'Donoghue P. Physical demands of different positions
in FA Premier League soccer. J Sports Sci Med 6: 63-70, 2007.
4. Draper JA, and Lancaster MG. The 505 test: A test for agility in the horizontal plane.
Aust J Sci Med Sport 17:15-18, 1985.
5. Gabbett TJ, Kelly JN, and Sheppard JM. Speed, change of direction speed, and
reactive agility of rugby league players. J Strength Cond Res. 22: 174-181, 2008.
6. Gleason BH, Kramer JB, and Stone MH. Agility training for American football.
Strength Cond J 37: 65-71, 2015.
7. Green BS, Blake C, and Caulfield BM. A comparison of cutting technique
performance in rugby union players. J Strength Cond Res 25: 2668-2680, 2011.
8. Haugen, T, and Buchheit, M. Sprint running performance monitoring: Methodological
and practical considerations. Sports Med 46: 641-656, 2016.
9. Hopkins WG. Measures of reliability in sports medicine and science. Sports Med 30:
1-15, 2000.
10.Jones P, Bampouras T, and Marrin K. An investigation into the physical determinants
of change of direction speed. J Sports Med Phys Fitness 49: 97-104, 2009.
11.Munro AG, and Herrington LC. Between session reliability of four hop tests and the
12.Nimphius S, Callaghan SJ, and Lockie, R. Change of direction deficit: A more
isolated measure of change of direction performance than total 505 time. J Strength
Cond Res 30: 3024-3032, 2016.
13.Nimphius S, Geib G, Spiteri T, and Carlisle, D. "Change of direction" deficit
measurement in division I American football players. J Aust Strength Cond 21:
115-117, 2013
14.Sayers MGL. Influence of test distance on change of direction speed test results. J
Strength Cond Res 29: 2412-2416, 2015.
15.Shimokochi Y, Ide D, Kokubu, M and Nakaoji T. Relationships among performance
of lateral cutting maneuver from lateral sliding and hip extension and abduction
motions, ground reaction force and body center of mass height. J Strength Cond Res
27: 1851-1860, 2013.
16.Sierer SP, Battaglini CL, Mihalik JP, Shields EW, and Tomasini, NT. The National
Football League combine: Performance differences between drafted and non-drafted
players entering the 2004-2005 drafts. J Strength Cond Res 22: 6-12, 2008.
17.Sporis G, Jukic I, Milanovic L, and Vucetic V. Reliability and factorial validity of
agility tests for soccer players. J Strength Cond Res 24: 679-686, 2010.
18.Sweeting AJ, Aughey RJ, Cormack SJ, and Morgan S. Discovering frequently
recurring movement sequences in team-sport athlete spatiotemporal data, J Sports Sci
35: 2439-2445, 2017.
19.Vescovi JD, and McGuigan MR. Relationships between sprinting, agility, and jump
ability in female athletes. J Sports Sci 26: 97-107, 2008.
20.Young WB, McDowell MH, and Scarlett BJ. Specificity of sprint and agility training
LIST OF TABLES AND FIGURES
Table 1. Descriptives for sprint and COD tests.
Table 2. Relationships between sprint and 90° cut completion times and 90° cut CODD.
Table 3. Relationships between sprint and 505 completion times and 505 CODD.
Figure 1. Example of left and right 90° cutting task.
Figure 2. Example of the 505 COD test
Table 1. Descriptives for sprint and COD tests.
Variable Mean ± SD Right Left
5 m (s) 1.07 ± 0.06
10 m (s) 1.87 ± 0.13
20 m (s) 3.19± 0.18
90° Cut (s) 2.34 ± 0.17 2.34 ± 0.15 2.37 ± 0.21
90° Cut CODD (s) 0.47 ± 0.12 0.47 ± 0.10 0.49 ± 0.15
505 test (s) 2.50 ± 0.15 2.48 ± 0.14 2.51 ± 0.14
505 CODD (s) 0.63 ± 0.14 0.60 ± 0.12 0.64 ± 0.12
[image:18.595.66.414.288.476.2]Note; CODD = Change of direction deficit.
Table 2 Relationships between sprint and 90° cut completion times and 90° cut CODD.
90° Cut r (r2)
90° Cut CODD r (r2) Left
5 m 0.47 (22.1%)** 0.06 (0.4%)
10 m 0.61 (37.2%)** 0.04 (0.2%)
20 m 0.64 (41%)** 0.20 (4%)
90° cut - 0.77 (59.3%)**
Right
5 m 0.64 (41%)** 0.10 (1%)
10 m 0.75 (56.3%)** -0.01 (0.01%)
20 m 0.84 (70.6%)** 0.32 (10.2%)
90° cut - 0.531 (28.2%)**
[image:18.595.67.415.538.718.2]** P < 0.001; * P < 0.05. CODD = change of direction deficit.
Table 3 Relationships between sprint and 505 completion times and 505 CODD.
505 test r (r2)
505 CODD r (r2) Left
5 m 0.42 (17.6%)* -0.21 (4.4%)
10 m 0.54 (29.2%)** -0.27 (7.3%)
20 m 0.48 (23%)** -0.11 (1.2%)
505 test - 0.54 (29.2%)**
Right
5 m 0.57 (32.5%)** -0.04 (0.2%)
10 m 0.49 (24%)** -0.38 (14.4%)*
20 m 0.51 (26%)** -0.19 (3.6%)
505 test - 0.48 (23%)**
Figure 1
[image:19.595.165.440.126.324.2]