ASSESSMENT OF LEFT ATRIAL
FUNCTION BY TISSUE DOPPLER
STRAIN IMAGING IN MITRAL STENOSIS
BEFORE AND AFTER BALLOON MITRAL
VALVOTOMY
A DISSERTATION SUBMITTED IN PARTIAL FULFILLMENT
OF THE REQUIREMENTS FOR DM (BRANCH II,
CARDIOLOGY) EXAMINATION OF THE TAMIL NADU DR.
M.G.R. MEDICAL UNIVERSITY, CHENNAI TO BE HELD IN
BONAFIDE CERTIFICATE
This is to certify that the work presented in this dissertation titled “Assessment of Left Atrial Function by Tissue Doppler Strain Imaging in Mitral Stenosis
Before and After Balloon Mitral Valvotomy” done towards fulfillment of the requirements of the Tamilnadu Dr. MGR Medical University, Chennai, for the DM- (Branch II) (Cardiology) examination to be conducted in July/August 2010, is a bonafide work of the candidate Dr. Alok Sehgal, Senior Post-graduate student in the department of Cardiology, Christian Medical College, Vellore under my guidance & supervision. This dissertation has not been submitted, fully or in part to any other board or university.
Dr. V Jacob Jose
M.D., D.M., FACC, MS, FCCP, FIAE
Professor, Department of Cardiology,
BONAFIDE CERTIFICATE
This is to certify that the work presented in this dissertation titled “Assessment of Left Atrial Function by Tissue Doppler Strain Imaging in Mitral Stenosis
Before and After Balloon Mitral Valvotomy” is a bonafide work of the candidate Dr. Alok Sehgal, Senior Post-graduate student in the department of Cardiology, Christian Medical College, Vellore done towards fulfillment of the requirements of the Tamilnadu Dr. MGR Medical University, Chennai, for the DM- (Branch II) (Cardiology) examination to be conducted in July/August 2010.
Dr. Sunil Thomas Chandy
M.D., D.M., FCSI, FIC(Aus)
Professor and Head,
Department of Cardiology,
Christian Medical College,
DECLARATION
I, Dr Alok Sehgal hereby declare that this dissertation entitled ‘Assessment of Left Atrial Function by Tissue Doppler Strain Imaging in Mitral Stenosis
Before and After Balloon Mitral Valvotomy’ has been prepared by me under the direct supervision and guidance of Dr. V Jacob Jose, Professor, Department of Cardiology, Christian Medical College, Vellore. This is being submitted to Dr M.G.R medical university in partial fulfillment of regulations for the DM (Cardiology) examination to be held in 2010.
This dissertation has not been submitted by me either in part or in full on any previous occasion to any university or institution for the award of any degree or diploma.
Place: Vellore Dr. Alok Sehgal
Postgraduate student
Department of Cardiology Christian Medical College
ACKNOWLEDGEMENT
I thank God Almighty for guiding me through this entire research project.
This dissertation would not have been possible without the support & encouragement from many people.
I am greatly indebted to Dr. V Jacob Jose, Professor, Department of Cardiology, Christian Medical College, Vellore for being instrumental in initiating this research venture, his valuable inputs into the topic & guidance throughout the study.
My special thanks to Dr. Sunil Thomas Chandy, Professor & Head, Department of Cardiology, for the full-fledged support in preparation of this dissertation.
I also express my sincere gratitude to Dr. George Joseph Professor, Department of Cardiology for helping me enroll patients under his unit.
My special thanks toDr. Paul V George and Dr. Oomman K George, Professors, Department of Cardiology for their valuable guidance and input during the study.
I also thank the entire faculty and other colleagues in the Department, whose constant inputs and timely help went a long way in the recruiting the patients and completing the study in time.
I wish to thank Ms. Tunny Sebastian, statistical assistant for her help in statistical analysis
I am very grateful to all the office staff for their help & support.
I express my sincere thanks to all the patients who participated in this study, without whose cooperation this research would not have been possible.
Dr. ALOK SEHGAL
CONTENTS
Abstract
1. Introduction
--- 1
2. Aims and Objectives
--- 3
3. Review of Literature --- 4
4. Materials and Methods --- 44
5. Results --- 51
6. Discussion --- 61
7. Limitations --- 68
8. Conclusion --- 70
9.
Bibliography
---
71
Appendix:
Abbreviation
Study Proforma
ASSESSMENT OF LEFT
ATRIAL FUNCTION BY
TISSUE DOPPLER STRAIN
IMAGING IN MITRAL
STENOSIS BEFORE AND
AFTER BALLOON MITRAL
ABSTRACT
Assessment of Left Atrial Function by Tissue Doppler Strain Imaging in Mitral Stenosis Before And After Balloon Mitral Valvotomy
BACKGROUND: Assessment of regional Left Atrial function may provide insight in atrial electromechanical remodeling. New echocardiographic techniques, such as Tissue Doppler imaging and Strain (rate) imaging allow a non invasive measurement of regional function of the myocardium. Both techniques have been well validated for assessment of regional LV function. Recently these techniques have also been used for the assessment of Left Atrial function.
AIMS: To assess Tissue Doppler Velocities, Strain, Strain rate variation of Left Atrial lateral wall and Interatrial septum in patients with severe Mitral Stenosis and effect of Balloon Mitral Valvotomy on measured parameters.
METHODS: Twenty five symptomatic patients with severe Mitral Stenosis were evaluated by Echo, Doppler studies along with Left Atrial function by Tissue Doppler Imaging for velocity, Strain and Strain Rate measured at mid point of Interatrial septum and Left Atrial Lateral wall. All patients were assessed before and 24 hours after Balloon Mitral Valvotomy. 25 age matched controls were also evaluated.
RESULTS: Pulsed Tissue Doppler velocities, E’ and A’ of Inter Atrial Septum were lower in patients of severe Mitral Stenosis (E’=6.9±3.5 vs 9.8±2.7cm/sec,p=0.002;A’=7.1±2.6 vs 9.2±2.9 cm/sec,p=0.01).Left Atrial Lateral wall velocities were also statistically less in Mitral Stenosis as compared to controls (E’=6.6±1.9 vs 15.9±4.3cm/sec,p<0.001; A’=7.4±2.9 vs 13.1±3.6 cm/sec,p<0.001). Lateral E’ velocity improved significantly after Balloon Mitral Valvotomy (P<0.001). Left atrial Strain at ventricular end systole was lower in patients of Mitral Stenosis when compared to controls as measured at Inter Atrial Septum (11.4% ± 6.3 vs 29.6%±10.5, p<0.001) and Left Atrial lateral wall (18.2%±8.8 vs 28.4%±14.0,p=0.004). IAS systolic strain improves significantly after Balloon Mitral Valvotomy (18.0%±10.6 vs 11.4% ± 6.3,p=0.02) and that measured at Left Atrial lateral wall showed a trend towards improvement (22.8%±10.6 vs 18.2%±8.8,p=0.07).
CONCLUSION: Left Atrial function as assessed by Tissue Doppler velocities and Tissue Doppler derived Strain is lower in patients with severe Mitral Stenosis. Left atrial reservoir function assessed by Strain imaging improves within 24 hours after Balloon Mitral Volvotomy.
INTRODUCTION
Normal Left Atrial function consists of reservoir, conduit and pump function 1,2. Reservoir function occurs during left ventricular systole when the Mitral valve is closed, Left Atrium is relaxed, and the Mitral annulus is temporarily displaced toward the apex 3. Left Atrium acts as a conduit in diastole, when the Mitral leaflets open and allow blood to enter the left ventricle. At the end-diastole, the left atrium contracts, and the pump function occurs 4
In Mitral Stenosis Left Atrial function may be disrupted because of increased Left Atrial afterload. Rheumatic Mitral Stenosis is associated with considerable fusion of the commissures and reduction of mitral valve area and leaflet mobility 5,6. Moreover there is marked increase in Left Atrial dimension and consequently, an impairment of Left Atrial pump function 5. Finally when atrial fibrillation ensures, complete loss of Left Atrial pump function occurs as a result of cessation of atrial systole 7.
Development of Tissue Doppler imaging has enabled to accurately evaluate myocardial properties in a load independent and reproducible manner. Tissue Doppler derived Strain Rate and Strain imaging has the advantage of being not affected by translational movements thus reflects actually the myocardial deformation.10 Its Initial use has been for quantifying regional myocardial deformation in ventricles.11, 12
It has also been used to evaluate Left Atrial function in conditions like Hypertension13, Diabetes14, and post Cardiac Resynchronization Therapy.15 Assessment of left atrial function in severe Mitral Stenosis using Strain and Strain Rate imaging has not been done earlier.
In this study Left Atrial function in patients with severe Mitral Stenosis was assessed by Tissue Doppler, Strain and Strain Rate imaging and compared with normal healthy individuals. Effect of Balloon Mitral Valvotomy on atrial function was also determined.
AIMS AND OBJECTIVES
1. To assess Tissue Doppler Velocities ,Strain and Strain Rate variation of left atrial Lateral Wall and Interatrial Septum in severe Mitral Stenosis
REVIEW OF LITERATURE
Introduction:
Rheumatic Fever and Rheumatic Heart Disease is a significant cause of cardiovascular diseases in the world today. Despite a documented decrease in the incidence of acute Rheumatic Fever and similar documented disease in the prevalence of Rheumatic Heart Disease in developed countries, it remains a major public health issue in countries like India.
Rheumatic Fever and Rheumatic Heart Disease are non-suppurative complications of Group A Streptococcal pharyngitis due to delayed immune response. Although all cardiac valves may be involved by the Rheumatic process, the Mitral Valve is involved most prominently and in virtually all cases.
Epidemiology:
School survey data from our country has reported a prevalence of Rheumatic Heart Disease to be as high as 4.54 per 1000 by Lalchandani et al17 to as low as 0.5 per 1000 by Mishra et al18. The largest school survey conducted till date was from our institute conducted from 2001-2002. A total of more than 2 lac children between the ages of 6-18 years were screened and a prevalence of 0.68 per 1000 was reported by Dr. Jose et al19.
Pathogenesis:
Although the pathogenesis of Acute Rheumatic Fever and
Rheumatic Heart Disease remains somewhat elusive, Acute Rheumatic Fever is clearly the result of an exaggerated immune response to Group A Streptococcal pharyngitis20. The clinical manifestation of the response and its severity in an individual is determined by host genetic susceptibility, the virulence of the infecting organism and a conducive environment.
lymphocytes into the valve tissue. A break in the endothelial continuity of a heart valve by anti streptococcal antibodies expose subendothelial structures and lead to a chain reaction of valvular destruction. Once the leaflet becomes inflamed, revascularization occurs and lymphocytes can infiltrate the valve both through the valvular surface endothelium from without and through the revascularization from within. This perpetuate the cycle of valvular damage leading to valvular scarring
Pathologic Evolution of Mitral Stenosis:
During acute rheumatic fever with carditis, involvement of the Mitral Valve consists of tiny, translucent nodules located along the line of closure of the valve, occasionally also involving subvalvular parts of the chordae. Microscopic sections of these nodules show largely nonspecific proliferation of fibroblasts and macrophages. These translucent vegetations later become opaque and grey, and eventually more of the valve leaflet becomes thickened. Changes within the valve structure involve deposition of fibrin upon the cusps with loss of the normal morphology, hyalinization, and eventually the covering of the leaflets with endothelium. This process may lead to fusion of the valve commissures. Brock 22
1. Commissural type: consisting of fusion of the commissures with little
involvement of cusps or chordae
2. Cuspal type: in which the leaflets are converted into stiff, rigid, leathery
(later calcified) structures; and
3. Chordal type: in which the chordae are fused, thickened, and shortened,
thereby interfering with the mobility of the leaflets.
In addition to the pure forms, combination of these types occurs. Various anatomic forms of mitral stenosis may affect atrioventricular filling in similar manner.
Pathophysiology of Mitral Stenosis:
The normal Mitral Valve orifice is 4 to 6 sq. cm, which essentially creates a common chamber between left atrium and left ventricle in diastole. In very early diastole, there is a brief, small gradient between left atrium and left ventricle, which rapidly dissipates so that pressure in the 2 chambers is equal for most of the filling. As the Mitral orifice narrows in Mitral Stenosis, it curtails free flow of blood from left atrium to left ventricle, and a pressure gradient develops between the 2 chambers.
Since it is primarily the left atrium that generates the force necessary to drive blood across the stenotic Mitral Valve, Mitral Stenosis causes left atrial structural and functional abnormalities. These left atrial abnormalities like left atrial enlargement may lead to various complications associated with Mitral Stenosis like atrial fibrillation, or predisposition to left atrial clot formation. Thus it is essential to understand the importance of Left Atrial function in Mitral Stenosis and methods to assess it.
ASSESSMENT OF LEFT ATRIAL SIZE, ANATOMY AND FUNCTION
Left atrium modulates left ventricular filling through three components, a phase of reservoir or expansion during systole, a conduit phase during diastole and an active contractile component during late diastole. This active contractile component of left atrium has an important role in patients with ventricular dysfunction as a ‘booster pump’ to augment ventricular volume. Augmented left atrial booster function is one of the mechanisms compensating for decreased early filling in patients with reduced left ventricular compliance, whereas a loss of atrial contraction, as a result of atrial fibrillation or ventricular pacing, reduces cardiac output by approximately 15 -20% 24,25.
increasing left atrial booster function through an increase in preload26. An
isolated decrease in left atrial compliance is associated with relative increase in the conduit function of the left atrium. The ability to optimally redistribute left ventricular filling among reservoir, conduit and booster pump functions in a potentially important adaptation that may occur in left atrium in response to changing hemodynamics27.
Causes and Mechanism Of LA Dilatation
In large population based studies, it has been demonstrated that Left Atrial size is an important predictor of cardiovascular outcome28-30. Tsang et al30 recently demonstrated that a larger indexed Left Atrial volume predicted a higher risk of cardiovascular events after adjustment for age, gender and other covariates. Patients with a severely increased left atrium are at the highest risk for the development of cardiovascular events.
enlargement and Atrial Fibrillation has been well recognized28, 32-35. However
whether Atrial Fibrillation causes Left Atrial dilatation or vice versa still remains controversial. Severe studies suggest that Left Atrial enlargement may cause Atrial Fibrillation 28,32,33. In Framingham Heart study32, M-mode derived Left Atrial size was an independent risk factor for development of Atrial Fibrillation. Tsang et al28 demonstrated that Left Atrial volume was a strong predictor of Atrial
Fibrillation, incremental to clinical risk factor. However other studies have revealed that Left Atrial enlargement may be the consequence of Atrial Fibrillation 34, 35.
Importance Of Left Atrial Size/Anatomy Assessment
Assessment of Left Atrial size is important since it has been shown to provide strong prognostic information. The incremental value of Left Atrial size over conventional risk factors has been demonstrated in several studies 30,36-38. In
Framingham Heart study38 it was demonstrated that Left Atrial enlargement was significant predictor of death in both men and women.
patients with lone Atrial Fibrillation, Left Atrial volume was a strong predictor of adverse events independent of age and clinical risk factors 37.
MULTIMODILITY IMAGING OF LEFT ATRIUM
Echocardiography:
For assessment of Left Atrial size various echocardiography techniques are available, including transthoracic, transesophageal and intracardiac echocardiography. Transthoracic echocardiography is most commonly used in daily clinical practice to assess Left Atrial size.
Transthoracic echocardiography:
Various methods for assessment of Left Atrial volume with 2D echo are available, including the cubical method, area- length method, ellipsoid method and modified Simpson’s rule (figure 1). In an prospective study including 621 patients,43 it was demonstrated that the biplane area-length method and Simpson’s method compared closely, whereas ellipsoid method systematically under estimated Left Atrial volume
Figure 1:Measurement of Left Atrial volumes with transthoracic echocardiography using the modified biplane Simpson’s rule. The maximum Left Atrial volume is assessed during ventricular systole in the apical two-chamber (left panel) and apical four-chamber (right panel) views. Maximal Left Atrial volume was 46 ml; minimal Left Atrial volume was 22 ml, resulting in a Left Atrial ejection fraction of 53%.
Ref: Reproduced from Heart 2007; 93:146244
variability as compared to two dimensional echocardiography. However there still remain some technical limitations.
Figure 2: Real-time three-dimensional echocardiogram for the assessment of Left Atrial volumes. Panels A to C represent the coronal, sagittal and transverse planes, respectively. With the use of a five-point tracing algorithm, Left Atrial volumes can be obtained throughout the cardiac cycle, represented by the ‘‘shell’’ in panel D. In this example, Left Atrial maximum volume was 53 ml
Transesophageal echocardiography:
Transoesophageal echocardiography provides good views on the Left Atrium and appendage. However, visualizing the complete left atrium to determine its size with transeophageal echocardiography may be hampered by the close proximity of the probe to the Left Atrium. As a result, measurements of Left Atrial size with transesophageal echocardiography have not been standardized.
Transoesophageal echocardiography is considered the procedure of choice for assessment of thrombi in the Left Atrial cavity or atrial appendage. In addition, transesophageal echocardiography is also helpful in assessment of Left Atrial appendage emptying velocities, which are correlated with thrombus formation (velocities <20cm/sec) with maintenance of sinus rhythm after cardioversion (velocity >40cm/sec) 48.
Intracardiac Echocardiography:
Intracardiac echocardiography is only used during interventional procedure, such as percutaneous closure of atrial septal defects and catheter ablation procedures. Therefore no standardized size and volume are available. During these interventional procedures, intracardiac echocardiography cans accurately visualized LA anatomy and related structures 49.
measurement of Mitral E wave velocity and Left Atrial appendage emptying velocity. Although Intracardiac echocardiography is limited by monoplane character and the lack of standardized measurements of Left Atrial size, it is a valuable tool for interventional procedures.
Multislice CT:
The application of multi-slice CT (MSCT) in cardiac imaging has rapidly expanded in the past few years. Since MSCT has an excellent spatial & temporal resolution, it can accurately quantify Left Atrial volumes by using the modified Simpson’s method 51. However because of the radiation exposure and the use of contrast agents, MSCT is not routinely used for the assessment of Left Atrial size.
Magnetic resonance imaging:
ASSESSMENT OF REGIONAL LA FUNCTION:
Regional Left Atrial function is not routinely assessed, and therefore no standardized parameters are available. This can be partly explained by the fact that non-invasive evaluation of regional Left Atrial function may be hampered by the relatively thin Left Atrial walls. However, assessment of regional Left Atrial function may provide more insight in atrial electromechanical remodeling and may be helpful in management of Atrial Fibrillation with surgical or catheter ablation. New echocardiographic techniques, such as Tissue Doppler imaging and Strain (rate) imaging, allow non invasive measurement of regional function of the myocardium. Tissue Doppler imaging quantifies regional tissue velocities of the myocardium. Strain & Strain rate represent local tissue deformation and the rate (speed) of local deformation respectively 52. Both techniques have been well validated for the assessment of regional left ventricular function. Several studies have applied these new techniques to assess Left Atrial function 53-57
parameters of regional Left Atrial function with conventional parameters, such as Mitral inflow A velocity and Left Atrial volumes, needs further investigations. A limitation of Tissue Doppler imaging for evaluation of regional Left Atrial function is the angle depending of the technique.
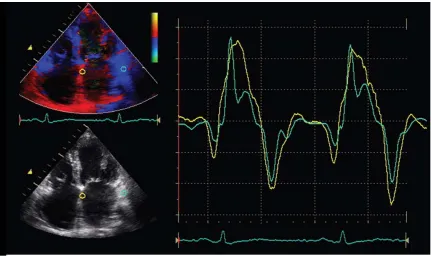
[image:25.612.91.522.208.465.2]
Figure 3:Color-coded tissue Doppler imaging in the apical four-chamber view for the assessment of regional Left Atrial function. The samples are placed in the basal atrial septum (yellow curve) and the basal atrial lateral wall (green curve). From the myocardial velocity curves, peak systolic and diastolic velocities can be assessed. Early diastolic filling is indicated by E’ and late diastolic filling is indicated by A’.
Ref: Reproduced from Heart 2007; 93:1462 44
therefore requires careful interpretation. Several studies have demonstrated the value of regional atrial Strain in the analysis of patients with Atrial Fibrillation undergoing cardioversion 56,57. Di Salvo et al 56 studied 65 patients with Atrial Fibrillation and performed Tissue Doppler imaging of the standard apical images of the Left Atrium. It was noticed that all Tissue Doppler imaging derived parameters of Left Atrium, including Tissue Velocities, Strain and Strain Rate were significantly reduced in patients with Atrial Fibrillation, compared with healthy controls. The assessment of regional Left Atrial function by Tissue Doppler imaging or Strain imaging may be of value in the clinical follow up of patients with Atrial Fibrillation undergoing catheter ablation or cardioversion. However more studies are needed to appreciate the value of regional Left Atrial Strain and its role to guide use of medications in patients with Atrial Fibrillation.
Left atrial pressure – area relationship
In physiological investigations, the pressure area relation is the most accurate and representative index of left atrial hemodynamic status. Real time two- dimensional echocardiographic imaging with automated boundary detection to estimate left atrial area changes has been applied. To obtain left atrial pressure, a catheter tipped micromanometer is introduced retrogradely into the left atrium using streerable cardiac catheter.
relationship as well as the left atrial chamber stiffness constant can be calculated.
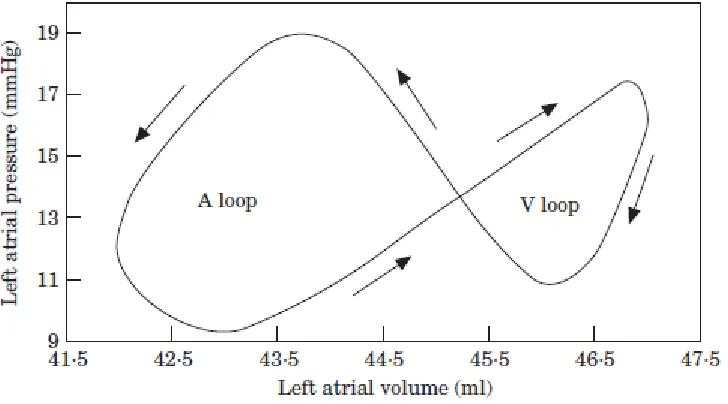
Figure 6: The left atrial pressure–volume relationship is composed of two loops: the A loop, expressing the left atrial pump function and the V loop, expressing the reservoir function of the left atrium. During the filling period, the curve is directed upward and to the right, and after maximal pressure and volume of the filling period have been reached, the curve turns clockwise and downward corresponding to the passive emptying, and subsequently, active emptying phases
Ref: Eur Heart J, Vol. 22, issue 1, January 2001; 26 58
function is impaired in patients with heart failure and in those with atrial fibrillation and may be acutely improved with inotropic agents in both normal and diseased atria59.
Left atrial elastance:
Contractile function of the ex-vivo, isolated left atrium has been described by a time – varying elastance (Et.), although this atrial chamber property has not been shown in vivo. In the intact heart, left atrial contraction may be approximated by time varying elastance with time dependant changes in Et .Left atrial systolic pressure–volume relationship using either the non-isochronal maximum pressure to volume ratio or end systole may be useful as an estimate of Emax. They are highly linear and sensitive to calcium induced changes in inotropic state and may be useful in identifying left atrial chamber adaptation to chronic haemodynamic loads 60.
STRAIN AND STRAIN RATE IMAGING
myocardial function would define wall deformation characteristics in three dimensions and in real time. Three dimensional (3D) local wall deformation can be acquired by Magnetic Resonance Imaging 65,66, while Computed Tomography and Gated Single Photon Emission Computed Tomography/ Positron Emission Tomography (SPECT/PET) imaging enable 3D acquisition of wall thickening & thinning 67,68. However, none of these are real time techniques and the current
temporal resolution used in clinical practice does not resolve all myocardial mechanical events. In contrast real time local thickening /thinning parameters can be obtained from ultrasound by grey –scale M mode recording, but only in one dimension and for limited number of regions of the myocardium 69
gradients in myocardial velocities. From Strain Rate curves, local strain (i.e. regional deformation curves) can be extracted, resulting in the concept of regional Strain imaging. Concept of Strain and Strain Rate imaging as measure of myocardial property was first introduced by Mirsky and Parmley et al 71
STRAIN
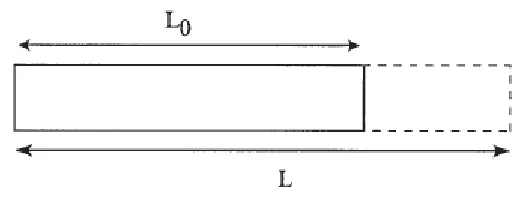
Strain is defined as deformation of an object, normalized to its original shape. In an one dimensional object (i.e. an infinitesimally thin bar), the only possible deformation of the object is lengthening or shortening. This is illustrated in figure 5.
[image:30.612.165.427.360.461.2]
Figure 5: Deformation (strain) of a one-dimensional object is limited to lengthening or shortening. Strain is the deformation of an object relative to its original shape.
Ref: Eur J Echocardiography, 2000; 1:155 74
The relative amount of deformation is defined as Strain. Strain can thus be written as
ε = L — Lo
……1 74Lo
(often expressed in percent). By convention, lengthening is represented as a positive valve for strain, while shortening is represented by a negative value.
For a 2 dimensional object, the deformation is not limited to lengthening or shortening in one direction. It can lengthen or shorten along the X or Y axes (figure 6) and can distort by the relative displacement of the upper to the lower border or the right border to the left border.
[image:31.612.147.444.266.485.2]
Figure 6: For a 2D object, deformation, i.e. strain, can be described by four strain components: two normal strains [(1) and (2)] and two shear strain components [(3) and (4)]. The shear strains are also completely characterized by the angles өxand өy.
Ref: Eur J Echocardiography, 2000; 1:155 74
The most general situation is that of a 3D object which deforms (as in a myocardial segment). In this case, there are 3 normal strains (along the x, y axis z axis) and six shear strains (xy, xz, yz, zx and zy). Some of these strain components are in figure 7. Defining these nine strain components defines the deformation of a 3D object completely.
[image:32.612.164.441.254.531.2]
Figure 7: Deformation of a 3D object is described by three normal and six shear strain
components. One normal component (a) and three shear components [εyx (b), εzx (c) and εxy (d)] are illustrated here
Ref: Eur J Echocardiography, 2000; 1:157 74
STRAIN RATE
Strain Rate is the speed at which deformation occurs. It is represented by symbol
ε
’ and has the unit per sec. In most general situation, strain does not
Since a 3D object has nine strain components all occurring at a specific rate, nine Strain Rates can be defined
RELATIONSHIP BETWEEN STRAIN AND WALL THICKENING
For the heart wall thickening is defined as WT= TES – TED ………2 74
TED
with TES and TED, end systolic and end diastolic wall thickness respectively. This
expression is clearly identical to equation 1. In other wards wall thickening is nothing but myocardial strain measured in one dimension. Rate at which the myocardial wall thickens and thins is nothing but the one dimensional strain rate.
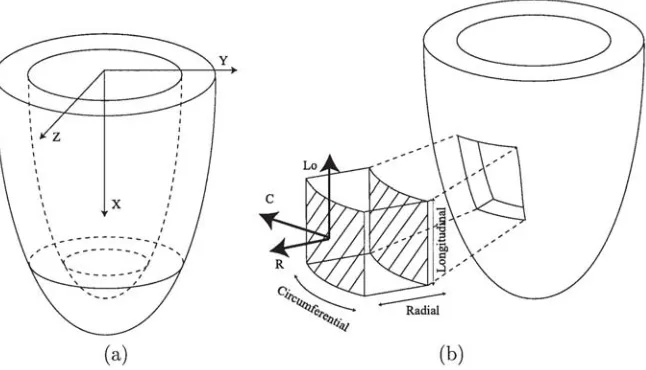
CO- ORDINATE SYSTEMS
In order to uniquely define different positions in space, a 3D co-ordinate system must be constructed. This is defined to be a set of three different, mutually non co-planar unit vectors having the same origin. The position of any point within the concomitant 3D space can be expressed relative to these unit vectors. In this way, every single spatial point within the co-ordinate system can be ascribed a unique co-ordinate.
The Heart Coordinate system:
Rather than defining a global Cartesian co-ordinate system in which the whole heart or left ventricle is described (figure 8), a local heart co-ordinate system can be defined. For each point to be interrogated in any myocardial wall, three mutually perpendicular axes can be defined.
[image:34.612.135.458.215.400.2]
Figure 8: Either a global Cartesian coordinate system (a) or a local heart coordinate system (b) can be defined. However, the latter coordinate system facilitates the physical interpretation of strain measurements of the heart
Ref: Eur J Echocardiography, 2000; 1:158 74
The radial (R) axis: Perpendicular to the epicardium, pointing outwards, that is away from the cavity.
The longitudinal (La) axis: Perpendicular to the radial axis, that is, tangent to the epicardium, and pointing towards the base of the ventricle, away from the apex
circumferential axis is directed anti clockwise around the classical echo short axis image. This local co-ordinate system is illustrated in figure 8.
MEASUREMENT OF CARDIAC STRAIN
Since the beginning of the 1980 methods have been proposed to estimate strain by means of ultrasound 73-76. Originally, most methods were developed for static organs such as liver, breast, kidney or prostate. In these organs, stiffer tissue will deform less than more elastic tissues under the influence of an identical force. Thus in this situation Strain estimation can be directly related to the elastic properties of the tissue. For this reason technique has been termed as elastography.
by post processing. One major criticism of velocity, Strain Rate and Strain imaging has been that these techniques are angle dependent, since only the axial component of the true 3D velocity vector or deformation is measured. This problem can partially be avoided by making sure that insonation is either perpendicular or parallel to the myocardial wall during acquisition of the data sets.
Thus taking together Stain Rate and Strain imaging are potentially new tools for the quantification of regional myocardial function. However, clinical relevance of the technique is still under evaluation.
MEASUREMENT OF STRAIN AND STRAIN RATE BY ECHOCARDIOGRAPHY
The echocardiographic measurement of myocardial strain offers a series of regional and global parameters that may be useful is assessment of systolic and diastolic function. Myocardial strain may be measured using a variety of echocardiographic techniques. Although M-mode techniques provide both accurate temporal and accurate spatial resolution, and may therefore be used to measure strain in single dimension, the current era of myocardial strain measurement began with the measurement of strain rate from comparison of adjacent tissue velocities by Heimdal et al80.
Tissue Doppler Based Strain – Technical Aspects
pixed represents the velocity relative to the transducer. These data may be expressed graphically as the velocity of the myocardium relative to time (on the x axis).
Rather than examining the motion of a segment relative to the transducer, which is susceptible to tethering to adjacent tissue, myocardial motion may be measured relative to the adjacent myocardium. The instantaneous gradient of velocity along a sample length may be quantified by performing a regression calculation between the velocity data from adjacent sites along the scan line, and these instantaneous data may then be combined to generate a Strain rate curve11,74
However velocity regression technique has a few potential pits falls. First, the comparison of adjacent velocities is exquisitely sensitive to signal noise, and the quality of Strain Rate curves may vary depending on the care used in obtaining the underlying velocity data. Optimizing the velocity signal should include avoidance of reverberation artifact and ensuing adequate frame rate (>100 frames/sec). Improvements to the velocity signal by use of harmonic imaging as well as both temporal and spatial averaging are important in optimizing the Strain Rate signal, although this comes at the cost of reducing spatial resolution 81
adjacent Left Ventricular blood pool velocities, which are an important source of noise. In turn this will compromise the Strain rate signals. Tracking the sample throughout the cardiac cycle is also important to ensure that sample remains within the myocardium.
Third, like all Doppler techniques, Tissue Velocity based Strain is sensitive to alignment.
Fourth, the derivation of data along the scan line means that the velocity regression technique is unidirectional. Even when tracking is used to try to maintain the sample volume within segment of myocardium, it needs to be kept in mind that myocardium undergoes a wringing, torsional motion so that the sample will inevitably move out of the scanning field in the course of cardiac cycle. This motion has little effect on systolic measurements, because peak Strain Rate occurs early in systole, but it may become important in the measurement of diastolic phenomenon.
Finally, angle changes during the cardiac cycle and with respiratory movement may contribute to drifting of the Strain curve.
These technical challenges of tissue velocity, based strain rate measurements can be avoided by careful acquisition.
POTENTIAL CLINICAL APPLICATIONS OF STRAIN RATE IMAGING
Left Ventricular Function
From animal experiments, the regional Strain values have been validated to correlate with those obtained from sonomicrometry in acute coronary ischemia82. In canine models, reduced systolic strain appears earlier and
therefore is more sensitive than Doppler Tissue velocity abnormality and semi- quantitative visual wall motion score in acute ischemia84. Moreover, the radial peak systolic strain of myocardium correlates linearly with M-mode ejection fraction calculated with the Teichholz equation85.
The longitudinal systolic strain rate has been shown to correlate linearly with maximal value of the first Left Ventricular pressure time derivative and also peak elastance, which are both global measures of Left Ventricular systolic function and contractility 86,87. Furthermore, in both normal human and stunned porcine myocardium, the dobutamine induced increase in systolic strain rate preceded the increase in strain itself and also in Left Ventricular systolic wall thickening.87,88.
cardiomyopathy, suggesting regional Strain Rate measurement reflects local segmental contractility and is free form adjacent tissue tethering or overall parallel motion of the heart 90.
Stress Echo
Responses of Strain and Strain Rate to stress have been extensively studied in animal models. In normal myocardium, increasing doses of dobutamine are associated with increasing Strain Rate throughout the study, but in contrast, myocardial strain initially increases then decreases as heart rate increases91. These changes have been used to argue that Strain Rate is the preferred parameter for the assessment of myocardial function during stress- although they do not account for the greater technical challenges of measuring Strain Rate during stress, nor the degree of differences that occurred in Strain measurements.
Valvular Heart Disease
Measurement of myocardial function may be important in understanding the physiological impact of valvular heart disease. Studies in percutaneous heart valve replacement have shown dramatic improvements of Left Ventricular Strain Rate and Strain93. Subclinical myocardial dysfunction may be identified as a potential guide to the timing of surgical intervention in regurgitant valve lesions 94.
Right Ventricular Function
Measurement of Right Ventricular Strain and Strain Rate, although feasible95 and certainly of potential interest in the evaluation of congenital heart diseases, remain challenging. The tissue Doppler approach to radial strain measurement is difficult because the Right Ventricular wall is too thin to permit an adequate regression distance and the place of 2D Strain is undefined in this respect. Strain assessment of septum is complicated because of Right and Left Ventricular components .So the long axis assessment of Right Ventricular function is best performed in the free wall, using apical imaging.
REGIONAL LEFT ATRIAL FUNCTION BY TISSUE DOPPLER VELOCITY AND
STRAIN IMAGING
of global and regional Left Ventricular function and have also been applied to the evaluation of regional Left Atrial function. From an electromechanical perspective, echocardiographic parameters that assess Left Atrial mechanical function may provide a greater understanding of atrial performance and its relationship with ventricular function.
Assessment of Left Atrial and Appendage Function by Tissue Doppler
Imaging.
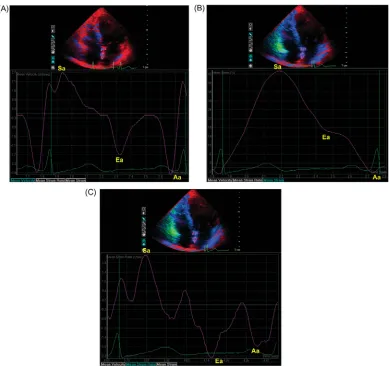
The atrial myocardial velocity curve consists of three major deflections, ventricular systolic (Sa), early ventricular diastolic (Ea), and late ventricular diastolic (atrial contraction Aa) waves (figure 9).
[image:43.612.98.488.150.516.2]
Figure 9: Assessment of regional atrial myocardial function by tissue Doppler imaging. The sample volume was placed at the mid-level of inter-atrial septum on color tissue Doppler imaging image to reconstitute the myocardial velocity (A), strain (B), and strain rate (C) curves. They consist of ventricular systolic (Sa-wave), ventricular early diastolic (Ea-wave), and late diastolic (atrial contraction, Aa-wave) components
Ref: Europace (2008) 10, iii63 100
passive expansion and emptying components of the Left Atrial function 55,56,99
The feasibility and reproducibility of Tissue Doppler parameters, in particular the peak velocity (VAa) and peak Strain Rate (SRAa) of the active atrial contraction,
have been demonstrated in previous studies, in which both the inter and intra observer variability for measuring the VAa were reported to be within 10% 54,96,99.
Although the velocity data could be easily obtained in nearly all patients, strain rate measurements were only feasible in about 95% of patients due to relatively higher noise signal ratio98.
Left atrial appendage (LAA) is highly contractile structure with a pattern of contractions totally different from that of the Left Atrial main body. It is more complaint and therefore plays an important role in Left Atrial reservoir function, especially during increase in LA pressure and volume101. Transeophageal echocardiography (TEE) provides essential information about LAA structure and function. In addition to the LAA size, emptying and filling velocities101,102 a characteristic triphasic Tissue Doppler profile can be obtained readily at the tip, the septal or lateral wall of the LAA by TEE.
Atrial Pump Function and Electromechanical Coupling in Healthy Subjects
In healthy subjects, the right atrial (RA) free wall has been found to have the highest VAa or SRAa 96,97. Zhang et al studied 131 healthy adults aged from
atrial velocities at different sites was attributed to an atrial free wall motion higher than that of bounded Inter atrial septum. Furthermore, the larger pectinate muscle in the Right Atrium can perhaps generate a more pronounced and sustained longitudinal movement in the relatively low pressure system of the right ventricle. In the same study when older (> 60 y) and younger (<60 yr) age groups were compared VAa was elevated in both Right and Left Atrial free wall in the
older age group. Thomas et al 53 also illustrated the effect of age on atrial pump function in their study of 92 healthy subjects in that the older age group had a significantly higher VAa. With aging there is impairment of Left Ventricular myocardial relaxation and early filling, with subsequent increase in the Left Atrial pressure and volume. By the Franks- Starling law, over stretching the atrial myocardium results in augmentation of Left Atrial contractility 53,103-105. The results of direct measurement of the Left Atrial mechanical function by Tissue Doppler Imaging have corroborated previous observation by Doppler echocardiography that, with aging, there is shift in the relative contribution of the different haemodynamic phases of the Left Atrial function in the Left Ventricular filling, from a reduction of the passive to a compensatory increase in active emptying function 106
Left Atrial Function by Tissue Doppler and Strain imaging in Atrial
Fibrillation
general population increasing to 5% in those > 65 years old107. With the loss of
atrial booster pump function, the Left Atrial –Left Ventricular pressure gradient during early Left Ventricular filling is enhanced by elevation of the Left Atrial pressure to maintain stroke volume108. Thus, a reduction in both Left Atrial compliance and volume has been observed with the onset of Atrial Fibrillation that further decreases cardiac function and increased the risks of thrombo-embolism.
Fibrillation for at least 3 months56. All measure myocardial properties were
significantly reduced in patients with Atrial Fibrillation when compared with normal subjects. Furthermore the Strain Rate during ventricular systole from the individual Left Atrial wall was much lower in patients who had more than one recurrent Atrial Fibrillation episode with a 9 month follow-up period after cardioversion than those in sinus rhythm. These results may reflect the decreased compliance of Left Atrial wall in patients with Atrial Fibrillation, which is in agreement with several studies demonstrating that during Atrial Fibrillation the reservoir and conduit function are impaired and the booster pump function is lost.
Atrial stunning is characterized by reduced atrial mechanical function after restoration of sinus rhythm from Atrial Fibrillation which may last several weeks with associated increased thromboembolic risk110. Thomas et al57 demonstrated a gradual recovery of atrial pump function after DC cardioversion, by use of strain imaging in 37 patients with chronic Atrial Fibrillation who had a restored sinus rhythm.
Left Atrial Function by Tissue Doppler and Strain imaging In Ischemic Heart
Disease
Atrial contractile dysfunction appears early in ischemic heart disease irrespective of previous myocardial infarction, co-existing systolic dysfunction or severity of diastolic dysfunction. Yu et al96 found that the VAa measured at mid level of the Interatrial septum and the Left Atrial lateral wall in the apical four chamber view were drastically reduced in 118 patients with ischemic heart disease when compared with 100 normal subjects . A poor Left Ventricular ejection fraction and the presence of a restrictive Left ventricular filling pattern were the most important determinants of Left Atrial contractile dysfunction in ischemic heart disease. The dramatic reduction of Left Atrial VAa in the presence
Left Atrial Function Tissue Doppler and Strain Imaging in Advanced Heart
Failure and Cardiac Resynchronization Therapy
The atria adapt to changes in ventricular filling commonly observed in congestive heart failure by adjusting the relative proportion of reservoir, conduit and pump components in order to maintain the ventricular stroke volume. However depression of atrial pump performance will eventually occur as the heart failure progresses, despite increased atrial preload due to myopathic process and/or over distention of the atrial fibers111. Thus, in chronic heart failure, both the velocity and Strain during Left Atrial contraction are attenuated. However, the Left Atrial mechanical function can be modified by heart failure treatment, such as cardiac resynchronization therapy (CRT), which is of proven benefit to the advanced heart failure patients with prolonged QRS duration. In this regard, Tissue Doppler Imaging helps investigate the improvement in regional Left Atrial mechanical function after CRT .Yu et al15 examined atrial function and
Left Atrial Function in Mitral Stenosis
Due to inflow obstruction, the atrial booster pump contributes less to Left Ventricular filling in Mitral Stenosis even during sinus rhythm, despite a proportional increase, with increasing severity, in the Left Atrial pre load 112. Left atrial function in Mitral Stenosis has not been studied too extensively in the past. Sato S et al 113 demonstrated that the impaired atrial reservoir and pump function
MATERIALS AND METHODS
Study Design:
This was a prospective descriptive trial performed over 12 months from Dec 2008 to Dec 2009
Setting:
CMC Vellore is a 2000 bedded Tertiary care teaching hospital. Patients were recruited from outpatient department and those admitted with severe Mitral Stenosis. Twenty five patients with severe Mitral Stenosis in sinus rhythm and 25 ages matched Controls were enrolled in the study.
Subjects:
Inclusion Criteria
Control Group: Patients with no cardiovascular risks factors and not on any cardiac medications.
Exclusion Criteria
1. Patients of Mitral Stenosis not suitable for Balloon Mitral Valvotomy 2. Patients with Atrial Fibrillation
3. Patients with more than mild Aortic or Mitral regurgitation (pre or post Balloon Mitral Valvotomy)
4. Patients undergoing Balloon Mitral Valvotomy as an emergency procedure 5. Patients who had undergone Closed Mitral Valvotomy or Balloon Mitral
Valvotomy or any form of cardiac surgery in the past.
6. Patients with Coronary Artery Disease, Hypertension & Diabetes Mellitus 7. Patients with poor echo windows or incomplete study..
Clinical Assessment
All patients were subjected to thorough history taking, full clinical examination, 12 lead ECG, full 2D, M mode & Doppler transthoracic echocardiographic study in standard precordial views. Left Atrial regional function and deformation properties were studied using Tissue Doppler Velocities, Strain and Strain Rate imaging. All details were plotted in tables and statistically studied
Echocardiographic And Doppler Studies
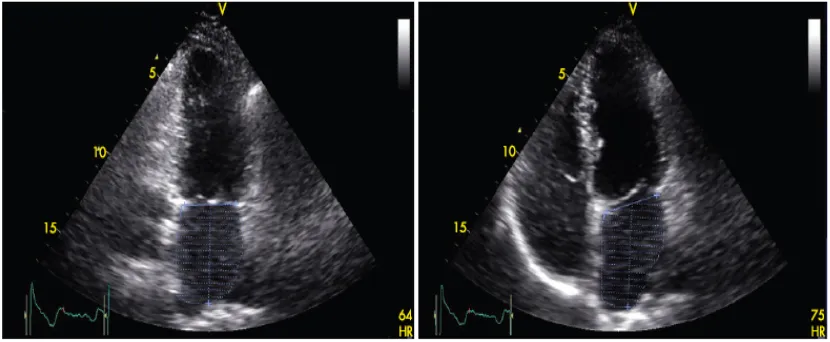
recorded using the leading edge technique and in accordance with the recommendations of American Society of Echocardiography117,118. Following parameters were obtained from the M mode guided pictures in parasternal long axis view ; Left Atrial dimensions in mm ,Left Ventricular internal dimensions in both systole and diastole (LVIDDs and LVIDDd) in mm, thickness of interventricular septum (IVSd) and posterior wall (PWTd) at end diastole in mm. LVEF was calculated by modified Simpson’s method117. MVA was calculated by planimetry and Pressure Half Time119. Color flow Doppler was used to detect presence of valvular regurgitation.
Left atrial volume and size was measured by 2D echocardiogram in apical 4 chamber view and Ejection Fraction was calculated using modified Simpson’s method. Maximum Left Atrial volume was measured during ventricular systole when mitral valve was closed and smallest Left Atrial volume during ventricular late diastole with pulmonary veins and mitral apparatus excluded from volume measurement 31 (see figure10)
Pulse Waved Tissue Doppler Imaging
Tissue Doppler imaging was performed in apical four chamber view by placing the sample volume at mid point of Interatrial Septum and Lateral left atrial wall. Peak early diastolic velocity (E’) and late diastolic velocity (A’) were recorded. A high frame rate (>110 frame/sec) was selected for the study. Special case was taken for correct alignment of the Doppler beam parallel to Interatrial septum. Doppler measurements were obtained during end expiration. An appropriate velocity scale was chosen to avoid data aliasing.
Atrial Strain and Strain Rate Imaging
Color Doppler myocardial images were acquired using a narrow sector (usually < 30 degree) to attain a frame rate >110 frames/sec. Attempts were made to align the atrial wall parallel to the Doppler beam. Because of the thin atrial walls, a narrow (10X2.5mm) sample volume was selected57. Images were acquired
Figure13 a: Strain curve with sample volume at mid point of inter atrial septum
Figure 14a: Strain curve with sample volume at mid point of lateral LA wall
Balloon Mitral Valvotomy and Follow Up
All patients of Mitral Stenosis underwent Balloon Mitral Valvotomy through trans-septal single balloon technique. Balloon Mitral Valvotomy was considered successful when post procedure echo revealed mitral valve area > 1.5cm2 by echo with less then 2+ Mitral Regurgitation120. Tissue Doppler velocities, Strain and Strain Rate parameters were measured 24 hours after Balloon Mitral Valvotomy in manner similar to pre procedure evaluation.
Statistical Analysis: All statistical analysis were performed by SPSS for Windows 16.0 (Chicago, USA) and RGui 2.8.0. Numerical results were expressed as Mean ± SD. Comparisons between Cases and Controls were done using the student’s t test and Mann- Whitney U test for independent samples. Pre and Post Balloon Mitral Valvotomy analysis were done using the Paired Sample t test and Wilcoxon Signed Rank test. The level of significance is 5% (p value< 0.05). Pearson Correlation coefficient is used to find the correlation between the two variables.
RESULTS
During the period of 1 year, 50 patients were included in the study of which 25 were of severe Mitral Stenosis (2D MVA= 0.87 ± 0.14 cm2) and 25 were
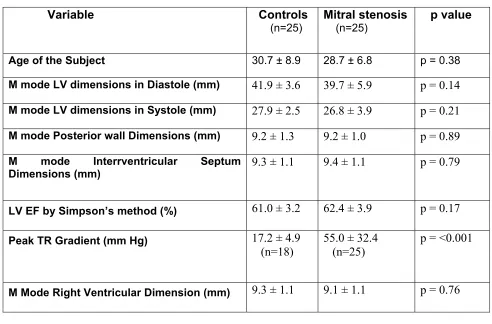
[image:59.612.60.552.318.642.2]age matched Controls (28.7 ± 6.8 vs 30.7 ± 8.9 years; p= 0.34: MS vs Control). Left ventricular systolic and diastolic dimensions and Left Ventricular Ejection Fraction were comparable in both the groups (Table 1).
Table 1: Baseline Characteristics
Variable Controls
(n=25) Mitral stenosis (n=25) p value
Age of the Subject 30.7 ± 8.9 28.7 ± 6.8 p = 0.38
M mode LV dimensions in Diastole (mm) 41.9 ± 3.6 39.7 ± 5.9 p = 0.14 M mode LV dimensions in Systole (mm) 27.9 ± 2.5 26.8 ± 3.9 p = 0.21 M mode Posterior wall Dimensions (mm) 9.2 ± 1.3 9.2 ± 1.0 p = 0.89 M mode Interrventricular Septum
Dimensions (mm) 9.3 ± 1.1 9.4 ± 1.1 p = 0.79
LV EF by Simpson’s method (%) 61.0 ± 3.2 62.4 ± 3.9 p = 0.17 Peak TR Gradient (mm Hg) 17.2 ± 4.9
(n=18) 55.0 ± 32.4 (n=25) p = <0.001
M Mode Right Ventricular Dimension (mm) 9.3 ± 1.1 9.1 ± 1.1 p = 0.76
Various predetermined 2D Left Atrial parameters in Mitral Stenosis patients were compared with healthy Controls. As shown in Table 2, M mode LA dimensions, maximum LA size in A4C, maximum and minimum LA volumes, were significantly higher in patients with mitral stenosis. LA ejection fraction as calculated by modified Simpson’s method was lower in Mitral Stenosis patients when compared to controls (23.4 ± 6.7 % vs 58.3 ± 6.6 %;p<0.001 ;MS vs Control).
Table 2: Left Atrial Echo parameters
Variable Controls (n=25)
Mitral Stenosis (n=25)
p value
M Mode Left Atrial Dimensions (mm) 29.1 ± 4.2 42.4 ± 7.6 p < 0.001 Maximum LA size in A4C (mm) 45.6 ± 4.7 64.4 ± 8.1 p < 0.001 2 D Left Atrial Maximum Volume (ml) 35.4 ±
10.7
90.6 ± 31.1 p < 0.001 2 D Left Atrial Maximum Volume (ml) 14.8 ± 4.9 69.9 ± 27.3 p < 0.001 Left Atrial EF by Simpson’s Method (%) 58.3 ± 6.6 23.4 ± 6.7 p < 0.001
Table 3 : TDI parameters
Variable Controls (n=25)
Mitral Stenosis (n=25)
p value
IAS Pulse Wave E' Velocity (cm/sec) 9.8 ± 2.7 6.9 ± 3.5 p = 0.002 IAS Pulse Wave A' Velocity (cm/sec) 9.2 ± 2.9 7.1 ± 2.6 p = 0.01 Left Atrial Lateral Wall Pulse Wave E'
Velocity (cm/sec)
15.9 ± 4.3 6.6 ± 1.9 p <0.001
Left Atrial Lateral Wall Pulse Wave A' Velocity (cm/sec)
13.1 ± 3.6 7.4 ± 2.9 p <0.001
Table 4: Strain and Strain Rate parameters in MS as compared to controls
Variable Controls
(n=25)
Mitral Stenosis (n=25)
p value
IAS Strain at Ventricular End Systole (%) 29.6 ± 10.5 11.4 ± 6.3 p<0.001 IAS Strain at Ventricular Late Diastole (%) -0.04 ± 0.41 0.05 ± 0.33 p = 0.36 IAS Strain Rate at Ventricular End Systole (per sec) -0.17 ± 1.01 0.15 ± 0.85 p = 0.24 IAS Strain Rate at Ventricular Late Diastole (per sec) 0.24 ± 0.55 -0.16 ± 0.35 p= 0.004 Left Atrial Lateral Wall Strain at Ventricular End
Systole (%)
28.4 ± 14.0 18.2 ± 8.8 p= 0.004
Left Atrial Lateral Wall Strain at Ventricular Late Diastole (%)
0.07 ± 0.61 0.01 ± 0.56 p = 0.7
Left Atrial Lateral Wall Strain Rate at Ventricular End Systole (per sec)
0.34 ± 0.71 0.15 ± 0.60 p = 0.3
Left Atrial Lateral Wall Strain Rate at Ventricular Late Diastole (per sec)
0.13 ± 0.4 -0.12 ± 0.49 p=0.055
Table 5: Echo/Doppler parameters Pre and Post BMV
Variable Pre BMV
( n=25)
Post BMV
( n=25)
p value
M Mode Left Atrial Dimensions (mm) 42.4 ± 7.6 38.0 ± 6.6 p=0.001
Maximum LA Size in A4C (mm) 64.4±8.1 62.3± 7.3 p=0.064
2 D Left Atrial Maximum Volume (ml) 90.6± 31.1 70.9±26.7 p<0.001 2 D Left Atrial Minimum Volume (ml) 69.8±27.3 48.2±19.8 p<0.001 Left Atrial EF by Simpson’s Method (%) 23.4±6.7 32.9±10.0 p<0.001 Mitral Valve Area by 2D (cm2) 0.87±0.14 1.94±0.25 p<0.001 Mitral Valve Area by Doppler (cm2) 0.84±0.15 1.89±0.23 p<0.001 Doppler Peak TR Gradient (mmHg) 55.0±34.4 31.7±15.4 p<0.001
[image:63.612.85.553.498.698.2]Post BMV Tissue Doppler velocity remained unchanged as measured at interatrial septum however E’ velocity at lateral wall improved significantly (6.6 ± 1.9 vs 8.8 ± 2.1; p<0.001:Pre BMV vs Post BMV) as shown in Table 6 and Figure 15a, 15b.
Table 6: Tissue Doppler Velocities Pre and Post BMV
Variables Pre BMV (n=25)
Post BMV (n=25)
p value
IAS Pulse wave E' Velocity (cm/sec) 6.9 ± 3.5 6.7 ± 2.8 p=0.81 IAS Pulse wave A' Velocity (cm/sec) 7.1 ± 2.6 6.8 ± 2.4 p=0.49 Left Atrial Lateral Wall Pulse Wave E'
Velocity (cm/sec)
6.6 ± 1.9 8.8 ± 2.1 p<0.001
Left Atrial Lateral Wall Pulse Wave A' Velocity (cm/sec)
Figure 15a: E’ & A’ Velocities at interatrial Septum in controls compared with MS pre BMV and post BMV
Post Balloon Mitral Valvotomy Strain imaging revealed improvement in left atrial IAS systolic Strain (11.4 ± 6.3% vs 18.0 ± 10.6%; p=0.021) as shown graphically in figure 16a and a trend towards improved lateral wall Systolic Strain (18.0 ± 8.8 % vs 22.8 ± 10.6; p= 0.07) (figure 16b).
[image:65.612.132.472.265.526.2]
Figure 16a: Atrial Septum Systolic Strain in controls compared with Mitral Stenosis Pre and Post BMV
Figure 16b: Left Atrial Lateral Wall Systolic Strain in controls compared with Mitral Stenosis Pre and Post BMV
Table 7: Strain and strain rate parameters Pre and Post BMV
Variables Pre BMV
(n=25)
Post BMV (n=25)
p value
IAS Strain at Ventricular End Systole (%) 11.4 ± 6.3 18.0 ± 10.6 p=0.02 IAS Strain at Ventricular Late Diastole (%) 0.05 ± 0.33 0.13 ± 0.83 p=0.65 IAS Strain Rate at Ventricular End Systole
(per sec)
0.15 ± 0.85 0.23±0.49 p=0.70
IAS Strain Rate at Ventricular Late Diastole (per sec)
-0.16 ±0.35 -0.17± 0.68 p=0.89
Left Atrial Lateral Wall Strain at Ventricular End Systole(%)
18.2 ± 8.8 22.8 ± 10.6 p=0.07
Left Atrial Lateral Wall Strain at Ventricular Late Diastole(%)
0.014 ± 0.56 -0.12 ± 1.08 p=0.49
Left Atrial Lateral Wall Strain Rate at Ventricular End Systole (per sec)
0.15 ± 0.60 -0.21 ± 0.63 p=0.02
Left Atrial Lateral Wall Strain Rate at Ventricular Late Diastole (per sec)
-0.12 ± 0.49 0.002 ± 0.58 p=0.43
A significant inverse correlation was found between Left atrial Systolic Strain as measured at atrial septum (p<0.001, R= -0.59) and left atrial maximum volume (Figure-17). A similar correlation was also found between left atrial
Lateral wall Systolic Strain and maximum LA volume (p<0.001,R= -0.50) ( Figure 18)
Figure-15: Correlation between IAS Strain (%) and maximal LA volume (ml)
DISCUSSION
Present study to our knowledge is the first Indian study to assess Left Atrial myocardial deformation properties in patients with severe Mitral Stenosis and effect of Balloon Mitral Valvotomy on Left Atrial function as assessed by Tissue Doppler and Strain imaging. The study demonstrated that Left Atrial Tissue Doppler velocities and myocardial reservoir function assessed by Systolic Strain is abnormal in Mitral Stenosis, with Strain parameters tend to normalize within 24 hours after BMV.
It is known that Left Atrial function is influenced by both atrial and ventricular factors. The atrial factors affecting Left Atrial function include Left Atrial contractility & relaxation, Left Atrial pressure & compliance and rhythm abnormalities. Ventricular factors include Mitral annular displacement, Left Ventricular compliance & relaxation.
Abnormal Left Atrial stiffness may induce thrombogenesis, intra atrial stasis with dense spontaneous contrast in Left Atrium and occurrence of Atrial Fibrillation 98.
In our study left atrial size as determined by Left Atrial dimensions in M mode and 2D echo in A4C, Left Atrial maximum and minimum volumes were significantly higher in patients with Mitral Stenosis as compared to Control group. In Mitral Stenosis because of increased resistance at the level of mitral valve there is marked increase in Left Atrial pressure leading to its enlargement. In addition there is increased atrial afterload (at mitral valve level) during atrial contraction, which may lead to decreased Left Atrial pump function as evident in our study by lower Left Atrial ejection fraction in Mitral Stenosis group. Miseung Shin et al 115 has also reported a lower Left Atrial ejection fraction as assessed by 3D echo in 22 patients with moderate to severe Mitral Stenosis when compared with age matched controls. After successful Balloon Mitral Valvotomy with increase in mitral valve area, afterload at mitral valve level decreases leading to improvement in Left Atrial ejection fraction. This was evident as early as 24 hours after Balloon Mitral Valvotomy in our study.
difficult or inaccurate. M mode from parasternal long axis provides a rapid and easy way that gives an idea about atrial size32. It may be inaccurate as it measures Left Atrial dimensions in one plane only however Left Atrial enlargement may not be restricted to that particular plane.
Tissue Doppler imaging with offline assessment of Strain has been introduced for the assessment of atrial reservoir, conduit and contractile function55. Left atrial reservoir function is studied by peak systolic value, left atrial conduit function by early diastolic value and left atrial pump function by late diastolic value. This method to assess atrial function in severe Mitral Stenosis has not been evaluated earlier.
Di Salvo et al 56 had reported atrial peak Systolic Strain as one of the best
predictors for maintenance of sinus rhythm in patients with lone AF. They found patients with recurrence of Atrial Fibrillation after successful cardioversion had lower Systolic Strain as measured at atrial septum and inferior LA wall. Thus improvement in Systolic Strain after Balloon Mitral Valvotomy as found in patients with severe Mitral Stenosis in our study may increase their chance to continue to have sinus rhythm and lower cardiovascular events. Tsang et al 28,30 in more than one study reported that Left Atrial volume was more predictive of future Atrial Fibrillation and other cardiovascular events than Left Atrial dimensions in variable clinical population, suggesting that Left Atrial volume may be a more sensitive index of Left Atrial remodeling than Left Atrial dimension. Our study demonstrated an inverse correlation between maximum Left Atrial volume and systolic Strain as measured at atrial septum and Lateral Left Atrial wall in patients with severe Mitral Stenosis. Thus strain parameters may also be helpful in assessing Left Atrial remodeling and prediction of Atrial Fibrillation.
Strain and no correlation at all has been found between the peak systolic AV ring displacement and atrial peak systolic deformation properties56. These findings confirm that the peak systolic atrial Strain and Strain Rate are less influenced by tethering effects and global heart motion and suggest that the abnormal atrial deformation properties during this phase are due mainly to changes in atrial myocardial compliance.
Atrial Deformation properties measured during diastole were not significantly different in patients with Mitral Stenosis when compared to normal individuals in our study. It may due to the fact that during diastole Mitral valve is wide open and left atrial function is also influenced by LV compliance. This has also been suggested by Di Salvo et al 56 who demonstrated a strong correlation between early diastolic Strain and Strain Rate values and LV global diastolic function indices and between peak early diastolic Strain and peak Systolic annular excursion. Also the lack of abnormalities in diastolic parameters may also be explained at least in part by their lower reproducibility as reported in earlier studies 56,116.
superiority of systolic atrial myocardial deformation properties as predictor of Atrial Fibrillation and cardiovascular events than diastolic atrial deformation parameters 56,57, 98,127 thus further limiting their application.
Present study also demonstrated lower diastolic Tissue Doppler velocities of atrial septum and Left Atrial lateral wall in severe Mitral Stenosis as compared to healthy individuals. Mi Seung Shin et al 115 in their study of 22 patients also reported lower peak systolic and late diastolic tissue velocities in patients with moderate to severe Mitral Stenosis as compared to controls, except that at septum. In our study even the velocities assessed at septum were lower in Mitral Stenosis group. This probably may be related to severity of Mitral Stenosis in patients included in the study. Mi Seung Shin et al 115 in their study included patients with moderate to severe stenosis, whereas in our study all patients has severe Mitral Stenosis which could have resulted in more severe left atrial dysfunction and thus abnormal septal Tissue Doppler velocities. Post Balloon Mitral Valvotomy early diastolic Tissue Doppler velocity of Lateral LA wall improved whereas that of Interatrial Septum remained unchanged in our study. This may be attributed to, interatrial septum being more as compared to lateral LA wall. Sudden decrease in left atrial after load after BMV improves Lateral wall velocity within 24 hours after BMV which is a relatively free structure.
SUMMARY: Our study demonstrates that atrial Tissue Doppler velocities & Tissue Doppler derived Strain imaging is a feasible method for assessment of left atrial function. It can be applied to evaluate impairment of atrial reservoir function in severe Mitral Stenosis. The degree of impairment is correlated to LA maximum volume which in turn is a sensitive predictor of cardiovascular events. Balloon Mitral Valvotomy tends to normalize these abnormalities within 24 hours after the procedure. Since these parameters are believed to predict cardiovascular events they may be useful to determine prognosis and identify patients at risk of complications as AF .This may also help to guide therapeutic decision in these patients.
LIMITATIONS
1) In our study we used Tissue Doppler derived Strain measurements which are known to be dependent on the Doppler angle of interrogation in relation to myocardial motion. Recently developed 2D speckle tracking imaging is independent of angle. However the thickness of the region of interest cannot be reduced to include extensively thin atrial walls in 2D speckle tracking imaging. Accordingly we selected Tissue Doppler imaging to measure tissue velocities and strain of thin atrial walls.
2) Left atrial wall particularly Interatrial septum is at times too thin, which may limit derivation of correct myocardial velocities and strain curves. We tried and kept left atrial walls well in view before applying Tissue Doppler to overcome this limitation.
4) Clinical implications of abnormal strain parameters were not directly assessed in our study. However correlation between systolic Strain and LA maximum volume could be seen and LA volume is known to be a sensitive indicator of cardiovascular events.
5) Number of individuals included in the study was only 50 (25 Controls and 25 Mitral Stenosis). A larger study is needed to confirm our findings.
CONCLUSION
1) Left atrial function as assessed by Tissue Doppler velocities and Tissue Doppler derived Strain is abnormal in patients with severe Mitral Stenosis.
2) Abnormality of left atrial reservoir function as assessed by Tissue Doppler Strain imaging normalizes within 24 hours after Balloon Mitral Valvotomy.
BIBLIOGRAPHY
1) Matsuzaki M, Tanitani M, Toma Y et al. Mechanism of augmented left atrial pump function in myocardial infarction and

![Figure 6: For a 2D object, deformation, i.e. strain, can be described by four strain components: two normal strains [(1) and (2)] and two shear strain components [(3) and (4)]](https://thumb-us.123doks.com/thumbv2/123dok_us/1224908.74765/31.612.147.444.266.485/figure-object-deformation-strain-described-components-strains-components.webp)