Open Access
Short Report
Evaluation of self-reported ethnicity in a case-control population:
the stroke prevention in young women study
Jesse B Mez
1, John W Cole*
1,2, Timothy D Howard
3, Leah R MacClellan
4,
Oscar C Stine
4, Jeffery R O'Connell
5, Marcella A Wozniak
1,2, Barney J Stern
1,2,
John D Sorkin
2, Braxton D Mitchell
5and Steven J Kittner
1,2Address: 1Department of Neurology, University of Maryland School of Medicine, Baltimore, MD, USA, 2Medical Research Service, Veterans Affairs
Medical Center, Baltimore, MD, USA, 3Department of Pediatrics, Center for Human Genomics, Wake Forest University School of Medicine,
Winston-Salem, NC, USA, 4Department of Epidemiology and Preventative Medicine, University of Maryland School of Medicine, Baltimore, MD,
USA and 5Department of Medicine, University of Maryland School of Medicine, Baltimore, MD, USA
Email: Jesse B Mez - [email protected]; John W Cole* - [email protected]; Timothy D Howard - [email protected]; Leah R MacClellan - [email protected]; Oscar C Stine - [email protected];
Jeffery R O'Connell - [email protected]; Marcella A Wozniak - [email protected]; Barney J Stern - [email protected]; John D Sorkin - [email protected];
Braxton D Mitchell - [email protected]; Steven J Kittner - [email protected] * Corresponding author
Abstract
Background: Population-based association studies are used to identify common susceptibility variants for complex genetic traits. These studies are susceptible to confounding from unknown population substructure. Here we apply a model-based clustering approach to our case-control study of stroke among young women to examine if self-reported ethnicity can serve as a proxy for genetic ancestry.
Findings: A population-based case-control study of stroke among women aged 15-49 identified 361 cases of first ischemic stroke and 401 age-comparable control subjects. Thirty single nucleotide polymorphisms (SNPs) throughout the genome unrelated to stroke risk and with established ancestry-based allele frequency differences were genotyped in all participants. The Structure
program was used to iteratively evaluate for K = 1 to 5 potential genetic-based subpopulations. Evaluating the population as a whole, the Structure output plateaued at K = 2 clusters. 98% of self-reported Caucasians had an estimated probability ≥50% of belonging to Cluster 1, while 94% of self-reported African-Americans had an estimated probability ≥50% of belonging to Cluster 2. Stratifying the participants by self-reported ethnicity and repeating the analyses revealed the presence of two clusters among Caucasians, suggesting that potential substructure may exist.
Conclusions: Among our combined sample of African-American and Caucasian participants there is no large unknown subpopulation and self-reported ethnicity can serve as a proxy for genetic ancestry. Ethnicity-specific analyses indicate that population substructure may exist among the Caucasian participants indicating that further studies are warranted.
Published: 18 December 2009
BMC Research Notes 2009, 2:260 doi:10.1186/1756-0500-2-260
Received: 13 May 2009 Accepted: 18 December 2009
This article is available from: http://www.biomedcentral.com/1756-0500/2/260
© 2009 Cole et al; licensee BioMed Central Ltd.
Introduction
Population-based case-control studies are used to identify common susceptibility variants for complex genetic traits; however, population stratification may confound their results [1,2]. Population stratification refers to differences in allele frequencies between cases and controls due to systematic differences in ancestry, rather than association of an allele with disease. To reduce the impact of popula-tion stratificapopula-tion, cases and controls are ascertained from the same population and matched on self-reported eth-nicity. Some studies indicate that stratifying by self-reported ethnicity (i.e. race) may not adequately adjust for population stratification, specifically in out-bred United States populations [2]. A panel of genetic markers specific to ancestry and unlinked to the disease can be used to evaluate whether self-reported ethnicity can serve as a proxy for genetic ancestry or relatedness [3]. Literature suggests that a panel composed of ~20-40 appropriately chosen markers (SNPs or microsatellites) is sufficient for evaluating a group based ancestry estimation [4], but not individual ancestry estimation. In this report, we geno-typed 30 markers selected because of their differing allele frequencies between European Caucasians and Nigerians (Yoruba). We used these markers to determine whether self-reported ethnicity can accurately approximate ances-try in a large biracial population of stroke cases and con-trols.
Materials and methods
Study population
The Stroke Prevention in Young Women (SPYW) Study is a population-based case-control study initiated to exam-ine risk factors for first ischemic stroke in women aged 15-49. All participants were identified from the same popula-tion including all of Maryland (except the far Western panhandle), Washington DC, and the southern portions of both Pennsylvania and Delaware. The methods for dis-charge surveillance, chart abstraction, and case adjudica-tion have been described previously [5]. We determined
each subject's case-control status (i.e. determined subjects who had a stroke) blinded to genetic information. Strokes were further classified by subtype according to TOAST (Trial of Org 10172 in Acute Stroke Treatment) [6] includ-ing thrombosis or embolism due to atherosclerosis of a large artery (N = 16), embolism of cardiac origin (N = 69), occlusion of a small blood vessel (N = 45), other deter-mined cause (N = 43), undeterdeter-mined cause (two possible causes, no cause identified, or incomplete investigation) (N = 188). Controls subjects (women without a history of stroke), were identified by random digit dialing and were frequency matched to the cases by age, race, and geo-graphic region of residence. The present analysis includes 762 subjects (361 cases and 401 controls) from this study who self-identified themselves as Caucasian (non-His-panic) (N = 405) or African-American (N = 357) (see Table 1).
SNP selection and genotyping
Twenty ancestry informative markers (i.e. SNPs) were cho-sen from a HapMap panel previously shown to differ (χ2 > 10) in allele frequencies between individuals from Utah with European ancestry (CEU) and individuals from Nigeria (YRI) [7]. Ten additional SNPs were similarly selected from the Linkage IVb panel (Illumina, San Diego, CA).
Genotyping was conducted using DNA isolated from whole blood using the QIAamp DNA Blood Maxi Kit (Qiagen, Valencia, CA). SNP genotyping was performed by either TaqMan (Applied Biosystems, Foster, CA) or iPLEX (Sequenom, San Diego, CA) methodologies. For each SNP, genotyping for all cases and controls was per-formed on the same platform.
[image:2.612.55.557.575.730.2]Following genotyping, four SNPs were excluded from the analyses: three SNPs (rs1021516, rs1648282, rs1011526) exhibited genotype call rates less than 80% and one SNP (rs2695) did not exhibit a difference in allele frequencies
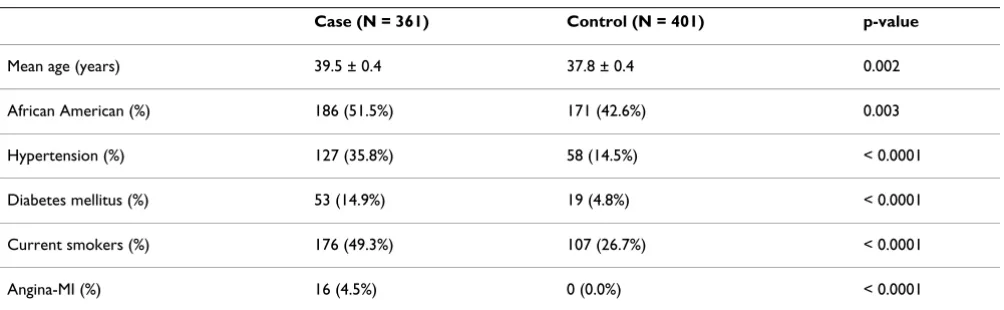
Table 1: Characteristics by case-control status
Case (N = 361) Control (N = 401) p-value
Mean age (years) 39.5 ± 0.4 37.8 ± 0.4 0.002
African American (%) 186 (51.5%) 171 (42.6%) 0.003
Hypertension (%) 127 (35.8%) 58 (14.5%) < 0.0001
Diabetes mellitus (%) 53 (14.9%) 19 (4.8%) < 0.0001
Current smokers (%) 176 (49.3%) 107 (26.7%) < 0.0001
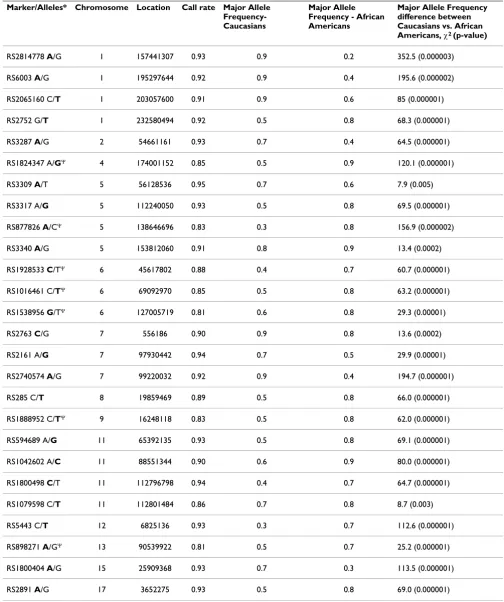
between our Caucasian and African-American popula-tions. Hence, 26 SNPs distributed throughout the genome were included in the analyses (Table 2), with 7 of the SNPs genotyped via Taqman and 19 via iPLEX. All SNPs were verified to be unassociated with stroke (additive model) in the total population and stratified by race. All SNPs were verified to be in Hardy-Weinberg equilibrium (χ2 test). Major allele frequency differences between self-reported Caucasians and African-Americans were calcu-lated (χ2 test). Analyses were performed using SAS®, Ver-sion 9.1 (SAS Institute, Cary, NC) (Tables 1 and 2).
Analyses
Model-based clustering for inferring population structure was performed using Structure software [3]. An admixture ancestry model was chosen to estimate the likelihood that the observed genotypic data corresponded to K = 1 to 5 underlying subpopulations. Per standard Structure proce-dures, missing genotypes were still inputted. The "burn-in period" and the number of Markov Chain Monte Carlo repetitions after "burn-in" were each chosen to be 10,000. Summary statistics converged for these values. For each K, the estimated Ln of the probability of K clusters (log Pr (X | K)) was generated. Similar self-reported ethnicity-spe-cific analyses were also performed.
The ANCESTDIST (Boolean) function of Structure was implemented to assess information about the distribution of Q, the estimated membership coefficients for each indi-vidual in each cluster. When this function is activated, the output file includes the left- and right-hand ends of the probability intervals for each q(i). (A probability interval is the Bayesian analog of a confidence interval.)
Findings
Demographic and risk factor characteristics by case-con-trol status are described in Table 1. The mean age of the cases was 39.5 years and the mean age of control subjects was 37.8 years. Among cases, 51.5% were African Ameri-can and among controls, 42.6% were AfriAmeri-can AmeriAmeri-can. Cases were significantly more likely than controls to have a history of hypertension (p < .0001), diabetes (p < .0001), angina-MI (p < .0001), and to currently smoke cigarettes (p < .0001).
Table 2 lists the SNPs by chromosomal location, includ-ing genotype call rates, ethnicity-specific major allele fre-quencies and resultant χ2 comparison values.
Table 3 details Structure output (log Pr (X | K) (denoted in Table 3 as Ln Prob) and Dirichlet parameter (α)) estimat-ing the number of subpopulations (K) in our sample, K = 1 to 5. Results for the combined and ethnicity-specific analyses are presented. For the combined population, two subpopulations are likely because:
1) log Pr (X | K) plateaus at K = 2.
2) Dirichlet parameter for amount of admixture (α) con-verges to a value < 0.2 once the Markov chain concon-verges.
3) Most individuals are strongly assigned to one of the two populations.
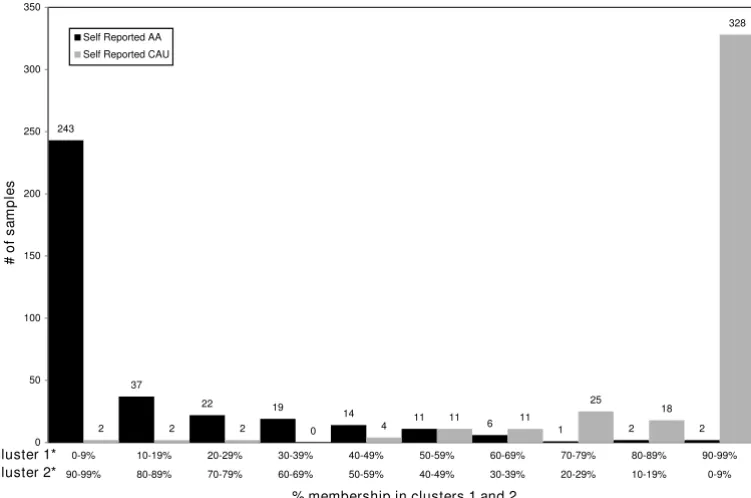
Figure 1 graphically demonstrates for K = 2 clusters, the estimated probability of self-reported Caucasians and African-Americans belonging to each cluster. Summariz-ing, 98% of self-reported Caucasians had an estimated probability ≥50% of belonging to cluster 1, while 94% of self-reported African-Americans had an estimated proba-bility ≥50% of belonging to cluster 2. Further, 81% of self-reported Caucasians and 68% of self-self-reported African-Americans had an estimated probability ≥90% of belong-ing to clusters 1 and 2 respectively.
The Structure ANCESTDIST option provided the 90% probability intervals for each individual. Of the 760 indi-viduals, 130 (17%) have overlapping probability inter-vals. Hence, 83% of the study population demonstrated individual ancestry proportion estimates that had non-overlapping 90% probability intervals.
Ethnicity specific exploratory analyses (demonstrated in Table 3) indicate some further substructure may be present among the self-reported Caucasians as log Pr (X | K) plateaus at K = 2 and α converges to a value < 0.2. When K = 2 among Caucasians alone, individuals distrib-ute unevenly between the two clusters with 40% belong-ing to one cluster and 60% belongbelong-ing to the other (data not shown). No further substructure was identified in our population of self-reported African-Americans as log Pr (X | K) does not plateau for K = 1 to 5 and α diverges.
Discussion
Table 2: Twenty-seven SNPs listed by chromosomal location, including genotype call rates, ethnicity-specific allele frequencies, and relative difference between major allele frequency.
Marker/Alleles* Chromosome Location Call rate Major Allele Frequency-Caucasians
Major Allele Frequency - African Americans
Major Allele Frequency difference between Caucasians vs. African Americans, χ2 (p-value)
RS2814778 A/G 1 157441307 0.93 0.9 0.2 352.5 (0.000003)
RS6003 A/G 1 195297644 0.92 0.9 0.4 195.6 (0.000002)
RS2065160 C/T 1 203057600 0.91 0.9 0.6 85 (0.000001)
RS2752 G/T 1 232580494 0.92 0.5 0.8 68.3 (0.000001)
RS3287 A/G 2 54661161 0.93 0.7 0.4 64.5 (0.000001)
RS1824347 A/GΨ 4 174001152 0.85 0.5 0.9 120.1 (0.000001)
RS3309 A/T 5 56128536 0.95 0.7 0.6 7.9 (0.005)
RS3317 A/G 5 112240050 0.93 0.5 0.8 69.5 (0.000001)
RS877826 A/CΨ 5 138646696 0.83 0.3 0.8 156.9 (0.000002)
RS3340 A/G 5 153812060 0.91 0.8 0.9 13.4 (0.0002)
RS1928533 C/TΨ 6 45617802 0.88 0.4 0.7 60.7 (0.000001)
RS1016461 C/TΨ 6 69092970 0.85 0.5 0.8 63.2 (0.000001)
RS1538956 G/TΨ 6 127005719 0.81 0.6 0.8 29.3 (0.00001)
RS2763 C/G 7 556186 0.90 0.9 0.8 13.6 (0.0002)
RS2161 A/G 7 97930442 0.94 0.7 0.5 29.9 (0.00001)
RS2740574 A/G 7 99220032 0.92 0.9 0.4 194.7 (0.000001)
RS285 C/T 8 19859469 0.89 0.5 0.8 66.0 (0.000001)
RS1888952 C/TΨ 9 16248118 0.83 0.5 0.8 62.0 (0.000001)
RS594689 A/G 11 65392135 0.93 0.5 0.8 69.1 (0.000001)
RS1042602 A/C 11 88551344 0.90 0.6 0.9 80.0 (0.000001)
RS1800498 C/T 11 112796798 0.94 0.4 0.7 64.7 (0.000001)
RS1079598 C/T 11 112801484 0.86 0.7 0.8 8.7 (0.003)
RS5443 C/T 12 6825136 0.93 0.3 0.7 112.6 (0.000001)
RS898271 A/GΨ 13 90539922 0.81 0.5 0.7 25.2 (0.000001)
RS1800404 A/G 15 25909368 0.93 0.7 0.3 113.5 (0.000001)
RS2891 A/G 17 3652275 0.93 0.5 0.8 69.0 (0.000001)
* Major allele in total combined population bolded.
Caucasian population may partially explain the substruc-ture present in our Caucasian participants. Notably, there are plans for the SPYW population to be part of a genome wide association study (GWAS) for ischemic stroke, thereby providing many more SNPs to better characterize the substructure of both the Caucasian and African-Amer-ican participants. Another limitation of our study was the relatively low call rates, most notable for SNPs genotyped via the TaqMan platform. However, this should not have influenced our results because call rates did not differ
sig-nificantly between cases and controls or those of self-reported African Americans and Caucasians (data not shown).
[image:5.612.101.477.413.662.2]In summary, among the combined population, a small number of individuals were genetically more consistent with the other ancestry. Specifically, with a 50% ancestry threshold, 22 self-reported African-Americans were more consistent with Caucasian ancestry, while 10 self-reported Caucasians were more consistent with African-American Table 3: Structure inference algorithm output (log Pr (X | K)) (denoted: Ln Prob) with Dirichlet parameter (α) estimating the number of populations (K) in our sample, K = 1 to 5.
Combined Population Caucasians African Americans
Ln Prob alpha Ln Prob alpha Ln Prob alpha
K = 1 -22523.9 n/a -11068.1 n/a -9169.1 n/a
K = 2 -20016.5 0.1541 -10738.3 0.0452 -8996.2 0.4928
K = 3 -19714.9 0.1059 -10671.9 0.0427 -9114.7 0.4271
K = 4 -19557.2 0.0481 -10585.0 0.0414 -9162.3 0.0957
K = 5 -19543.9 0.0482 -10633.8 0.0433 -9051.7 4.9466
Number of self reported African Americans and Caucasians as a function of percent membership in clusters 1 and 2
Figure 1
Number of self reported African Americans and Caucasians as a function of percent membership in clusters 1 and 2.
243
37
22 19
14 11
6 1 2 2
2 2 2 0 4
11 11
25
18
328
0 50 100 150 200 250 300 350
0-9% 10-19% 20-29% 30-39% 40-49% 50-59% 60-69% 70-79% 80-89% 90-99%
90-99% 80-89% 70-79% 60-69% 50-59% 40-49% 30-39% 20-29% 10-19% 0-9%
#
of sa
mpl
e
s
Self Reported AA
Self Reported CAU
cluster 1* cluster 2*
*derived from model based clustering of genotypes at 26 independent SNPs known to have established race-based allele frequency differences among African and Caucasian populations
ancestry. This information may be incorporated into future association analyses in various ways. Individuals not satisfying an ethnicity-based ancestry threshold could simply be removed from the study. Alternatively, as men-tioned above, more null markers could be genotyped to improve the ancestry classification. Lastly, a variable incorporating percentage of ancestry could be introduced into the association analyses.
Conclusion
Among our combined sample of African-American and Caucasian participants there is no large unknown subpop-ulation and self-reported ethnicity can serve as a proxy for genetic ancestry or relatedness. Ethnicity-specific analyses indicate that population substructure may exist among the Caucasian participants indicating that further studies are warranted.
Competing interests
The authors declare that they have no competing interests.
Authors' contributions
All authors certify that they participated in the conceptual design of this work, the analysis of the data, and the writ-ing of the manuscript to take public responsibility for it. All authors reviewed the final version of the manuscript and approve it for publication. JBM, JWC, BDM and SJK: participated in the writing of the initial draft. JWC, MAW, BJS and SJK: participated in data collection. JBM, TDH and OCS: participated in the genotyping. JBM, JWC, JRO, LRM, BDM, and JDS: participated in the data analysis. All authors provided critiques of the final manuscript.
Acknowledgements
We are indebted to the following members of the Stroke Prevention in Young Women research team for their dedication: Esther Berrent, Kath-leen Caubo, Julia Clark, Mohammed Huq, Ann Maher, Tamar Pair, Mary Simmons, Mary J. Sparks, Mark Waring, Mark Dobbins, Latasha Williams, and Nancy Zappala.
The authors would like to acknowledge the assistance of the following indi-viduals who have sponsored the Stroke Prevention in Young Women Study at their institution: Clifford Andrew, MD; Merrill Ansher, MD; Brian Avin, MD; Harjit Bajaj, MD; Robert Baumann, MD; Nicholas Buendia, MD, Young Ja Cho, MD; Kevin Crutchfield, MD; Terry Detrich, MD; Mohammed Dug-hly, MD; Boyd Dwyer, MD; Jerold Fleishman, MD; Stuart Goodman, MD, PhD; Adrian Goldszmidt, MD; Kalpana Hari Hall, MD; Aleem Iqbal, MD; Walid Kamsheh, MD; Andrew Keenan, MD; John Kelly, MD; Harry Kerasi-dis, MD; Mehrullah Khan, MD; Ramesh Khurana, MD; Ruediger Kratz MD; Somchai Laowattana, MD; William Leahy, MD; Alan Levitt, MD; Bruce Lobar, MD; Paul Melnick, MD; Harshad Mody, MD; Seth Morgan, MD; Howard Moses, MD; Francis Mwaisela, MD; Sivarama Nandipati, MD; Maciej Poltorak, MD; Thaddeus Pula, MD; Phillip Pulaski, MD; Neelupali Reddy, MD; Perry Richardson, MD; Solomon Robbins, MD; Michael Sell-man, MD, PhD; Jack Syme, MD; Richard Taylor, MD; Dean Tippett, MD; Michael Weinrich, MD; Roger Weir, MD; Richard Weisman, MD; Laurence Whicker, MD; Robert Wityk, MD; James Yan, MD and Manuel Yepes, MD.
In addition, the study could not have been completed without the support from the administration and medical records staff at the following institu-tions: In Maryland: Anne Arundel Medical Center; Bon Secours Hospital; Calvert Memorial Hospital; Carroll County General Hospital; Chester River Hospital; Civista Medical Center; Department of Veterans Affairs Medical Center in Baltimore; Doctors Community Hospital; Dorchester Hospital; Franklin Square Hospital Center; Frederick Memorial Hospital; Good Samaritan Hospital; Greater Baltimore Medical Center; Harbor Hos-pital Center; Hartford Memorial HosHos-pital; Holy Cross HosHos-pital; Howard County General Hospital; Johns Hopkins Bayview; The Johns Hopkins Hos-pital; Kernan HosHos-pital; Laurel Regional HosHos-pital; Maryland General Hospi-tal; McCready Memorial HospiHospi-tal; Memorial Hospital at Easton; Mercy Medical Center; Montgomery General Hospital; North Arundel Hospital; Northwest Hospital Center; Peninsula Regional Medical Center; Prince George's Hospital Center; Saint Agnes Hospital; Saint Joseph Medical Center; Saint Mary's Hospital; Shady Grove Adventist Hospital; Sinai Hos-pital of Baltimore; Southern Maryland HosHos-pital Center; Suburban HosHos-pital; Union Hospital Cecil County; The Union Memorial Hospital; University of Maryland Medical System; Upper Chesapeake Medical Center; Washington Adventist Hospital and Washington County Hospital; in Washington DC: The George Washington University Medical Center; Georgetown Univer-sity Hospital; Hadley Memorial Hospital; Howard UniverUniver-sity Hospital; National Rehabilitation Hospital; Providence Hospital; Sibley Memorial Hospital; and the Washington Hospital Center; in Pennsylvania: Gettysburg Hospital.
Funding Acknowledgments
Dr. Cole was supported in part by the Department of Veterans Affairs, Baltimore, Office of Research and Development, Medical Research Service; the Department of Veterans Affairs Stroke Research Enhancement Award Program; the University of Maryland General Clinical Research Center (Grant M01 RR 165001), General Clinical Research Centers Program, National Center for Research Resources, NIH, and; an American Heart Association Beginning Grant-in-Aid (Grant 0665352U). Dr. Kittner was supported in part by the Department of Veterans Affairs, Baltimore, Office of Research and Development, Medical Research Service, and Geriatrics Research, Education and Clinical Center, and Stroke Research Enhance-ment Award Program; a Cooperative AgreeEnhance-ment with the Division of Adult and Community Health, Centers for Disease Control and Prevention; the National Institute of Neurological Disorders and Stroke and the NIH Office of Research on Women's Health; the National Institute on Aging Pepper Center (Grant P60 12583); and the University of Maryland General Clinical Research Center (Grant M01 RR 165001), General Clinical Research Cent-ers Program, National Center for Research Resources, NIH. Dr. Sorkin
was supported by the Baltimore VA Medical Center, Office of Research and Development, Medical Research Service, and Geriatrics Research, Educa-tion, and Clinical Center; the University of Maryland Claude D. Pepper Older Americans Independence Center; the Clinical Nutrition Research Unit of the University of Maryland, and; the Baltimore VA Medical Center, Center for Excellence in Robotics.
References
1. Thomas DC, Witte JS: Point: population stratification: a prob-lem for case-control studies of candidate-gene associations? Cancer Epidemiol Biomarkers Prev 2002, 11:505-12.
2. Burnett MS, Strain KJ, Lesnick TG, de Andrade M, Rocca WA, Mara-ganore DM: Reliability of self-reported ancestry among sib-lings: implications for genetic association studies. Am J Epidemiol 2006, 163:486-92.
3. Pritchard JK, Stephens M, Donnelly P: Inference of population structure using multilocus genotype data. Genetics 2000,
Publish with BioMed Central and every scientist can read your work free of charge "BioMed Central will be the most significant development for disseminating the results of biomedical researc h in our lifetime."
Sir Paul Nurse, Cancer Research UK
Your research papers will be:
available free of charge to the entire biomedical community
peer reviewed and published immediately upon acceptance
cited in PubMed and archived on PubMed Central
yours — you keep the copyright
Submit your manuscript here:
http://www.biomedcentral.com/info/publishing_adv.asp
BioMedcentral 4. Pritchard JK, Rosenberg NA: Use of unlinked genetic markers to
detect population stratification in association studies. Am J Hum Genet 1999, 65:220-228.
5. Kittner SJ, Stern BJ, Wozniak M, Buchholz DW, Earley CJ, Feeser BR, Johnson CJ, Macko RF, McCarter RJ, Price TR, Sherwin R, Sloan MA, Wityk RJ: Cerebral infarction in young adults: The Baltimore-Washington cooperative young stroke study. Neurology 1998,
50:890-894.
6. Adams HP, Bendixen BH, Kappelle LJ, Biller J, Love BB, Gordon DL, Marsh EE: Classification of subtype of acute ischemic stroke. Definitions for use in a multicenter clinical trial. TOAST. Trial of Org 10172 in Acute Stroke Treatment. Stroke 1993,
24:35-41.
7. Shriver MD, Parra EJ, Dios S, Bonilla C, Norton H, Jovel C, Pfaff C, Jones C, Massac A, Cameron N, Baron A, Jackson T, Argyropoulos G, Jin L, Hoggart CJ, McKeigue PM, Kittles RA: Skin pigmentation, biogeographical ancestry and admixture mapping. Hum Genet
2003, 112:387-399.