Henning et al. BMC Res Notes (2015) 8:542
DOI 10.1186/s13104-015-1492-2
for
Humulus lupulus
L. identification and variety
RESEARCH ARTICLE
Simple SNP-based minimal marker
genotyping for
Humulus lupulus
L. identification
and variety validation
John A. Henning
1*, Jamie Coggins
2and Matthew Peterson
3Abstract
Background: Hop is an economically important crop for the Pacific Northwest USA as well as other regions of the world. It is a perennial crop with rhizomatous or clonal propagation system for varietal distribution. A big concern for growers as well as brewers is variety purity and questions are regularly posed to public agencies concerning the avail-ability of genotype testing. Current means for genotyping are based upon 25 microsatellites that provides relatively accurate genotyping but cannot always differentiate sister-lines. In addition, numerous PCR runs (25) are required to complete this process and only a few laboratories exist that perform this service. A genotyping protocol based upon SNPs would enable rapid accurate genotyping that can be assayed at any laboratory facility set up for SNP-based genotyping. The results of this study arose from a larger project designed for whole genome association studies upon the USDA-ARS hop germplasm collection consisting of approximately 116 distinct hop varieties and germplasm (female lines) from around the world.
Results: The original dataset that arose from partial sequencing of 121 genotypes resulted in the identification of 374,829 SNPs using TASSEL-UNEAK pipeline. After filtering out genotypes with more than 50 % missing data (5 geno-types) and SNP markers with more than 20 % missing data, 32,206 highly filtered SNP markers across 116 genotypes were identified and considered for this study. Minor allele frequency (MAF) was calculated for each SNP and ranked according to the most informative to least informative. Only those markers without missing data across genotypes as well as 60 % or less heterozygous gamete calls were considered for further analysis. Genetic distances among indi-viduals in the study were calculated using the marker with the highest MAF value, then by using a combination of the two markers with highest MAF values and so on. This process was reiterated until a set of markers was identified that allowed for all genotypes in the study to be genetically differentiated from each other. Next, we compared genetic matrices calculated from the minimal marker sets [(Table 2; 6-, 7-, 8-, 10- and 12-marker set matrices] and that of a matrix calculated from a set of markers with no missing data across all 116 samples (1006 SNP markers). The minimum number of markers required to meet both specifications was a set of 7-markers (Table 3). These seven SNPs were then aligned with a genome assembly, and DNA sequence both upstream and downstream were used to identify primer sequences that can be used to develop seven amplicons for high resolution melting curve PCR detection or other SNP-based PCR detection methods.
Conclusions: This study identifies a set of 7 SNP markers that may prove useful for the identification and validation of hop varieties and accessions. Variety validation of unknown samples assumes that the variety under question has been included a priori in a discovery panel. These results are based upon in silica studies and markers need to be validated using different SNP marker technology upon a differential set of hop genotypes. The marker sequence data
© 2015 Henning et al. This article is distributed under the terms of the Creative Commons Attribution 4.0 International License (http://creativecommons.org/licenses/by/4.0/), which permits unrestricted use, distribution, and reproduction in any medium, provided you give appropriate credit to the original author(s) and the source, provide a link to the Creative Commons license, and indicate if changes were made. The Creative Commons Public Domain Dedication waiver (http://creativecommons.org/ publicdomain/zero/1.0/) applies to the data made available in this article, unless otherwise stated.
Open Access
*Correspondence: [email protected]
Background
Hop is an important cash crop for the Pacific Northwest USA as well as several European countries, China, Aus-tralia, South Africa and other minor production regions. It is primarily used as a flavoring and bittering additive in beer brewing but alternative uses have become increas-ingly important [1, 2]. Hop is a dioecious perennial plant species propagated via rhizomatous cuttings. The female inflorescence (or hop “cone”) is the harvested product. While male hop plants are required for breeding pur-poses female hop plants will produce cones without pol-lination [3]. Male hop plants disperse pollen via air and if present near production hop yards, can pollinate and produce seed on female hop varieties. Seedlings from these crosses can supersede the previous genotype if they possess superior fitness. Furthermore, when new varieties are produced on yards previously producing a different variety, it is possible for escapes to continue production. Both of these scenario’s can be compounded over the life of a new hop variety planting with the result that a yard becomes contaminated. If rhizome cuttings are subsequently sold from this yard, the recipient grower could end up with either a partially or fully contaminated yard. Hop sales from this field are then rejected due to unexpected flavors or bittering capacity. In addition, farms located across the USA with historical importance have requested help in identifying feral hops growing on their property ([4]; Personal Observation). In these cases, the goal would be to eliminate the possibility that the unknown line is a currently available hop variety.
Regardless of the scenario, the hop industry does not currently have an efficient, accurate and widely avail-able method for marker-based genotyping of hop acces-sions. Current means used by the National Clean Plant Network for genotyping hop are based upon 25 micros-atellites that provides relatively accurate genotyping but cannot always differentiate sister-lines (Dr. Ken Eastwell, Personal Communication 2015). Patzak and Matoušek [5] reported on the use of expressed sequence tagged, simple sequence repeat (EST-SSR) markers as a means of differentiating hop varieties. The reported PCR-based method utilized 30 EST-SSR markers to differentiate 11 different hop genotypes representing a wide genetic pool. Unfortunately, no broad-based evaluation of related and unrelated genotypes was reported. In addition, a signifi-cant number of PCR steps (30) are required to utilize this
method. Koelling et al. [6] reported on the identifica-tion of a 952 new SSR markers identified from expressed sequence tagged data sets deposited with National Center for Biotechnology Information (NCBI: http://www.ncbi. nlm.nih.gov/). These 952 markers were tested across 8 different cultivars to determine differentiation power of the markers. The combination of all 952 markers was suc-cessful in differentiating among the 8 cultivars. Again, no minimal number of SSR markers was identified in this study. Howard et al. [7] reported on the genotyping capabilities of diversity array technology markers (DArT) in hop. While Howard et al. [7] demonstrated DArT markers as having sufficient capability to resolve closely related hop genotypes, its cost and dependence upon a single service provider (Diversity Array Technology Inc.;
http://www.diversityarrays.com/) limit availability. What is needed is a simple, widely available methodology that utilizes a minimal number of markers to differentiate between both related and unrelated hop genotypes.
Single nucleotide polymorphic (SNP) markers repre-sent the most abundant source of variation that can be utilized to differentiate among genotypes especially as they are found in both coding [8] and non-coding regions [9]. Recent genome sequencing work (data not published) shows the presence of a SNP every 346 bp on average in hop. Matthews et al. [10] was the first group to identify and report on next generation sequencing derived SNP markers having identified 17,128 SNPs. This group uti-lized SNP markers to genotype hop varieties and con-cluded that a highly filtered group of 3068 SNP markers resulted in a dendrogram that did not significantly differ from dendrograms obtained using the lower stringency filtered set of 16,106 SNP markers. However, no mini-mum number of markers required to differentiate among all genotypes were identified and reported.
The minimal number of markers chosen for DNA fin-gerprinting cultivars has been examined in numerous crops (see [11] for review) and computer programs have been written to address this application [12] across any plant species. In essence, the primary means of identi-fying the minimal number of markers consists of some means of ranking markers upon their effectiveness at describing population variation and reiteratively includ-ing more and more markers until all genotypes in the population can be genetically differentiated. This process was utilized to identify a small set of SNP markers that and suggested primer sets provide potential means to fingerprint hop varieties in most genetic laboratories utilizing SNP-marker technology.
could, upon validation, be utilized to differentiate among genetically diverse hop accessions and be widely adapt-able and availadapt-able to genetic laboratories worldwide.
Results and discussion
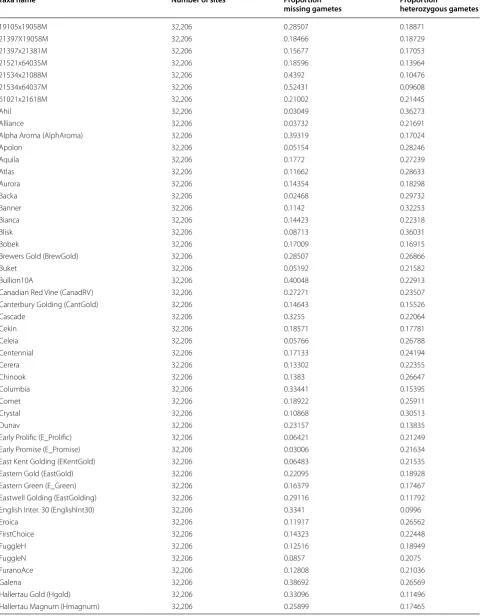
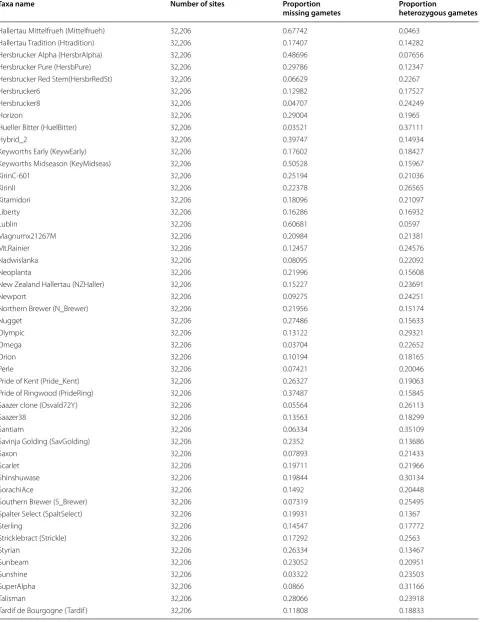
A total of 374,829 SNP markers were identified using the TASSEL-UNEAK Ver 3.0 pipeline [13] across a population of 121 individual varieties and germplasm accessions. Filtering of SNP sites, as well as filtering out individuals with poor sequencing results, was accom-plished using TASSEL ver 4.3.4 [14] resulting in a set of 32,206 high quality SNP markers across 116 geno-types (Table 1). SNP marker filtration settings were set to require presence in 80 % of all genotypes for accept-ance into the data set. Presence of greater than 50 % of all 32,206 SNP markers was set as cut-off for inclusion of a variety into the final data set. Some genetic lines with higher than 50 % missing gamete calls were kept in the study due to their importance in hop production (Haller-tau Mittelfrueh, Wye Zenith, etc., Table 1). Cut-off speci-fications did not differ significantly from those utilized by Matthews et al. [10].
Genotype summaries using all 32,206 SNP mark-ers were obtained using TASSEL. Included in TASSEL’s genotype summary were estimations of the minor allele frequency (MAF). MAF-values are important statistics utilized to filter out markers with high error potential (MAF <0.05) or provide the best discrimination power between genotypes [15]. Ranking of MAF-values from highest to lowest identified numerous markers with MAF <0.5. SNP markers that were heterozygous across all gen-otypes were discarded from consideration. Using a reiter-ative process of additive inclusion of a single marker with highest MAF values we identified a set of six (6) SNPs that were capable of differentiating among all 116 geno-types in the study.
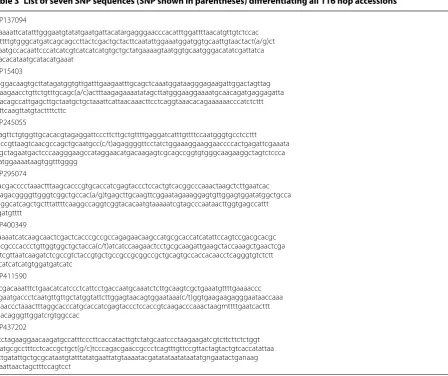
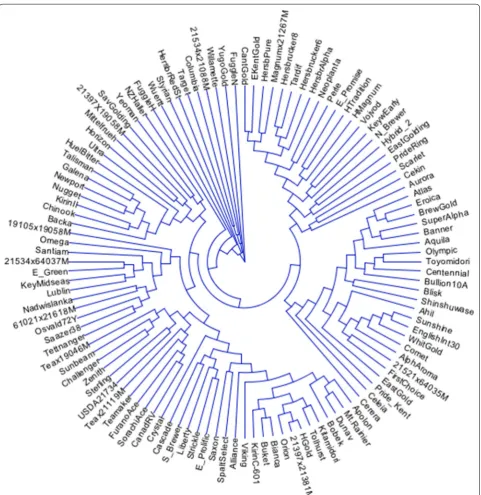
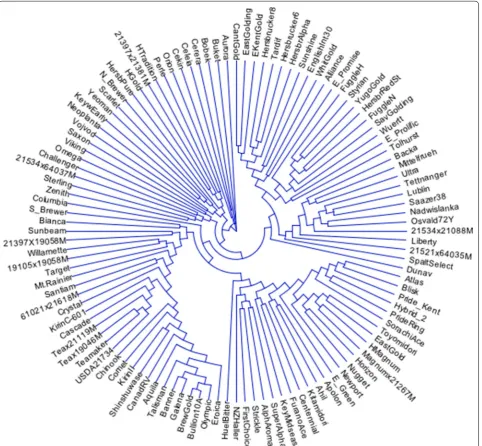
The dendrogram resulting from the use of these six SNP markers did not match up well with dendrograms developed from the use of a complete set of SNP mark-ers (data not shown). As a result, we continued to include additional markers with high-MAF values to the minimal set of markers and then compared the resulting genetic diversity matrices to a matrix calculated from a complete set of 1006 markers (no missing markers from data set) (Table 2). It was determined that the seven SNP markers (Table 3; Fig. 1) with highest MAF-values were required to both differentiate all 116 genotypes and define statis-tically similar dendrograms (approximate Mantel T test; t = −15.7471, p = 0.00001) as compared to a complete set of 1006 SNP markers (Fig. 2).
PCR-based methodology to screen SNP markers var-ies from simple (single strand conformational polymor-phism, SSCP; [4] to resequencing using next generation
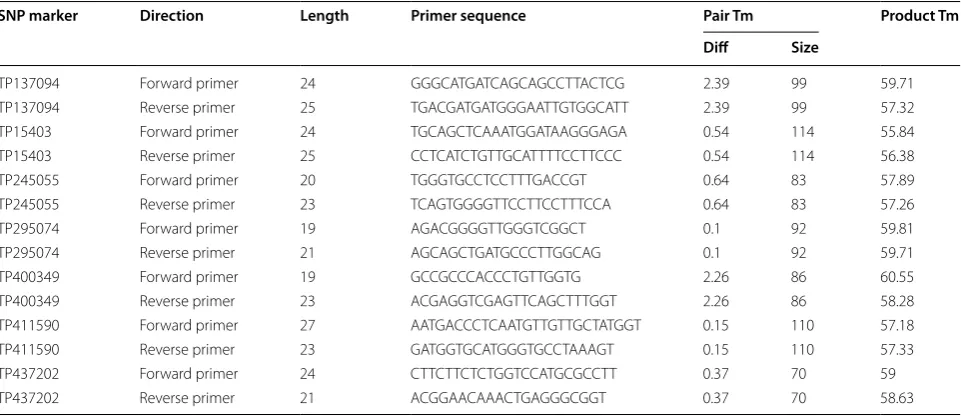
sequencing. This study identified a set of SNP markers that could potentially be used to differentiate hop geno-types. We propose the use of high-resolution melting (HRM) curve analyses as a simple and rapid means to perform genetic fingerprinting on hop genotypes. Uti-lizing a draft hop genome, we aligned the raw reads for informative SNP markers to extend reads to a total length of 264-bp. Primer3 software identified optimum primer sequences that can be used to develop Amplicons for HRM analysis (Table 4).
Several of the accessions used in this study are thought to be clonal selections from other lines contained in this study. As an example, Savinja Golding is thought to be a clonal selection from Fuggle (see: “Slovenian Styrian Goldings: https://bsgcraftbrewing.com/slovenian-styr-ian-goldings) as are Fuggle H and Fuggle N (A. Haunold, Personal Communication, 2014). In addition, Hers-brucker 6 and 8 are thought to be clonal selections from the original German ‘Hersbrucker’ landrace (see: USDA ACCESSION No. 21514; http://www.ars.usda.gov/ SP2UserFiles/person/2450/hopcultivars/21514.html). All these “clonal selections” show sufficient phenotypic differences from the related lines as well as parent lines to suggest genetic differences between them, although differences are expected to be minor. The inclusion of clonal selections was to determine if a sufficiently robust method could be devised to differentiate among such lines.
Previous work in hop have focused upon the identifi-cation of male plants from a population of offspring [16] or genetic diversity and DNA fingerprinting using older marker technology such as STS, SSR, AFLP, RAPD and DArT [7, 17–19]. In all publications, differentiation of accessions required the full compliment of markers used for defining genetic diversity in hop populations. In sev-eral reports, a few hop varieties were not differentiated from one another and complete validation was not pos-sible given the marker technology used. Furthermore, none of the published reports identified a subset of mark-ers that could be used independently to fingerprint hop varieties.
Table 1 Summary genotypic information of the results of partial sequencing for 116 varieties and experimental lines
Taxa name Number of sites Proportion
missing gametes Proportion heterozygous gametes
19105x19058M 32,206 0.28507 0.18871
21397X19058M 32,206 0.18466 0.18729
21397x21381M 32,206 0.15677 0.17053
21521x64035M 32,206 0.18596 0.13964
21534x21088M 32,206 0.4392 0.10476
21534x64037M 32,206 0.52431 0.09608
61021x21618M 32,206 0.21002 0.21445
Ahil 32,206 0.03049 0.36273
Alliance 32,206 0.03732 0.21691
Alpha Aroma (AlphAroma) 32,206 0.39319 0.17024
Apolon 32,206 0.05154 0.28246
Aquila 32,206 0.1772 0.27239
Atlas 32,206 0.11662 0.28633
Aurora 32,206 0.14354 0.18298
Backa 32,206 0.02468 0.29732
Banner 32,206 0.1142 0.32253
Bianca 32,206 0.14423 0.22318
Blisk 32,206 0.08713 0.36031
Bobek 32,206 0.17009 0.16915
Brewers Gold (BrewGold) 32,206 0.28507 0.26866
Buket 32,206 0.05192 0.21582
Bullion10A 32,206 0.40048 0.22913
Canadian Red Vine (CanadRV) 32,206 0.27271 0.23507
Canterbury Golding (CantGold) 32,206 0.14643 0.15526
Cascade 32,206 0.3255 0.22064
Cekin 32,206 0.18571 0.17781
Celeia 32,206 0.05766 0.26788
Centennial 32,206 0.17133 0.24194
Cerera 32,206 0.13302 0.22355
Chinook 32,206 0.1383 0.26647
Columbia 32,206 0.33441 0.15395
Comet 32,206 0.18922 0.25911
Crystal 32,206 0.10868 0.30513
Dunav 32,206 0.23157 0.13835
Early Prolific (E_Prolific) 32,206 0.06421 0.21249
Early Promise (E_Promise) 32,206 0.03006 0.21634
East Kent Golding (EKentGold) 32,206 0.06483 0.21535
Eastern Gold (EastGold) 32,206 0.22095 0.18928
Eastern Green (E_Green) 32,206 0.16379 0.17467
Eastwell Golding (EastGolding) 32,206 0.29116 0.11792
English Inter. 30 (EnglishInt30) 32,206 0.3341 0.0996
Eroica 32,206 0.11917 0.26562
FirstChoice 32,206 0.14323 0.22448
FuggleH 32,206 0.12516 0.18949
FuggleN 32,206 0.0857 0.2075
FuranoAce 32,206 0.12808 0.21036
Galena 32,206 0.38692 0.26569
Hallertau Gold (Hgold) 32,206 0.33096 0.11496
[image:5.595.58.542.111.728.2]Table 1 continued
Taxa name Number of sites Proportion
missing gametes Proportion heterozygous gametes
Hallertau Mittelfrueh (Mittelfrueh) 32,206 0.67742 0.0463
Hallertau Tradition (Htradition) 32,206 0.17407 0.14282
Hersbrucker Alpha (HersbrAlpha) 32,206 0.48696 0.07656
Hersbrucker Pure (HersbPure) 32,206 0.29786 0.12347
Hersbrucker Red Stem(HersbrRedSt) 32,206 0.06629 0.2267
Hersbrucker6 32,206 0.12982 0.17527
Hersbrucker8 32,206 0.04707 0.24249
Horizon 32,206 0.29004 0.1965
Hueller Bitter (HuelBitter) 32,206 0.03521 0.37111
Hybrid_2 32,206 0.39747 0.14934
Keyworths Early (KeywEarly) 32,206 0.17602 0.18427
Keyworths Midseason (KeyMidseas) 32,206 0.50528 0.15967
KirinC-601 32,206 0.25194 0.21036
KirinII 32,206 0.22378 0.26565
Kitamidori 32,206 0.18096 0.21097
Liberty 32,206 0.16286 0.16932
Lublin 32,206 0.60681 0.0597
Magnumx21267M 32,206 0.20984 0.21381
Mt.Rainier 32,206 0.12457 0.24576
Nadwislanka 32,206 0.08095 0.22092
Neoplanta 32,206 0.21996 0.15608
New Zealand Hallertau (NZHaller) 32,206 0.15227 0.23691
Newport 32,206 0.09275 0.24251
Northern Brewer (N_Brewer) 32,206 0.21956 0.15174
Nugget 32,206 0.27486 0.15633
Olympic 32,206 0.13122 0.29321
Omega 32,206 0.03704 0.22652
Orion 32,206 0.10194 0.18165
Perle 32,206 0.07421 0.20046
Pride of Kent (Pride_Kent) 32,206 0.26327 0.19063
Pride of Ringwood (PrideRing) 32,206 0.37487 0.15845
Saazer clone (Osvald72Y) 32,206 0.05564 0.26113
Saazer38 32,206 0.13563 0.18299
Santiam 32,206 0.06334 0.35109
Savinja Golding (SavGolding) 32,206 0.2352 0.13686
Saxon 32,206 0.07893 0.21433
Scarlet 32,206 0.19711 0.21966
Shinshuwase 32,206 0.19844 0.30134
SorachiAce 32,206 0.1492 0.20448
Southern Brewer (S_Brewer) 32,206 0.07319 0.25495
Spalter Select (SpaltSelect) 32,206 0.19931 0.1367
Sterling 32,206 0.14547 0.17772
Stricklebract (Strickle) 32,206 0.17292 0.2563
Styrian 32,206 0.26334 0.13467
Sunbeam 32,206 0.23052 0.20951
Sunshine 32,206 0.03322 0.23503
SuperAlpha 32,206 0.0866 0.31166
Talisman 32,206 0.28066 0.23918
[image:6.595.59.543.106.729.2]or identification. Partial sequencing through next genera-tion sequencing technology allows for the identificagenera-tion of thousands of SNP markers from across the genome. These markers are not limited to clustered regions such as SSRs and DArT markers [16, 20] and are therefore more representative of the genome. Because of their dis-tribution throughout the genome, SNP markers offer a greater likelihood of differentiating among accessions.
The 7 SNPs identified in this study were the minimum number of markers required to differentiate all the hop
accessions in this study. They have not yet been tested using high resolution melting (HRM) or other SNP detec-tion methods. Furthermore, the use of these 7 SNPs as a discriminating tool for samples consisting of mixtures of different cultivars has not been tested but may have limited applicability given the small number of mark-ers used. The primmark-ers for use in HRM are reported for implementation by other projects (Table 3). If one or two of these SNPs prove to be insufficient for use in HRM or other PCR techniques, there are additional SNP markers that can be utilized (Supplementary Data).
Conclusions
This note reports on the identification of a minimal num-ber of markers (7 SNPs) required to differentiate among 116 widely divergent hop accessions including clonal selections and sister hop lines. As such, it is the first publication outlining a simple widely available protocol for the identification of, and discrimination among, hop varieties. The SNPs and associated primer sequences for HRM analysis are provided and supplementary data pro-vided to aid genetic.
Laboratories ensure their own set of markers that can be used for differentiation among hop lines.
Methods
Plant material consisted of 121 genotypes (varieties and experimental germplasm) contained in the USDA-ARS Table 1 continued
Taxa name Number of sites Proportion
missing gametes Proportion heterozygous gametes
Teamaker 32,206 0.31466 0.20682
Teamakerx19046M (Teax19046M) 32,206 0.34202 0.17163
Teamakerx21119M (Teax21119M) 32,206 0.25222 0.22697
Tettnanger 32,206 0.29926 0.12606
Tolhurst 32,206 0.07222 0.20669
Toyomidori 32,206 0.16177 0.22822
Ultra 32,206 0.17248 0.1974
USDA21734 32,206 0.17264 0.25824
Vojvodina (Vojvod) 32,206 0.02742 0.28998
Whitsbred Golding (WhitGold) 32,206 0.05415 0.22438
Willamette 32,206 0.43871 0.18969
Wuerttenburger (Wuertt) 32,206 0.29178 0.12613
Wye Challenger 32,206 0.27296 0.12466
Wye Target 32,206 0.23701 0.19757
Wye Viking 32,206 0.09039 0.19696
Wye Yeoman 32,206 0.25638 0.14648
Wye Zenith 32,206 0.411 0.06146
Yugoslavia Golding (YugoGold) 32,206 0.15783 0.17273
Labels for lines present in dendrogram (Figs. 1, 2) are defined in the first column (Taxa Name)
Table 2 3-way Mantel’s t test [23] for cophenetic compari-sons among genetic distance matrices comparing genetic distances calculated via 6-, 7-, 8-, 10-, and 12-markers (X-matrix, no missing markers) to that of a matrix calcu-lated with 1006 SNP markers (Y-matrix, no missing mark-ers) using a Z-matrix calculated from 32,217 markers (20 % missing marker data allowed)
This test uses residuals of regression of X on Z and of Y on Z
#Markers Mantel’s
r t test p
6 −0.0010 −0.1125 0.4552
7 −0.2190 −15.7471 0.0000
8 −0.2217 −15.9771 0.0000
10 −0.2105 −13.0887 0.0000
[image:7.595.58.540.101.352.2] [image:7.595.56.291.475.570.2]hop genetics and breeding program located at Cor-vallis, OR. Due to poor DNA quality of a few of the lines, the final sample number used was 116. DNA was extracted using DNAeasy Kits (Qiagen Inc) with the exception that the amount of RNase A was dou-bled and the QIAshredder spin column was not used. Library preparation, sequencing and were as reported by Elshire [21]. Because hop does not currently have a reference genome, SNP identification and produc-tion of hapmap files were accomplished using the TASSEL-UNEAK pipeline (http://www.maizegenetics. net/tassel/docs/TasselPipelineUNEAK.pdf). Resulting hapmap was analyzed by TASSEL 5.2.1 [14]. Marker and genotype summaries were exported as csv-format
files which were imported into Microsoft® Excel® for Mac 2011. Minor allele frequency (MAF) were calcu-lated in TASSEL and subsequently sorted from high-est to lowhigh-est values. Initially, the top two markers with the highest MAF values were chosen for data analysis. These two markers with the highest MAF values were filtered into a separate data file in TASSEL v 5.0 using the “filter sites” option and genetic diversity values estimated from this filtered data. The resulting genetic diversity matrix was scanned for presence of genetic diversity estimates equal to zero. If present, the pro-cess was repeated adding the next marker with highest MAF value. These steps were reiterated until all genetic diversity estimates were greater than zero (matrix with Table 3 List of seven SNP sequences (SNP shown in parentheses) differentiating all 116 hop accessions
>TP137094
agaaaattcatatttgggaatgtatatgaatgattacatargagggaacccacatttggattttaacatgttgtctccac aattttgtgggcatgatcagcagccttactcgactgctacttcaatattggaaatggatggtgcaattgtaactact(a/g)ct taaatgccacaattcccatcatcgtcatcatcatgtgctgctatgaaaagtaatggtgcaatgggacatatcgattatca taacacataatgcatacatgaaat
>TP15403
tcaggacaagtgcttatagatggtgttgatttgaagaatttgcagctcaaatggataagggagaagattggactagttag ccaagaacctgttctgtttgcagc(a/c)actttaagagaaaatatagcttatgggaaggaaaatgcaacagatgaggagatta aaacagccattgagcttgctaatgctgctaaattcattaacaaacttcctcaggtaaacacagaaaaaacccatctcttt gtttcaagttatgtacttttcttc
>TP245055
agagttctgtggttgcacacgtagaggattcccttcttgctgttttgaggatcatttgttttccaatgggtgcctccttt gaccgttaagtcaacgccagctgcaatgcc(c/t)agaggggttcctatctggaaaggaaggaaccccactgagattcgaaata tggctagaatgactcccaagggaagccataggaacatgacaagagtcgcagccggtgtgggcaagaaggctagtctccca tcatggaaaataagtggtttgggg
>TP295074
aaacgacccctaaactttaagcacccgtgcaccatcgagtaccctccactgtcacggcccaaactaagctcttgaatcac tttagacggggttgggtcggctgccac(a/g)tgagcttgcaagttcggaatagaaaggagtgttggagtggatatggctgcca agggcatcagctgctttattttcaaggccaggtcggtacacaatgtaaaaatcgtagcccaataacttggtgagccattt ttgatgtttt
>TP400349
ccaaaatcatcaagcaactcgactcacccgccgccagagaacaagccatgcgcaccatcatattccagtccgacgcacgc gccgcccaccctgttggtggctgctacca(c/t)atcatccaagaactcctgcgcaagattgaagctaccaaagctgaactcga cctcgttaatcaagatctcgccgtctaccgtgctgccgccgcggccgctgcagtgccaccacaacctcagggtgtctctt ctcatcatcatgtggatgatcatc
>TP411590
agcgacaaatttctgaacatcatccctcattcctgaccaatgcaaatctcttgcaagtcgctgaaatgttttgaaaaccc ctgaatgaccctcaatgttgttgctatggtattcttggagtaacagtggaataaa(c/t)ggtgaagaagagggaataaccaaa cgaaccctaaactttaggcacccatgcaccatcgagtaccctccaccgtcaagacccaaactaagmttttgaatcacttt agacagggttggatcrgtggccac
>TP437202
[image:8.595.66.515.93.469.2]six SNP markers having the highest MAF values). Addi-tional high-MAF, SNP markers were added to this set of six SNPs to form additional genetic distance matri-ces (genetic distance matrimatri-ces formed from 7-, 8-, 10- and 12-markers) for comparison to a complete set of polymorphic markers with no missing data (1006 SNP markers). NTSYSpc V2.21c [22] was used to estimate
correlations between genetic matrices for minimal marker sets (6-, 7-, 8-, 10-, 12-markers) and the com-plete data set using 3-way Mantel’s t test [23] and a matrix calculated (constant or “Z-matrix”) from the original set of 32,206 SNP markers.
[image:9.595.58.540.86.582.2](http://hopbase.cgrb.oregonstate.edu/app_dev.php/) to extend reads by 100-bp on either side of the 64-bp read using Geneious Pro ver 5.5.9 (http://www.geneious. com, [24] (Table 3). As an aid to interested parties, we developed primer pairs (Table 4) that are appropriate
for high-resolution melting curve analyses [25] using Primer3 [26]. Default settings were used and product size was limited to a range of 70- to 115-bp length. Other PCR-based SNP assays are available and can be designed using the information in Table 3.
[image:10.595.59.542.89.535.2]Availability of supporting data
The data set supporting the results of this article is included within the article while the hapmap file from which this study derives is included as supplementary files (Additional file 1).
Abbreviations
AFLP: amplified fragment length polymorphism; DArT: diversity array technol-ogy; HRM: high resolution melting; MAF: minor allele frequency; RAPD: restric-tion amplified polymorphism DNA; SNP: single nucleotide polymorphism; SSR: single sequence repeat; STS: sequence tagged site.
Authors’ contributions
The author laboratory was responsible for DNA preparation, data analyses and manuscript preparation. Library preparation and sequencing were performed by Oregon State University—Center for Genomic Research and Bioinformatics. All authors read and approved the final manuscript.
Author details
1 USDA-ARS, 3450 SW Campus Way, Corvallis, OR 97331, USA. 2 ROY FARMS, INC., 401 Walters Road, Moxee, WA 98936, USA. 3 CGRB, ALS Building, Oregon State University, Corvallis, OR 97331, USA.
Acknowledgements
The author acknowledges the USDA-ARS, Hop Research Council ( http://hopre-searchcouncil.org/) and the Hop Breeding Company ( http://www.hopbreed-ing.com/) for funding this research.
Compliance with ethical guidelines Competing interests
The authors has no competing interests with the data or results of this study. Additional file
Additional file 1. Supplementary data file consisting of the hapmap flat file of the 32,206 SNP markers used to identify the minimal set of seven SNP markers
Received: 26 September 2014 Accepted: 21 September 2015
References
1. Pollach G, Hein W, Beddie D. Application of hop β-acids and rosin acids in the sugar industry. Zuckerindustrie. 2002;127(12):921–30.
2. Siragusa GR, Haas GJ, Matthews P, Smith R, Buhr RJ, Macdougald L, Dale N. Humulus lupus Beta-acids administered through water reduce Clostrid-ium perfringens challenge strains in the chicken intestinal tract midgut and ceca. Antimicrob Agents Chemother. 2008;61:853–8.
3. Neve RA. Hops. Springer. 1996. Pub. ISBN: 978-94-010-5375-4. 4. Orita M, Iwahana H, Knazawa H, Hayashi K, Sekiya T. Detection of the
polymorphisms of human DNA by gelelectrophoresis as single-strand conformation polymorphisms. Proc Natl Acad Sci USA. 1989;86:2766–70. 5. Patzak J, Matoušek J. Development and evaluation of expressed
sequence tag-derived microsatellite (EST-SSR) markers for genotyping of hop (Humulus lupulus L.). Biol Plant. 2011;55:761–5.
6. Koelling J, Coles M, Matthews P, Schwekendiek A. Development of new microsatellite markers (SSRs) for Humulus lupulus. Mol Breed. 2012;30:479–84.
7. Howard EL, Whittock SP, Jakše J, Carling J, Matthews PD, Probasco G, Koutoulis A. High-throughput genotyping of hop (Humulus lupulus L.) utilising diversity arrays technology (DArT). Theor Appl Genet. 2011;122(7):1265–80. doi:10.1007/s00122-011-1529-4.
8. Schilling MP, Wolf PG, Duffy AM, Rai HS, Rowe CA, Richardson BA, Mock KE. Genotyping-by-sequencing for Populus population genomics: an assessment of genome sampling patterns and filtering approaches. PLoS One. 2014;9(4):e95292. doi:10.1371/journal.pone.0095292.t001. 9. Sachidanandam R, Weissman D, Schmidt SC, Kakol JM, Stein LD, Marth
G, Sherry S, Mullikin JC, et al. A map of human genome sequence vari-ation containing 1.42 million single nucleotide polymorphisms. Nature. 2001;409(6822):928–33. doi:10.1038/35057149.
10. Matthews PD, Coles MC, Pitra NJ. Next Generation Sequencing for a Plant of Great Tradition: application of NGS to SNP Detection and Validation in Hops (Humulus lupulus L.)—Hop Special. BrewingScience—Monatsschrift für. Brauwissenschaft. 2013;66:185–91.
11. Nybom H, Weising K, Rotter B. DNA fingerprinting in botany: past, pre-sent, future. Investig Genet. 2014 5:1-35. Published online Jan 3, 2014. doi:
10.1186/2041-2223-5-1.
Table 4 Suggested primers pair sets and amplicon specifications for high resolution melting curve analysis of seven SNP markers differentiating among 116 hop genotypes
SNP marker Direction Length Primer sequence Pair Tm Product Tm
Diff Size
TP137094 Forward primer 24 GGGCATGATCAGCAGCCTTACTCG 2.39 99 59.71 TP137094 Reverse primer 25 TGACGATGATGGGAATTGTGGCATT 2.39 99 57.32 TP15403 Forward primer 24 TGCAGCTCAAATGGATAAGGGAGA 0.54 114 55.84 TP15403 Reverse primer 25 CCTCATCTGTTGCATTTTCCTTCCC 0.54 114 56.38
TP245055 Forward primer 20 TGGGTGCCTCCTTTGACCGT 0.64 83 57.89
TP245055 Reverse primer 23 TCAGTGGGGTTCCTTCCTTTCCA 0.64 83 57.26
TP295074 Forward primer 19 AGACGGGGTTGGGTCGGCT 0.1 92 59.81
TP295074 Reverse primer 21 AGCAGCTGATGCCCTTGGCAG 0.1 92 59.71
TP400349 Forward primer 19 GCCGCCCACCCTGTTGGTG 2.26 86 60.55
TP400349 Reverse primer 23 ACGAGGTCGAGTTCAGCTTTGGT 2.26 86 58.28 TP411590 Forward primer 27 AATGACCCTCAATGTTGTTGCTATGGT 0.15 110 57.18 TP411590 Reverse primer 23 GATGGTGCATGGGTGCCTAAAGT 0.15 110 57.33 TP437202 Forward primer 24 CTTCTTCTCTGGTCCATGCGCCTT 0.37 70 59
[image:11.595.58.539.114.323.2]12. Fujii H, Ogata T, Shimada T, Endo T, Iketani H, Shimizu H, Omura M. Minimal marker: an algorithm and computer program for the identifica-tion of minimal sets of discriminating dna markers for efficient variety identification. J Bioinform Comput Biol. 2013;11(2):1–17. doi:10.1142/ S0219720012500229.
13. Lu F, Lipka AE, Elshire R, Cherney JH, Casler MD, Buckler ES, Costich DE. Switchgrass genomic diversity, ploidy, and evolution: novel insights from a network-based SNP discovery protocol. PLoS Genet. 2013;9(1):e1003215. doi:10.1371/journal.pgen.1003215.
14. Bradbury PJ, Zhang Z, Kroon DE, Casstevens TM, Ramdoss Y, Buckler ES. TASSEL: Software for association mapping of complex traits in diverse samples. Bioinformatics. 2007;23:2633–5.
15. Halldórsson BV, Istrail S, De La Vega FM. Optimal selection of SNP markers for disease association studies. Hum Hered. 2004;58:190–202.
16. McAdam EL, Freeman JS, Whittock SP, Buck EJ, Jakse J, Cerenak A, Kout-oulis A. Quantitative trait loci in hop (Humulus lupulus L.) reveal complex genetic architecture underlying variation in sex, yield and cone chemis-try. BMC Genom. 2013;14:360. doi:10.1186/1471-2164-14-360.
17. Fleischer R, Horlemann C, Schwekendiek A, Kling C, Weber G. AFLP finger-printing in hop: Analysis of the genetic variability of the Tettnang variety. Genet Resour Crop Evol. 2004;51(2):211–20. doi:10.1023/B:GRES.00000270 52.72343.2d.
18. Matoušek J, Patzak J, Vrba L. New STS molecular markers for assessment of genetic diversity and DNA fingerprinting in hop (Humulus lupulus L.). Genome. 2007;50(1):15–25. doi:10.1139/g06-128.
19. Patzak J. Comparison of RAPD, STS, ISSR and AFLP molecular methods used for assessment of genetic diversity in hop (Humulus lupulus L.). Euphytica. 2001;121(1):9–18. doi:10.1023/A:1012099123877.
20. Henning JA, Townsend MS, Gent DH, Bassil N, Matthews P, Buck E, Beatson R. QTL mapping of powdery mildew susceptibility in hop (Humulus lupulus L.). Euphytica. 2011;180(3):411–20. doi:10.1007/ s10681-011-0403-4.
21. Elshire RJ, Glaubitz JC, Sun Q, Poland JA, Kawamoto K, et al. A robust, simple genotyping-by-sequencing (GBS) Approach for High Diversity Species. PLoS One. 2011;6(5):e19379. doi:10.1371/journal.pone.0019379. 22. Rohlf FJ. Numerical Taxonomy System ver 2.21c. Exetor Software.
Setauket, New York. 2007.
23. Smouse PE, Jeffrey LC, Sokal RR. Multiple regression and correlation extensions of the mantel test of matrix correspondence. Syst Zool. 1986;35(4):627–32.
24. Kearse M, Moir R, Wilson A, Stones-Havas S, Cheung M, Sturrock S, Buxton S, Cooper A, Markowitz S, Duran C, Thierer T, Ashton B, Mentjies P, Drum-mond A. Geneious Basic: an integrated and extendable desktop software platform for the organization and analysis of sequence data. Bioinformat-ics. 2012;28(12):1647–9.
25. Gundry CN, Vandersteen JG, Reed GH, Pryor RJ, Chen J, Wittwer CT. Amplicon melting analysis with labeled primers: a closed-tube method for differentiating homozygotes and heterozygotes. Clin Chem. 2003;49:396–406.
26. Untergrasser A, Cutcutache I, Koressaar T, Ye J, Faircloth BC, Remm M, Rozen SG. Primer3—new capabilities and interfaces. Nucleic Acids Res. 2012;40(15):e115.
Submit your next manuscript to BioMed Central and take full advantage of:
• Convenient online submission • Thorough peer review
• No space constraints or color figure charges • Immediate publication on acceptance
• Inclusion in PubMed, CAS, Scopus and Google Scholar • Research which is freely available for redistribution
![Table 2 3-way Mantel’s t test [23] for cophenetic compari-sons among genetic distance matrices comparing genetic distances calculated via 6-, 7-, 8-, 10-, and 12-markers (X-matrix, no missing markers) to that of a matrix calcu-lated with 1006 SNP markers (Y-matrix, no missing mark-ers) using a Z-matrix calculated from 32,217 markers (20 % missing marker data allowed)](https://thumb-us.123doks.com/thumbv2/123dok_us/8298065.288546/7.595.58.540.101.352/cophenetic-distance-matrices-comparing-distances-calculated-missing-calculated.webp)