White Rose Research Online URL for this paper: http://eprints.whiterose.ac.uk/122612/
Version: Accepted Version
Article:
Ferris, DL, Reb, J, Lian, H et al. (2 more authors) (2018) What Goes Up Must… Keep Going Up? Cultural Differences in Cognitive Styles Influence Evaluations of Dynamic Performance. Journal of Applied Psychology, 103 (3). pp. 347-358. ISSN 0021-9010 https://doi.org/10.1037/apl0000282
(c) American Psychological Association, 2018. This paper is not the copy of record and may not exactly replicate the authoritative document published in the APA journal. Please do not copy or cite without author's permission. The final article is available, upon
publication, at: http://doi.org/10.1037/apl0000282
[email protected] https://eprints.whiterose.ac.uk/
Reuse
Unless indicated otherwise, fulltext items are protected by copyright with all rights reserved. The copyright exception in section 29 of the Copyright, Designs and Patents Act 1988 allows the making of a single copy solely for the purpose of non-commercial research or private study within the limits of fair dealing. The publisher or other rights-holder may allow further reproduction and re-use of this version - refer to the White Rose Research Online record for this item. Where records identify the publisher as the copyright holder, users can verify any specific terms of use on the publisher’s website.
Takedown
If you consider content in White Rose Research Online to be in breach of UK law, please notify us by
What Goes Up Must…Keep Going Up?
Cultural Differences in Cognitive Style Influence Evaluations of Dynamic Performance
Lance Ferris Jochen Reb Huiwen Lian Samantha Sim Dionysius Ang
Abstract
Past research on dynamic workplace performance evaluation has taken as axiomatic that
temporal performance trends produce naïve extrapolation effects on performance ratings. That is, we naïvely assume that an individual whose performance has trended upward over time will continue to improve, and rate that individual more positively than an individual whose performance has trended downward over time – even if, on average, the two individuals have performed at an equivalent level. However, we argue that such naïve extrapolation effects are more pronounced in Western countries than Eastern countries, owing to Eastern countries having a more holistic cognitive style. To test our hypotheses, we examined the effect of performance trend on expectations of future performance and ratings of past performance across two studies: Study 1 compares the magnitude of naïve extrapolation effects among Singaporeans primed with either a more or less holistic cognitive style, and Study 2 examines holistic cognitive style as a mediating mechanism accounting for differences in the magnitude of naïve extrapolation effects between American and Chinese raters. Across both studies, we found support for our predictions that dynamic performance trends have less impact on the ratings of more holistic thinkers. Implications for the dynamic performance and naïve extrapolation literatures are discussed.
Performance appraisals serve a variety of important purposes, such as identifying
individuals for promotion, providing developmental feedback, and assigning merit pay (Cardy & Dobbins, 1994). Yet while being common tasks for supervisors, they nevertheless remain
complex decisions. One challenge supervisors face is that an employee’s performance changes over time (Deadrick, Bennett, & Russell, 1997; Fisher, 2008; Sturman, 2007), and aspects of these changes (e.g., maximum or minimum sales in a quarter) may influence evaluations of performance in addition to average performance (e.g., mean sales in a quarter; Lee & Dalal, 2011). Along these lines, performance trend – that is, whether or not performance is generally increasing or decreasing over time – has repeatedly been found to influence evaluations of past performance, with increasing performance trends receiving higher performance evaluations (e.g., DeNisi & Stevens, 1981; Reb & Cropanzano, 2007). The effects of such trends are attributed to a process known as naïve extrapolation, wherein decision-makers extrapolate past performance trends to expectations of future performance, and such expectations bias evaluations of past performance (Ariely & Carmon, 2000, 2003; Reb & Cropanzano, 2007).
Naïve extrapolation represents an oft-invoked – and oft-unmeasured – explanation for the effects of performance trends (as well as the effects of trends in other literatures; see, e.g.,
Towards this end, we present two studies which directly examine the naïve extrapolation effect (i.e., the influence of performance trends on expectations of future performance, and the influence of future expectations of performance on evaluations of past performance) and how cognitive style moderates this effect. In so doing, our work makes a number of contributions. First, our work contributes to the dynamic performance literature by empirically demonstrating the naïve extrapolation mechanism. Specifically, we demonstrate how trends affect expectations of future performance, and how these expectations mediate the effect of trends on evaluations of past performance. Critically, awareness (and assessment) of this mechanism is what leads to insight regarding its cultural boundaries.
Second, our work outlines cultural influences on naïve extrapolation by demonstrating naïve extrapolation has less impact on evaluations of past performance for decision-makers with a more holistic cognitive style. Moreover, we demonstrate this across nationalities (by comparing evaluations made by American and Chinese participants) and isolate a specific mechanism responsible for the effect (by manipulating holistic cognitive style within a specific nationality in Study 1, and assessing holistic cognitive style as a mediator in Study 2). Taken together with our prior point, our work provides a moderated mediation model outlining the mechanisms and moderators associated with dynamic performance evaluation effects, providing insight for practical interventions to enable less biased performance evaluations.
Finally, and most broadly, by outlining a moderator associated with naïve extrapolation our work contributes to the emerging literature on naïve extrapolation and the evaluation of trends over time. As organizational researchers increasingly begin to consider the effects of time and trends for their studies (e.g., Mitchell, Burch, & Lee, 2014; Mitchell & James, 2001;
Sturman & Trevor, 2001), the implications of our work extend beyond dynamic performance evaluations to dynamic phenomena in organizational research more generally.
Employee performance is dynamic and changes over time (Fisher, 2008; Sturman, Cheramie, & Cashen, 2005). These changes can be temporary (Fisher & Noble, 2004), e.g., due to fluctuations in affective state (Beal, Weiss, Barros, & MacDermid, 2005), or the changes can be permanent, e.g., due to learning (Deadrick et al., 1997). To date only a few studies have examined the influence of dynamic performance characteristics on appraisals of an individual’s performance (Reb & Greguras, 2008). These studies typically focus on (a) mean performance, (b) trend of performance, and (c) variation of performance over a period of time. Past research has found that appraisals are more favorable the higher one’s mean performance (DeNisi & Stevens, 1981; Reb & Cropanzano, 2007). Performance variation – or unsystematic changes over a time period – typically does not significantly impact performance appraisals (e.g., Scott & Hamner, 1975, though see Reb & Greguras, 2010, for conditions when variation may matter).
With respect to performance trends over time, studies have found a strong effect such that the more upward-sloping the trend (i.e., improving over time), the more favorable the
performance appraisal. Thus, an individual whose performance improves receives a better
performance appraisal compared to an individual whose performance decreases (as much as 20% better; Reb & Cropanzano, 2007), even if their mean performance is the same. These findings are disturbing, in that while those with higher performance means over a time period should receive better evaluations, the notion that two individuals with equal performance means should receive radically different performance appraisals, depending on their performance trends, seems unfair.
Typically, this effect of performance trends has been attributed to raters engaging in naïve extrapolation, a process whereby performance trends influence expectations of the
employee’s future performance; these expectations of future performance subsequently influence
evaluation of the employee’s past performance (Ariely & Carmon, 2000, 2003). In other words,
Culture and Cognitive Style
Existing dynamic performance studies have, at least implicitly, assumed that the naïve extrapolation mechanism holds globally and have failed to consider individual or cultural moderating factors. Cultural research on cognitive style questions this assumption. In particular, Eastern and Western cultures differ in their cognitive or thinking style: Eastern cultures tend to view objects and events as interconnected, related, and ever-changing; Western cultures tend to view objects and events as independent, unrelated, and possessing a degree of stability (Nisbett, Peng, Choi, & Norenzayan, 2001). These different cognitive styles may affect the extent to which individuals from these cultures naïvely extrapolate from past performance trends.
The cognitive styles associated with Eastern and Western cultures are referred to as holistic (also referred to as dialectical) thinking and analytic thinking, respectively (Nisbett et al., 2001; Peng & Nisbett, 1999). Holistic thinkers tend to view the world as inherently
interconnected: objects are characterized through their relationships with other objects (Nisbett et al., 2001). Given these relationships are constantly fluctuating, reality itself is viewed as
changeable and able to be described only in a subjective sense (Peng & Nisbett, 1999): what is true today may not necessarily be true tomorrow, as any one of a variety of relationships can change the properties of an object. On the other hand, analytic thinkers tend to view the world as independent: objects are detached from their context and possess individual characteristics (Nisbett et al., 2001). Given the world is viewed as the sum of its parts, reality itself is viewed as stable and able to be characterized by rules and laws (Peng & Nisbett, 1999): what is true today will be true tomorrow, because the properties of an object are unchanging and inviolable.1
These differences in cognitive style are thought to arise from the manner in which Eastern and Western cultures have historically been socially organized (Nisbett et al., 2001). In
1 Although for simplicity we discuss holistic and analytic cognitive styles as though they are separate constructs, we
particular, Eastern cultures view the self as part of a larger set of relationships (Markus & Kitayama, 1991). As such, individuals are less concerned with the self and focus more intensely on social relationships; this focus on relationships extends to everyday objects and events
(Nisbett et al., 2001). On the other hand, Western cultures foster a more independent view of the self, with a focus on individual wants, needs, and objectives (Markus & Kitayama, 1991). This focus on the individual as separate and self-contained extends to everyday objects and events. Consequently, living in interdependent societies leads to viewing the world more holistically as a set of interconnected relationships objects exist within and are influenced by, while living in independent societies leads to viewing the world more as a series of distinct entities wherein objects possess independent properties that separate them from others.
Influence of Cognitive Style on Naïve Extrapolation
We argue that whether one’s cognitive style is more holistic or more analytic may influence the interpretations of trends over time: more holistic thinking leads to viewing the world as ever-changing and cyclical, while more analytic thinking leads to viewing the world as stable and linear (Ji, Nisbett, & Su, 2001). For a more holistic cognitive style, an inevitable consequence of the fundamentally interrelated nature of reality is that things change: objects and events are perceived as unstable and continually transforming (Hideg & Ferris, 2017; Ji, 2008). Thus, one would expect that what is true today will not necessarily be true tomorrow. Indeed, research found that change and reversals are more unexpected and surprising to Americans than Koreans (Choi & Nisbett, 2000), while Chinese considered it more likely than Americans that two kids who fight each other in kindergarten would end up as lovers, that a child from a poor family would become rich, and that a chess champion would lose the next game (Ji et al., 2001).
employee could become a bad employee, or an increasing trend could become a decreasing trend, and vice-versa (Ji et al., 2001). As Ji and colleagues (2001) note, such beliefs are endemic to Eastern Taoist philosophical traditions which denote cyclical change via statements such as
“To shrink something you need to expand it first” (p. 450). As such, the Gestalt of a performance
trend (Reb & Cropanzano, 2007) may be less salient and exert less influence for holistic thinkers. On the other hand, for a more analytic cognitive style, an inevitable consequence of the fundamentally independent nature of reality is that objects and events possess stable inherent characteristics (Ji, 2008). Thus, one would expect that what is true today will also be true tomorrow. In a performance evaluation context, this suggests that observing someone as having an increasing performance trend provides a strong cue that the individual will continue to get better in the future, as such an individual would be viewed as possessing characteristics that caused the increasing trend in the first place (Ji et al., 2001). Thus, objects and events are viewed with a certain degree of “inertia”, implying that objects in motion will stay in motion (Ji, 2008).
Of course, more analytic thinking does not rule out change entirely, and more holistic thinking does not assume the world changes at random; rather, what we describe here are
differences in expectations that more holistic and analytic thinking engender regarding frequency of change. With more holistic thinking, change is a more natural and frequently occurring event, and as a result, trends should be less salient and diagnostic; with more analytic thinking, change is rare and all else being equal, stability of characteristics should be assumed, and as a result, trends should be highly salient and impactful. Given naïve extrapolation is premised on the notion that trends provide information about what future performance will look like because they are extrapolated into the future, yet those with a more holistic cognitive style view the future as unstable and changing, we argue naïve extrapolation effects should be weaker for those with a more holistic cognitive style. More formally, we hypothesize:
performance will interact with cognitive style, such that the effect will be weaker for raters with a more holistic cognitive style.
By moderating the influence of performance trends on expectations of future performance, we argue that those with a more holistic cognitive style are also less likely to demonstrate effects of performance trends on evaluations of past performance. In particular, the naïve extrapolation effect – which argues that we extrapolate from past performance trends to predict future performance, and these expectations of future performance influence how we evaluate that past performance (Ariely & Carmon, 2000, 2003) – suggests that the effect of performance trends (our independent variable) on evaluations of past performance (our dependent variable) operates through its effect on expectations of future performance (our mediating variable). In positioning cognitive style as a moderator of the effect of performance trends on expectations of future performance, we are in effect adding a moderator on the first stage of a mediation model – otherwise known as moderated mediation (Edwards & Lambert, 2007). Consequently, we would expect the indirect effect of performance trend on evaluations of past performance to be lessened for raters with a more holistic cognitive style.
Hypothesis 2 (H2): Cognitive style moderates the mediating effect of expectations of future performance between performance trends and evaluations of past performance, such that it will be weaker for raters with a more holistic cognitive style.
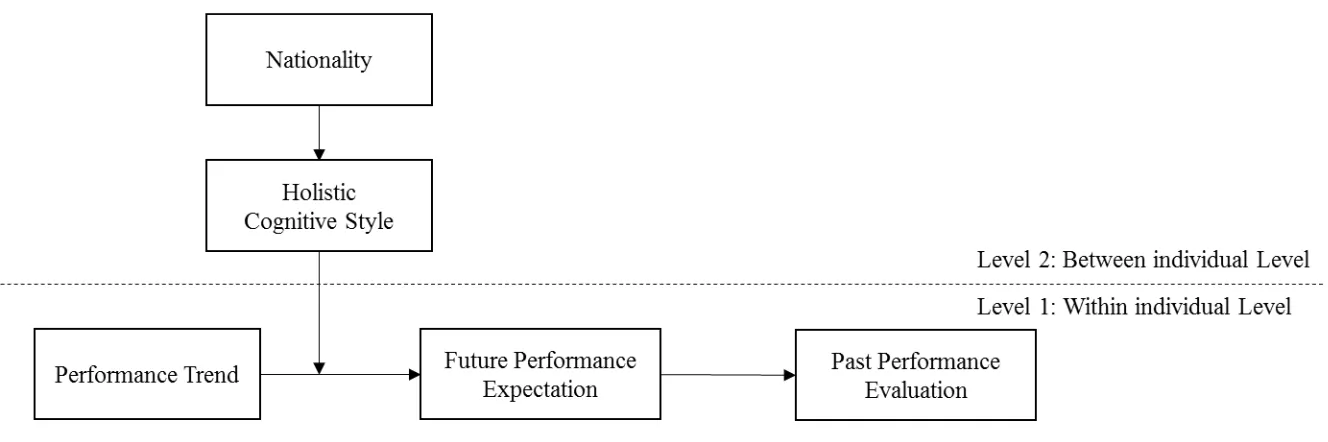
more holistic cognitive style compared to Western nationality participants, and whether these differences in holistic cognitive style mediated the moderating effect of nationality on the relation between performance trends and expectations of future performance (see Figure 1).
Hypothesis 3(H3): The moderating effect of nationality on the relation between performance trends and expectations of future performance is mediated by holistic cognitive style.
We conducted two studies to test our hypotheses. First, to demonstrate cognitive style is responsible for moderating naïve extrapolation effects, in Study 1 we tested H1 and H2 by experimentally manipulating cognitive style within a sample of Singaporeans. In Study 2, we tested H3 using an American and a Chinese sample, where we expected the moderating effect of participant nationality on the effects of performance trend on expectations of future performance to be mediated by participant nationality’s effect on holistic cognitive style.
Study 1
Method
Participants and design. Seventy-six Singaporean Chinese undergraduate students from
a Singaporean university participated in the study for course credit. Forty-seven percent of the sample was male and the average age was 21.8 years. The study had a mixed 2 (trend:
deteriorating vs. improving) x 2 (mean: negative vs. positive) x 2 (variation: small vs. large) x 2 (cognitive style: analytic vs. holistic) design with dynamic performance characteristics
manipulated within-subjects and cognitive style manipulated between-subjects.
Procedure and materials. The procedure and materials used were taken from Reb and
reviewed for each hypothetical employee consisted of a graph depicting 26 data points (one per week over a span of 26 weeks) indicating the dollar amount the employee contributed to
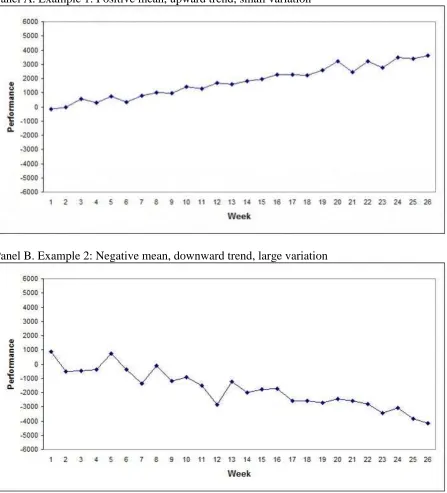
company revenues relative to the long-term average revenue employees contributed in this job. All three dynamic performance characteristics were manipulated within-subjects. Mean revenue contribution of an employee, relative to the company’s long-term average, was either negative (–$1,800) or positive (+$1,800). Performance variation was either relatively small (SD = $200) or relatively large (SD = $600). To create the different performance profiles, 26 (i.e., one per week) random numbers were drawn from a normal distribution with the respective mean and standard deviation required by the experimental condition. The trend manipulation was
implemented by either subtracting $150 per week (deteriorating trend) or adding $150 per week (improving trend). Panel A (B) of Figure 2 displays a profile resulting from this process with positive (negative) mean, small (large) variation, and an improving (deteriorating) trend.
Before doing the performance evaluation task participants completed a previously validated priming task by Spina et al. (2010); this manipulation has been shown to induce more holistic or more analytic reasoning in participants.2 All participants first read the following:
Getting into a competitive university such as X University is a major achievement. The majority of high school students do not make it into any university at all, and a large number of applicants to X University are turned away every year.
In the analytic condition, participants then listed the most significant event in their life that had enabled them to get into university and described how it had done so. They also completed a diagram consisting of two ellipses, one labeled Event and the other Getting into X University, by writing the significant event in the event ellipse and by drawing an arrow between it and the
getting into X University’s ellipse. In the holistic condition, participants listed the three most
significant events and described how the three events had influenced each other. The diagram
2 In a separate sample we demonstrated the manipulation successfully influenced participant holistic cognitive styles
they had to complete consisted of four ellipses, three on the periphery labeled Event and one in the center labeled Getting into X University. After writing the three events in the event ellipses, participants drew arrows from each one to the X’s University ellipse. Instead of simply drawing arrows between Event and Getting into X University, they had to draw arrows connecting the three events to describe how these events had influenced or interacted with each other. Thus, while the analytic prime focused each participant’s attention on a single cause that had led to a major event in his or her life, the holistic prime focused participants’ attention on a larger causal field and on the interconnectedness of causes within that field.
Measures and analytical strategy.
Expectations of future performance. Participants indicated on a 5-point scale how
confident they are that this employee will do well in the future (1 = not at all, 5 = very).
Evaluation of past performance. Supervisors rated the employee’s performance over the
past six months by selecting a number between –100 (“worst performance”) and 100 (“best
performance”) in steps of 20. A scale with a wide range was used to allow for a differentiation of
the various profiles of the different ratees.
We used multilevel structural equation modeling (MSEM, Preacher, Zyphur, & Zhang, 2010) with MPLUS 6.0 (Muthén & Muthén, 2010) to test our hypotheses. MSEM allowed us to estimate the Level 1 (within-individual level) effects of trend, the Level 2 (between-individual level) effects of cognitive style, as well as the cross-level effects (trend x cognitive style) on expectations of future performance, which in turn were hypothesized to affect past performance evaluation. Performance variance and mean were treated as Level 1 control variables, and gender was treated as a Level 2 control variable. Following Preacher and colleagues’ (2010)
Preacher, & Gil, 2006), and the random effect of trend on expectations of future performance was predicted by the Level-2 moderator (i.e., cognitive style). To test the overall moderated mediation model, we used Edwards and Lambert’s (2007) path analytic approach to calculate the mediating effects at high and low levels of the moderator. To derive the significance of the indirect effects, we used a Monte Carlo simulation approach, which generates a sampling distribution of the indirect effects (Preacher & Selig, 2012). We generated 100,000 simulated parameter sets, and constructed 95% confidence intervals for the indirect effects.
Results and Discussion
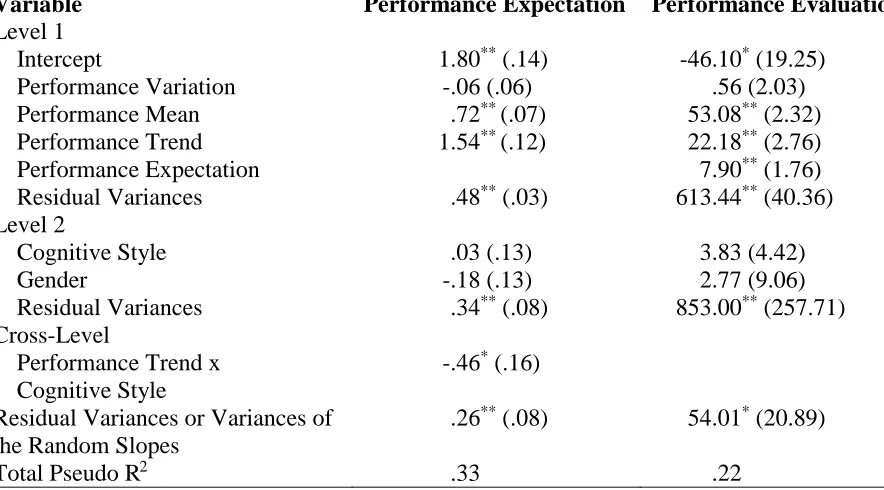
Means, standard deviations, and correlations are presented in Table 1. Performance trend significantly affected ratings such that improving trends caused higher expectations of future performance ( = 1.54, p < .001, see Table 2) and more favorable evaluations of past
performance ( = 22.18, p < .001), while performance mean significantly affected ratings such that higher mean caused higher expectations of future performance ( = .72, p < .001) and more favorable evaluations of past performance ( = 53.08, p < .001).
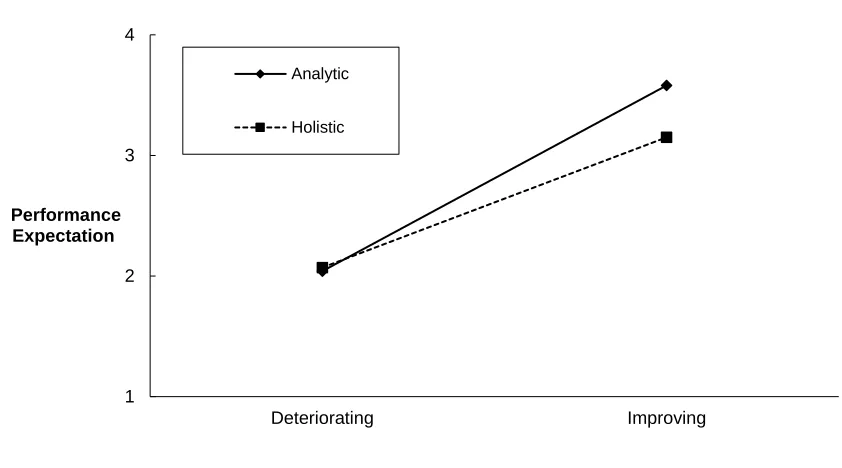
As predicted (H1), the interaction between trend and cognitive style on expectations of future performance was significant ( = -.46, p < .01, see Table 2; ∆Pseudo R2= .02). Both
holistic ( = 1.08, p < .001) and analytic style ( = 1.54, p < .001) raters gave more favorable evaluations to the upward trend than to the downward trend, but trend had a weaker impact in the holistic than the analytic condition. Specifically, there was a significant difference between the conditions when trend was improving, = -.43, p < .01 (holistic M = 3.15, analytic M = 3.58, see Figure 3). When trend was deteriorating, the difference was not significant, = .03, n.s., (holistic M = 2.07, analytic M = 2.04).
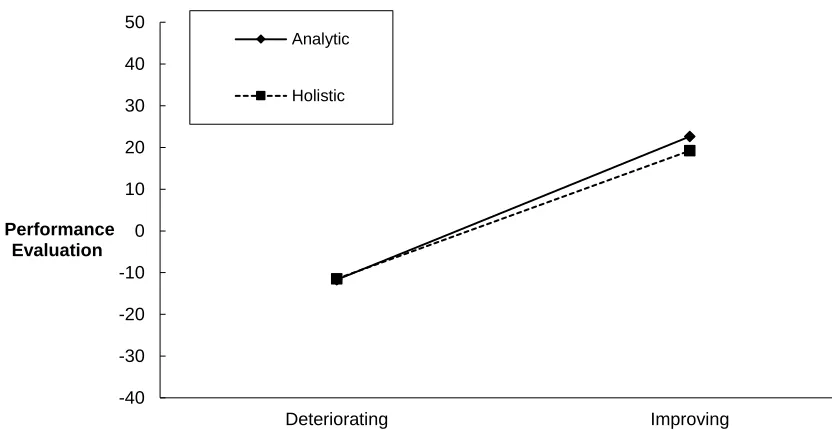
and analytic condition (Indirect Effect = 12.15, 95% CI [6.72, 17.93]) raters gave more favorable evaluations to the upward than to the downward trend, but trend had a weaker impact in the holistic than the analytic condition. Specifically, we found that there was a significant difference between the holistic (M = 19.22) and analytic (M = 22.62) condition when trend was improving, = -3.36, 95% CI [-6.62, -.79] (see Figure 4; this was not the case when trend was deteriorating, = .25, 95% CI [-1.87, 2.45], (holistic M = -11.48, analytic M = -11.72).
The results of Study 1 demonstrate that more holistic thinkers are less likely to engage in naïve extrapolation compared to more analytic thinkers. In Study 2, we examined whether a more holistic cognitive style also mediated the moderating effect of nationality on the relation between performance trends and expectations of future performance.
Study 2
Method
Participants and design. Participants were full-time employees from the United States
of America (USA; n = 199) and the People’s Republic of China (PRC; n = 209); after removing participants who failed an attention check or completed the survey in an unrealistically short or long time, our final sample included 187 and 186 participants from the USA and PRC,
respectively. For the USA sample, 63% were male (average age = 32.8 years, SD = 9.5); for the PRC sample, 51% were male (average age = 34.3, SD = 8.2 years). USA participants were recruited on Amazon Mechanical Turk and were paid USD $4.50 while PRC participants were recruited on SoJump, an equivalent platform in the PRC, and were paid approximately USD $4.
Procedure and materials. The study procedure was the same as Study 1 except that we
did not manipulate but rather measured participants’ holistic cognitive style before the dynamic
performance characteristics manipulations. Chinese materials were translated from the English using common back-translation procedures (Brislin, 1970).
of past performance were measured as in Study 1. Holistic cognitive style was assessed using a 14-item measure (Spencer-Rodgers et al., 2010) with a 7-point Likert response scale (1 = strongly disagree, 7 = strongly agree; = .88 and .77 for USA and PRC samples, respectively), where higher scores indicate a more holistic cognitive style. A sample item is “I often find that my beliefs and attitudes will change under different contexts.”
We used the same analytical strategy as in Study 1 except that we focused on and tested a Type II mediated moderation model (Liu, Zhang, and Wang, 2012) built on the model tested in Study 1. As illustrated in Figure 1, performance trend was a Level 1 independent variable predicting expectations of future performance, which in turn predicted evaluation of past
performance, and nationality was a Level 2 moderator whose moderating effect was mediated by holistic cognitive style as a Level 2 proximal moderator.
Results
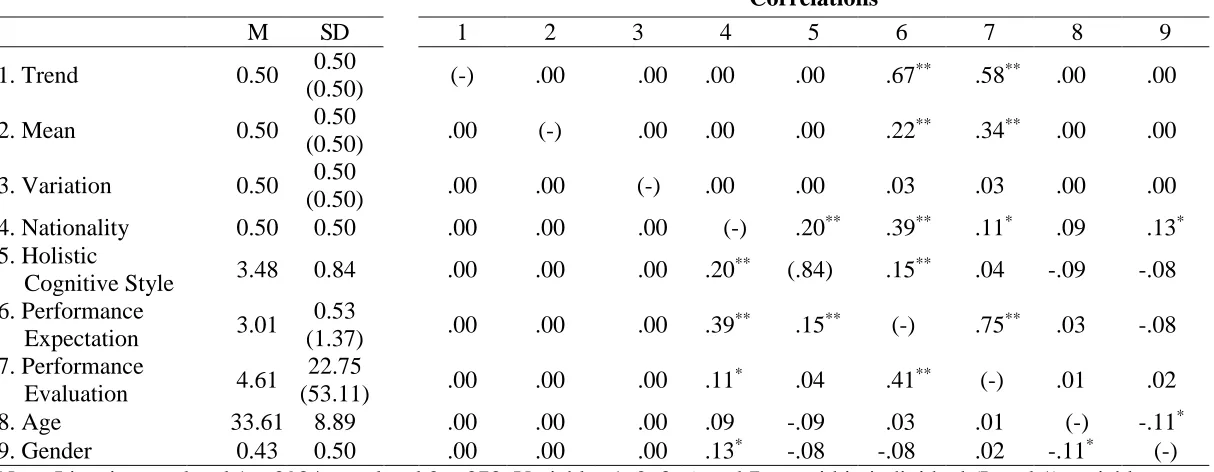
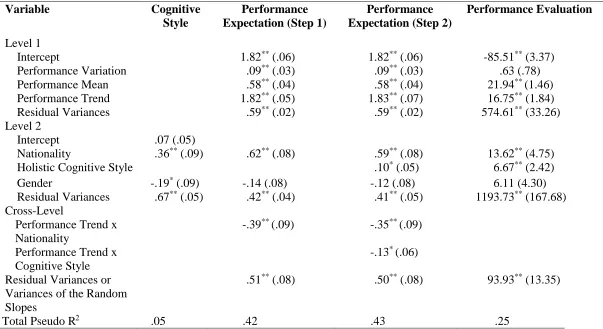
Means, standard deviations, and correlations are presented in Table 3. Consistent with Study 1, performance trend significantly affected ratings such that improving trends caused higher expectations of future performance ( = 1.83, p < .001, see Table 4), while performance mean significantly affected ratings such that higher mean caused higher expectations of future performance ( = .58, p < .001).
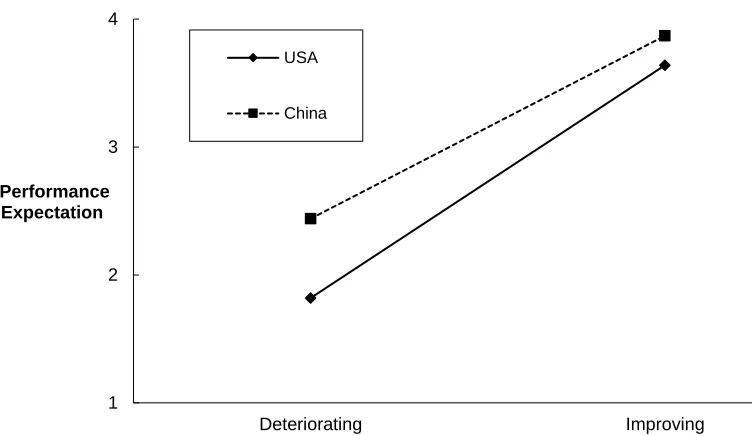
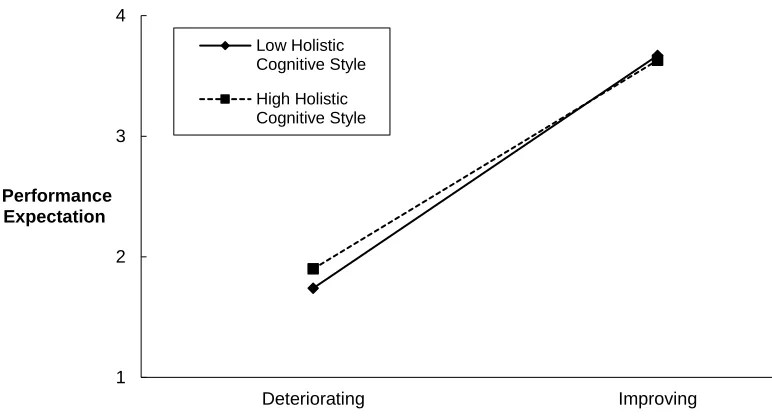
negative predictions than Chinese participants when the performance trend was deteriorating. Nationality also had a significant effect on holistic cognitive style such that Chinese raters exhibited a more holistic style than American raters ( = .36, p < .001, see Table 4; ∆Pseudo R2= .01). Moreover, in support of H1, the interaction between trend and holistic
cognitive style on expectations of future performance was significant ( = -.13, p < .05, see Table 4, Step 2). We plotted the interaction at +/- one standard deviation on the holistic cognitive style measure. Both low ( = 1.93, p < .001) and high holistic cognitive style ( = 1.72, p < .001) raters had more favorable expectations to the upward trend than to the downward trend, but trend had a stronger impact on low holistic cognitive style raters than on high holistic style raters (see Figure 6). Specifically, we found that there was a significant difference between low and high holistic cognitive style when trend was deteriorating, = .10, p < .05, (high holistic M = 1.90, low holistic M = 1.74). When trend was improving, the difference was not significant, = -.02, n.s., (high holistic M = 3.63, low holistic M = 3.67). This suggests that the interaction between holistic cognitive style and performance trend was driven mostly by less favorable predictions of a deteriorating trend for those with a lower holistic cognitive style as compared to those with a higher holistic cognitive style. Finally, in support of H3, the indirect moderating effect of nationality through the mediating role of holistic cognitive style on the effect of trend on performance expectation was significant (Indirect Effect = -.05, 95% CI [-.10, -.0002]).3
General Discussion
In finding an interaction between cognitive style and performance trend, our research makes contributions to the dynamic performance and naïve extrapolation literatures, and the literature on trends more generally. Our contributions to the dynamic performance literature are
3 We deleted a participant whose score on the holistic cognitive style scale was extremely high (at 3.62 SD above the
twofold. To date, research on dynamic performance has largely ignored the role that culture or nationality can play (as well as the role of individual differences more broadly, despite the fact that it affects the generalizability of the findings). This is potentially concerning, given the use of non-Western samples has proliferated (Ryan, Leong, & Oswald, 2012). Our work highlights how consideration of culture can complicate findings in the dynamic performance literature, and suggests a need to better consider the role culture plays in dynamic performance assessment. Beyond demonstrating the importance of culture, our work also specifies the specific mechanism through which culture might influence dynamic ratings: via its effect on cognitive style. Our work particularly suggests naïve extrapolation effects may be less pronounced for more holistic thinkers. As dynamic performance research proliferates (Sturman, 2007), we encourage
researchers to consider the extent to which these findings may be influenced by culture or nationality, as well as considering the specific ways through which these effects are manifested.
Our work also contributes to the naïve extrapolation literature by addressing calls (e.g., Ariely & Carmon, 2000) to more directly assess naïve extrapolation effects, i.e., that
perceptions. As researchers examine temporal effects (Mitchell & James, 2001), our results argue against assuming such effects are equally strong across culture and cognitive style. Of course, future research demonstrating the robustness of our findings in these other research domains is also necessary, and would help establish the generalizability of our findings.
Strengths, Limitations, Future Directions, and Practical Implications
Our work has a number of strengths: First, we conceptually replicate our findings across two studies, both manipulating and measuring our moderating mechanism. Second, given our use of random assignment to conditions, Study 1 helps minimize the possibility that other individual differences may be responsible for our moderating effects. Finally, by demonstrating our effects within a single nationality in Study 1, we also reduce the likelihood that culture-specific response biases (e.g., to favor the midpoint on scales) may be responsible for our observed results.
Nevertheless, our studies have limitations. Our Study 1 participants were students evaluating hypothetical organizational employees, raising generalizability concerns. Yet given cognitive style and naïve extrapolation biases should be unaffected by whether one is a student or a manger, we believe our results should generalize to non-experimental contexts.4 Supporting this perspective, past research on performance trend effects has found similar findings across student and manager raters (Reb & Greguras, 2010). Our model may also oversimplify the managerial decision-making process, in that it is likely that evaluations of past performance are also influencing predictions of future performance in concert with the influence of predictions of future performance on evaluations of past performance. In this sense, our results are best viewed as capturing a snapshot of one direction of this bidirectional relation between the variables.
Our theoretical model generally suggests that factors influence the extent to which individuals view trends as diagnostic of future performance, altering the magnitude of naïve
4 We also controlled for whether or not participants had experience evaluating others as part of a job; controlling for
extrapolation effects. A promising direction for future research is to examine attributions for past performance – for example, whether the performance is viewed as being due to the individual (e.g., due to fundamental attribution error biases) or external circumstances (e.g., a generally improving sales market) – as a moderator. As individuals who attribute trends to external circumstances may be less likely to view trends as indicative of future performance, attributions fit within the theoretical model we put forth and illustrate how it can generate new research.
Given performance evaluations are part and parcel of employment relationships, our work has potentially profound implications for how performance evaluations are carried out, particularly for cross-cultural teams or expatriates working in cultures with different cognitive styles than their home countries. A Western expatriate working in Asia may look at their improving performance and feel they deserve a commensurate performance evaluation, but Asian managers may be less swayed by performance trends – potentially leading to a clash between the employee and manager. Similarly, employees in cross-cultural teams may hold diverse perceptions on how their teammates are performing, leading analytic thinkers to be harsher on teammates who have recently performed poorly compared to more holistic thinkers.
Finally, we should particularly emphasize to managers that the effect of performance trends occur above and beyond the effect of performance mean (and performance variation). That is, individuals who have the same average performance can have significantly different performance evaluations simply due to whether or not their performance increased or decreased over time. As a matter of fairness, this is troubling, and managers – particularly Western
References
Ariely, D. (1998). Combining experiences over time: The effects of duration, intensity changes and on-line measurements on retrospective pain evaluations. Journal of Behavioral Decision Making, 11(1), 19-45.
Ariely, D., & Carmon, Z. (2000). Gestalt characteristics of experiences: The defining features of summarized events. Journal of Behavioral Decision Making, 13, 191-201.
Ariely, D., & Carmon, Z. (2003). Summary assessment of experiences: The whole is more than the sum of its parts. In Loewenstein, G., Read, D., & Baumeister, R. (Eds.), Time and decision: Economic and psychological perspectives on intertemporal choice. New York: Russell Sage Foundation.
Barnes, C. M., Reb, J., & Ang, D. (2012). More than just the mean: Moving to a dynamic view of performance-based compensation. Journal of Applied Psychology, 97(3), 711-718. Bauer, D. J., Preacher, K. J., & Gil, K. M. (2006). Conceptualizing and testing random indirect
effects and moderated mediation in multilevel models: New procedures and recommendations. Psychological Methods, 11, 142–163.
Beal, D. J., Weiss, H. M., Barros, E., & MacDaniel, S. M. (2005). An episodic process model of affective influences on performance. Journal of Applied Psychology, 90, 1054-1068. Brislin, R. (1970). Back-translation for cross-cultural research. Journal of Cross-Cultural
Psychology, 1, 185–216.
Cardy, R. L., & Dobbins, G. H. (1994). Performance appraisal: Applied perspectives. Cincinnati, OH: South-Western Publishing.
Chen, G., Ployhart, R. E., Thomas, H. C., Anderson, N., & Bliese, P. D. (2011). The power of momentum: A new model of dynamic relationships between job satisfaction change and turnover intentions. Academy of Management Journal, 54(1), 159-181.
examine dynamic performance criteria over time. Journal of Management, 23, 745-757. DeNisi, A., & Stevens, G. E. (1981). Profiles of performance, performance evaluations, and
personnel decisions. Academy of Management Journal, 24, 592-602.
Edwards, J.R., & Lambert L.S. (2007). Methods for integrating moderation and mediation: A general analytical framework using moderated path analysis. Psychological Methods, 12, 1-22.
Farh, J-L., Earley, P. C., & Lin, S-C. (1997). Impetus for action: A cultural analysis of justice and organizational citizenship behavior in Chinese society. Administrative Science Quarterly, 42, 421-444.
Fisher, C. D. (2008). What if we took within-person performance variability seriously? Industrial and Organizational Psychology, 1, 185-189.
Fisher, C. D., & Noble, C. S. (2004). A within-person examination of correlates of performance and emotions while working. Human Performance, 17, 145-168.
Hausknecht, J. P., Sturman, M. C., & Roberson, Q. M. (2011). Justice as a dynamic construct: Effects of individual trajectories on distal work outcomes. Journal of Applied
Psychology, 96(4), 872-880.
Hideg, I., & Ferris, D. L. (2017). Dialectical thinking and fairness-based perspectives on affirmative action. Journal of Applied Psychology, 102, 782-801.
Ji, L. J. (2008). The leopard cannot change his spots, or can he? Culture and the development of lay theories of change. Personality and Social Psychology Bulletin, 34, 613– 622.
Ji, L. J., Nisbett, R. E., & Su, Y. (2001). Culture, change and prediction. Psychological Science, 12, 450-456.
Lee, H., & Dalal, R. S. (2011). The effects of performance extremities on ratings of dynamic performance. Human Performance, 24, 99-118.
moderated mediation: Theorization and test. In Chen, X., Tsui, A., and Farh, L. (Eds.) Management Research Methods (in Chinese). Beijing: Peking University Press.
Loewenstein, G. F., & Prelec, D. (1993). Preferences for sequences of outcomes. Psychological Review, 100(1), 91.
Markus, H. R., & Kitayama, S. (1991). Culture and the self: Implications for cognition, emotion, and motivation. Psychological review, 98(2), 224-253.
Mitchell, T. R., & James, L. R. (2001). Building better theory: Time and the specification of when things happen. Academy of Management Review, 26(4), 530-547.
Mitchell, T. R., Burch, T. C., & Lee, T. W. (2014). The need to consider time, level, and trends: A turnover perspective. Journal of Organizational Behavior, 35(2), 296-300.
Muthén, L. K., & Muthén, B. O. (2010). Mplus User’s Guide. (6th ed.), Los Angeles, CA: Muthén & Muthén.
Nisbett, R.E., Peng, K., Choi, I., & Norenzayan, A. (2001). Culture and systems of thought: Holistic versus analytic cognition. Psychological Review, 108, 291-310.
Peng, K., & Nisbett, R. E. (1999). Culture, dialectics, and reasoning about contradiction. American Psychologist, 54(9), 741-754.
Preacher, K. J., & Selig, J. P. (2012). Advantages of Monte Carlo confidence intervals for
indirect effects. Communication Methods and Measures, 6(2), 77-98.
Preacher, K. J., Zyphur, M. J., & Zhang, Z. (2010). A general multilevel SEM framework for
assessing multilevel mediation. Psychological Methods, 15(3), 209.
Reb, J., & Cropanzano, R. (2007). Evaluating dynamic performance: The influence of salient Gestalt characteristics on performance ratings. Journal of Applied Psychology, 92(2), 490-499.
Practice, 1(2), 194-196.
Reb, J., & Greguras, G. J. (2010). Understanding performance ratings: Dynamic performance, attributions, and rating purpose. Journal of Applied Psychology, 95(1), 213-220.
Ryan, A. M. E., Leong, F. T., & Oswald, F. L. (2012). Conducting multinational research: Applying organizational psychology in the workplace. American Psychological Association.
Scott, W. E. Jr., & Hamner, W. C. (1975). The influence of variations in performance profiles on the performance evaluation process: An examination of the validity of the criterion.
Organizational Behavior and Human Performance, 14, 360-370.
Snijders, T. A.B., & Bosker, R. J. (1999). Multilevel analysis: An introduction to basic and advanced multilevel modeling. London: Sage Publishers.
Spencer-Rodgers, J., Srivastava, S., Boucher, H. C., English, T., Paletz, S. B., Wang, L., & Peng, K. (2010). The dialectical self scale. Unpublished manuscript, University of California, Santa Barbara.
Spina, R. R., Ji, L. J., Guo, T., Zhang, Z., Li, Y., & Fabrigar, L. (2010). Cultural differences in the representativeness heuristic: Expecting a correspondence in magnitude between cause and effect. Personality and Social Psychology Bulletin, 35(5), 583-597.
Sturman, M. C. (2007). The past, present, and future of dynamic performance research. Research in Personnel and Human Resources Management, 26, 49-110.
Sturman, M. C., Cheramie, R. A., & Cashen, L. H. (2005). The impact of job complexity and performance measurement on the temporal consistency, stability, and test--retest reliability of employee job performance ratings. Journal of Applied Psychology, 90, 269-283.
Table 1. Study 1 Means, Standard Deviations, and Correlations
Correlations
M SD 1 2 3 4 5 6 7 8
1. Trend 0.50 0.50
(0.50) (-) .00 .00 .00 .56
** .35** .00 .00
2. Mean 0.50 0.50
(0.50) .00 (-) .00 .00 .30
** .64** .00 .00
3. Variation 0.50 0.50
(0.50) .00 .00 (-) .00 -.03 .00 .00 .00
4. Cognitive Style 0.50 0.50 .00 .00 .00 (-) -.14 .04 .11 -.16
5. Performance
Expectation 2.70
0.53
(1.17) .00 .00 .00 -.14 (-) .49
** .19 -.04
6. Performance
Evaluation 7.37
18.64
(45.97) .00 .00 .00 .04 .07 (-) -.05 -.09
7. Age 21.83 1.60 .00 .00 .00 .11 .19 -.05 (-) -.70**
8. Gender 0.53 0.50 .00 .00 .00 -.16 -.04 -.09 -.70** (-)
Note. Listwise n at level 1 = 608; n at level 2 = 76. Variables 1, 2, 3, 5, and 6 are within individual (Level 1) variables, variables 4, 7 and 8 are between-person (Level 2) variables. Within person correlations are shown above the diagonal and are based on within-person scores; between-person correlations are shown below the diagonal and are based on between-person scores. Correlations with cognitive style, age and gender are based on between level scores and are shown below and above the diagonal. Means and SDs are based on between-person scores; SDs in parenthesis are based on within individual scores. For cognitive style, 0 = analytic cognitive style and 1 = holistic cognitive style. For gender, male = 0 and female = 1.
* p < .05. ** p < .01.
Table 2. MSEM Results: The Moderated Effect of Cognitive Style on the Relation between Performance Trend and Evaluations of
Past Performance through the Mediating Effect of Expectations of Future Performance (Study 1)
Variable Performance Expectation Performance Evaluation
Level 1
Intercept 1.80** (.14) -46.10* (19.25)
Performance Variation -.06 (.06) .56 (2.03)
Performance Mean .72** (.07) 53.08** (2.32)
Performance Trend 1.54** (.12) 22.18** (2.76)
Performance Expectation 7.90** (1.76)
Residual Variances .48** (.03) 613.44** (40.36)
Level 2
Cognitive Style .03 (.13) 3.83 (4.42)
Gender -.18 (.13) 2.77 (9.06)
Residual Variances .34** (.08) 853.00** (257.71)
Cross-Level
Performance Trend x Cognitive Style
-.46* (.16)
Residual Variances or Variances of the Random Slopes
.26** (.08) 54.01* (20.89)
Total Pseudo R2 .33 .22
Note. Values are unstandardized regression coefficients (standard error estimates listed in parentheses). For cognitive style, 0 = analytic cognitive style and 1 = holistic cognitive style. For gender, male = 0 and female = 1. Total Pseudo R squared is calculated
according to Snijders & Bosker’s (1999) formulas. *p < .05
Table 3. Study 2 Means, Standard Deviations, and Correlations
Correlations
M SD 1 2 3 4 5 6 7 8 9
1. Trend 0.50 0.50
(0.50) (-) .00 .00 .00 .00 .67
** .58** .00 .00
2. Mean 0.50 0.50
(0.50) .00 (-) .00 .00 .00 .22
** .34** .00 .00
3. Variation 0.50 0.50
(0.50) .00 .00 (-) .00 .00 .03 .03 .00 .00
4. Nationality 0.50 0.50 .00 .00 .00 (-) .20** .39** .11* .09 .13* 5. Holistic
Cognitive Style 3.48 0.84 .00 .00 .00 .20
** (.84) .15** .04 -.09 -.08
6. Performance
Expectation 3.01
0.53
(1.37) .00 .00 .00 .39
** .15** (-) .75** .03 -.08
7. Performance
Evaluation 4.61
22.75
(53.11) .00 .00 .00 .11
* .04 .41** (-) .01 .02
8. Age 33.61 8.89 .00 .00 .00 .09 -.09 .03 .01 (-) -.11*
9. Gender 0.43 0.50 .00 .00 .00 .13* -.08 -.08 .02 -.11* (-)
Note. Listwise n at level 1 = 2984; n at level 2 = 373. Variables 1, 2, 3, 6, and 7 are within individual (Level 1) variables; variables 4, 5, 8, and 9 are between-person (Level 2) variables. Within person correlations are shown above the diagonal and are based on within-person scores; person correlations are shown below the diagonal and are based on between-person scores. Correlations with holistic cognitive style, nationality, age and gender are based on between level scores and are shown below and above the diagonal. Means and SDs are based on between-person scores; SDs in parenthesis are based on within individual scores. For gender, male = 0 and female = 1; for nationality, USA = 0, PRC = 1.
* p < .05. ** p < .01.
Table 4. MSEM Results: The Moderating Effect of Nationality, and the Mediated Moderating Effect of Nationality through Holistic
Cognitive Style on the Relation between Performance Trend and Expectations of Future Performance (Study 2)
Variable Cognitive
Style
Performance Expectation (Step 1)
Performance Expectation (Step 2)
Performance Evaluation
Level 1
Intercept 1.82** (.06) 1.82** (.06) -85.51** (3.37)
Performance Variation .09** (.03) .09** (.03) .63 (.78)
Performance Mean .58** (.04) .58** (.04) 21.94** (1.46)
Performance Trend 1.82** (.05) 1.83** (.07) 16.75** (1.84)
Residual Variances .59** (.02) .59** (.02) 574.61** (33.26)
Level 2
Intercept .07 (.05)
Nationality .36** (.09) .62** (.08) .59** (.08) 13.62** (4.75)
Holistic Cognitive Style .10* (.05) 6.67** (2.42)
Gender -.19* (.09) -.14 (.08) -.12 (.08) 6.11 (4.30)
Residual Variances .67** (.05) .42** (.04) .41** (.05) 1193.73** (167.68) Cross-Level
Performance Trend x Nationality
-.39** (.09) -.35** (.09)
Performance Trend x Cognitive Style
-.13* (.06)
Residual Variances or Variances of the Random Slopes
.51** (.08) .50** (.08) 93.93** (13.35)
Total Pseudo R2 .05 .42 .43 .25
Note. Values are unstandardized regression coefficients (standard error estimates listed in parentheses). For gender, male = 0 and female = 1; for nationality, USA = 0, PRC = 1. Total Pseudo R squared is calculated according to Snijders & Bosker’s (1999) formulas.
Figure 2. Examples of Dynamic Performance Profiles
Panel A. Example 1: Positive mean, upward trend, small variation
Figure 3. Interaction between Cognitive Style and Performance Trend on Expectations of Future
Performance, Study 1
1 2 3 4
Deteriorating Improving
Performance Expectation
Performance Trend Analytic
Figure 4. The Indirect (Mediated) Effect of Performance Trend on Evaluations of Past
Performance for Analytic and Holistic Cognitive Style, Study 1
-40 -30 -20 -10 0 10 20 30 40 50
Deteriorating Improving
Performance Evaluation
Performance Trend Analytic
Figure 5. Interaction between Nationality and Performance Trend on Expectations of Future
Performance, Study 2
1 2 3 4
Deteriorating Improving
Performance Expectation
Performance Trend USA
Figure 6. Interaction between Cognitive Style and Performance Trend on Expectations of Future
Performance, Study 2
1 2 3 4
Deteriorating Improving
Performance Expectation
Performance Trend Low Holistic
Cognitive Style
Appendix: Supplemental Analyses on Interaction between Performance Mean and
Cognitive Style
Although we have primarily focused on performance trend when discussing naïve extrapolation effects – i.e., individuals naïvely extrapolate past trends into the future – it is also possible that naïve extrapolation effects may emerge with performance mean as well. That is, individuals may extrapolate from employee’s past mean performance (high or low) to
expectations of future performance as well: someone who does well (on average) may be expected to continue doing well. On the other hand, such naïve extrapolation effects may be unlikely to emerge for performance means: naïve extrapolation is primarily thought to occur in the presence of trends over time (Ariely & Carmon, 2000, 2003), and such effects arguably may require trends over time to activate relevant Gestalt characteristics which influence expectations of future performance (Reb & Cropanzano, 2007). Given the lack of concrete expectations derivable from theory one way or the other, we decided to conduct supplemental exploratory analyses regarding the interaction between performance mean and nationality.
In Study 1, the interaction between performance mean and cognitive style on
expectations of future performance was not significant ( = -.19, n.s., see Table A1). Similarly, in Study 2, the interaction between performance mean and cognitive style on expectations of future performance was not significant ( = -.02, n. s., see Table A2). Perhaps notably, the interaction between performance mean and nationality was significant, but the amount of
Table A1. MSEM Results: The Moderated Effect of Cognitive Style on the Relation between
Performance Mean and Evaluations of Past Performance through the Mediating Effect of Expectations of Future Performance (Study 1)
Variable Performance Expectation Performance Evaluation
Level 1
Intercept 1.76** (.15) -46.05* (19.06)
Performance Variation -.06 (.06) .58 (2.03)
Performance Trend 1.31** (.09) 22.19** (2.76)
Performance Mean .81** (.10) 53.02** (2.32)
Performance Expectation 7.98** (1.76)
Residual Variances .48** (.03) 613.54** (40.37)
Level 2
Cognitive Style -.01 (.16) 4.35 (4.52)
Gender -.05 (.15) 2.79 (9.20)
Residual Variances .35** (.09) 848.89** (256.50)
Cross-Level
Performance Mean x Cognitive Style
-.19 (.15)
Residual Variances or Variances of the Random Slopes
.13* (.06) 54.05** (20.91)
Total Pseudo R2 .32 .22
Note. Values are unstandardized regression coefficients (standard error estimates listed in
parentheses). For cognitive style, 0 = analytic cognitive style and 1 = holistic cognitive style. For gender, male = 0 and female = 1. Total Pseudo R squared is calculated according to Snijders &
Bosker’s (1999) formulas. *p < .05
Table A2. MSEM Results: The Moderating Effect of Nationality, and the Mediated Moderating
Effect of Nationality through Cognitive Style on the Relation between Performance Mean and Expectations of Future Performance (Study 2)
Variable Performance
Expectation (Step 1)
Performance Expectation (Step 2)
Level 1
Intercept 1.83** (.06) 1.82** (.06)
Performance Variation .09** (.03) .09** (.03) Performance Mean .58** (.04) .57** (.05) Performance Trend 1.82** (.07) 1.82** (.05) Residual Variances .69** (.03) .69** (.03) Level 2
Intercept
Gender -.15* (.01) -.14* (.07)
Nationality .56** (.07) .55** (.07)
Holistic Cognitive Style .03 (.04)
Residual Variances .23** (.03) .23** (.03) Cross-Level
Performance Mean x Nationality
-.28** (.07) -.28** (.09)
Performance Mean x Holistic Cognitive Style
.02(.05)
Residual Variances of the Random Slopes
.16** (.04) .16** (.04)
Total Pseudo R2 .48 .48
Note. Values are unstandardized regression coefficients (standard error estimates listed in parentheses). For gender, male = 0 and female = 1; for nationality, USA = 0, PRC = 1. Total
Pseudo R squared is calculated according to Snijders & Bosker’s (1999) formulas. *p < .05