This is a repository copy of Global Small-Angle X-ray Scattering Data Analysis of Triacylglycerols in the α-Phase (Part II).
White Rose Research Online URL for this paper: http://eprints.whiterose.ac.uk/138127/
Version: Accepted Version
Article:
Ladd Parada, M orcid.org/0000-0003-1355-649X, Sadeghpour, A
orcid.org/0000-0002-0475-7858, Vieira, J et al. (2 more authors) (2018) Global
Small-Angle X-ray Scattering Data Analysis of Triacylglycerols in the α-Phase (Part II). Journal of Physical Chemistry B, 122 (45). pp. 10330-10336. ISSN 1520-6106
https://doi.org/10.1021/acs.jpcb.8b06708
© 2018 American Chemical Society. This is an author produced version of a paper
published in Journal of Physical Chemistry B. Uploaded in accordance with the publisher's self-archiving policy.
[email protected] https://eprints.whiterose.ac.uk/ Reuse
Items deposited in White Rose Research Online are protected by copyright, with all rights reserved unless indicated otherwise. They may be downloaded and/or printed for private study, or other acts as permitted by national copyright laws. The publisher or other rights holders may allow further reproduction and re-use of the full text version. This is indicated by the licence information on the White Rose Research Online record for the item.
Takedown
If you consider content in White Rose Research Online to be in breach of UK law, please notify us by
vGlobal Small-Angle X-ray Scattering Data
Analysis of Triacylglycerols in the
-Phase
(Part II)
Marjorie Ladd Parada1+, Amin Sadeghpour1,2+, Josélio Vieira3, Megan Povey1
and Michael Rappolt1*
1School of Food Science and Nutrition, University of Leeds, LS2 9 JT, Leeds, U.K.
2Center for X-ray Analytics, Department of Materials Meet Life, Empa, St. Gallen,
Switzerland
3Nestlé, Product Technology Centre, York, U.K.
*Corresponding author: Michael Rappolt, School of Food Science and Nutrition, University
of Leeds, LS2 9 JT, Leeds, U.K., e-mail: [email protected], Tel: +44 (0)113 3431931.
ABSTRACT
The early stage crystallisation behaviour in a triacylglycerol mixture has been investigated
on the nanoscale with a novel global small angle X-ray scattering analysis technique. This
method has been tailored for the determination of the electron density profiles (EDP) replicating
both, (i) the nanostructural texture of molten TAGs (refer to part I ‘Global Small-Angle X-ray
Scattering Data Analysis of Triacylglycerols in the Molten State’ of this publication series), and (ii) the lamellar structure of the metastable -polymorph. In a first stage, the -phase scattering contribution alone was examined by classical Fourier analysis as well as by globally fitting the
data, leading to practically identical EDPs. Based on these findings, we extended our analysis
to the entire X-ray scattering contribution arising from molten TAGs and the solid -phase fraction. Remarkably, the experimental and theoretical data agree very well, providing for the
first time a detailed nanostructural understanding about the coexisting molecular assemblies.
This allowed in turn, also to quantitatively determine the solid fat content (SFC) with X-ray
scattering data. Our new theoretical approach for measurement of SFC is based on the global
analysis of small angle scattering/diffraction patterns and the SFC-results are in good agreement
INTRODUCTION
Triacylglycerols (TAGs) are ubiquitous natural fats and are the primary component of many
food and cosmetic products. They are known to crystallise monotropically developing at least
three different polymorphs, namely the -, ’-, and -phase, in order of increasing stability.1, 2 For food industrial applications, it is important to note, that the quality of the crystallized final
product depends strongly on the predominance of the different polymorphs. For instance, in the
manufacturing of dark chocolate, the purity of the -phase (polymorph V form) dictates the
preferred textural attributes such as glossy appearance, mould release, cooling in the mouth and
proper snap.3-5 Another parameter that influences the fat physical properties, and thus its
functionality, concerns the fatty acid (FA) composition within the TAG molecule, for variations
on the FA chain length, degree of unsaturation and FA position in the glycerol backbone6-10
strongly impact the molecular packing. When a fat system contains a mix of saturated and
unsaturated FAs, the number of polymorphic structures increases as the lamellar packing needs
to accommodate both, saturated and unsaturated FA chains. Note, due to the number of C=C
double bonds in unsaturated FAs, one or more kinks are apparent along the hydrocarbon chain.
Such is the case in cocoa butter (CB), which is composed mainly of three types of TAGs,
namely POP, POS and SOS (see abbreviation list).11 The presence of the oleoyl chain results in
the development of four to six polymorphic structures, of which – as mentioned above – only
the -V form is desirable in chocolate production.12, 13 This explains the continuing interest of the confectionary industry in understanding the crystallisation processes, both in terms of
thermodynamic-kinetic pathways and fat structure.
In terms of nanostructure, detailed information has been obtained from X-ray single-crystal
studies.14-17 Unfortunately, given the monotropic nature of TAGs, i.e., the inherent instability
of the - and ’-forms, such studies were restricted to the most stable polymorph only, i.e., the -phase. Therefore, a different approach is required, when seeking to obtain structural
information of the metastable polymorphs. Thus, Mykhaylyk and Hamley18, 19 applied classical
Fourier Transform (FT) analysis, a technique that is widely also applied for liquid crystalline
model membrane systems,20 for the determination of electron density profiles (EDPs) from
small angle X-ray diffraction (SAXD) data. This allowed them to obtain information on the
lamellar thickness and FA tilt angles of the different SOS polymorphs, as well as to propose
packing motifs for the , 2 and 1 forms. Nevertheless, concerning the spatial resolution the
published EDP of the 1 phase must be taken with some care, since only the first three order
Bragg peaks were recorded. However, in our study we can show, that contributions of the 4th
study we not only exploit the SAXD data, but also analyse and model the diffuse scattering
arising from the molten fraction of TAGs. This is of relevance as during the early stages of bulk
crystallisation when the -form develops, only a small proportion of the fat is crystalline, thus the majority of the scattering profile comes from the molten TAGs.
In this regard, Loisel et al. attempted to comprehend the molecular arrangement in the
coexisting phase regime proposing a hypothetical model based on qualitative understanding
from combined DSC and diffraction data.21 Although they do not provide calculations to
simulate diffraction patterns, they propose that the saturated fatty acids decorate the crystalline
hard core in the TAGs molecular assembly, while the mono- and/or poly-unsaturated fatty acids
adapt a liquid like structure and thus are believed to contribute to the diffuse X-ray scattering.
Other studies mainly focus on the determination of the polymorphs present at different
crystallisation stages,22-28 but disregard the role of coexisting molten TAGs. An exception
concerns the small angle X-ray scattering (SAXS) based work of Dewettinck et al.,25 who fitted
the diffuse X-ray scattering arising from the liquid state of TAGs with a Lorentzian distribution;
however, this was only done to roughly estimate the liquid to solid phase ratio in any given
diffraction pattern. Structural information in previous publications provide a great deal of
information on the crystalline polymorphs,22-25, 29 but so far, there has not been an integrative
approach for simulating the X-ray scattering from TAGs in the transition states.
In our first paper of this series (refer to part I ‘Global Small-Angle X-ray Scattering Data
Analysis of Triacylglycerols in the Molten State’), we focused on the structural characterisation of molten CB applying a global fitting approach of the diffuse SAXS data. This led to a detailed
description of a molecular assembly model for the liquid state, which satisfactorily simulated
the experimental data. Briefly, we proposed a ‘back-to-back’ arrangement of TAGs in the core of these assemblies with loosely attached TAGs in a second layer. We note, the assemblies in
the liquid state have been interpreted to be laterally extended, i.e., to have a planar geometry,
but we cannot exclude the self-assemblies in the liquid state to be wormlike as well (for a
detailed discussion on the dimensionality of TAG nanoclusters in the molten state refer to Part
I of this publication series).
In this work, we go a step further, demonstrating how the SAXS pattern arising from both
the liquid and coexisting -phase can be analysed in great detail. Concerning the -phase of CB, a few resemblances to smectic phospholipid phases are evident. While the diffuse
scattering originates from individual membrane layers, contributing to the form factor
scattering, diffraction peaks arise due to the quasi-long range ordering of the lamella, and thus,
analysis method dealing with phospholipid multilayers in the liquid state30. This approach not
only provides structural membrane information, but also mechanical membrane properties are
taken into consideration by modelling the stacking disorder of 2nd type and including membrane
undulations in the description of the system31-33. Adapting the basic principles of this global
analysis technique of SAXS data above, we were able to deduce for the first time a global
X-ray scattering description of the meta-stable -phase of TAGs. Finally, combining the models
for the liquid state (part I) with the developed model of the -phase, we provide a novel
nanostructural portrayal of the coexisting molecular assemblies. Note, that as a by-product, we
are now also able to quantitatively determine the solid fat content (SFC) from the X-ray
scattering data.
MATERIALS AND METHODS
Sample Preparation
West African cocoa butter (provided by Nestlé, PTC, York, U.K.) was used without
additional refining. A 1.5 mm disposable quartz capillary was filled with molten CB (at 50 °C)
and sealed with wax and an outer layer of epoxy glue. Subsequently, the capillary was loaded
into the temperature-controlled stage of the SAXSpace camera (Anton Paar GmbH, Graz
Austria).
X-ray Scattering Measurements
SAXS (small angle X-ray scattering) measurements were performed with the SAXSpace
instrument (Anton Paar GmbH, Graz, Austria) equipped with a Cu-anode that operates at 40
kV and 50 mA ( = 0.154 nm). The X-ray radiation was collimated using Kratky-type optics, which provides a line focused beam with a size of 20 x 0.3 mm (length x height). The instrument
comprises a temperature stage (TCStage 150, Anton Paar, Graz, Austria) for temperature
control in a range from -30 to 150 °C (precision 0.1 °C). The scattering vector modulus, q, was
calibrated with silver-behenate (q = 4 / sin( ) with 2 being the scattering angle). The
sample-detector distance used for the small angle measurements was 130 mm covering the angular
scattering range of 0.07 nm-1 ≤ q ≤ 8 nm- 1. The 1D scattering patterns were recorded with a
Mythen micro-strip X-ray detector (Dectris Ltd, Baden, Switzerland). More details on the
To obtain the -polymorph, the sample was held at 50 °C for 10 minutes and cooled down to 20 °C at a rate of 0.5 °C/min. The sample was left to stabilise for 5 minutes prior to taking
measurements with an exposure time of 20 minutes. The resulting patterns were background
subtracted by considering the scattering profile of empty capillary. The simulated curves were
smeared using the length profile of the X-ray beam prior for comparison with experimental
data.
Electron Density Profile Determination by Classical Fourier Analysis
As a rule of a thumb, EDPs of lamellar lipid self-assemblies determined by the classical
Fourier analysis, are of reasonable quality when diffraction orders can be recorded up to
q = 4.2 nm- 1 (referring to minimum d-spacing, dmin = 1.5 nm)35. However, when it comes to the
recording of the -phase diffraction pattern, commonly no more than 3 diffraction orders are recorded, not even at a high-brilliance synchrotron SAXS-beamline.19 Nevertheless, the authors
were recently capable of recording also a very weak fifth order peak at a 4th generation
synchrotron source, which to the best of our knowledge has not been reported elsewhere (Figure
S1, see SI). EDPs of the -phase were constructed by standard procedures.36 In brief, the Bragg diffraction peaks were fitted by a Lorentzian distribution function, the intensities were Lorentz
corrected and finally the square root of the corrected intensities resulted in the form factor
values, Fh. In case of centrosymmetric EDPs, the Fourier transform (FT) is obtained by the
summation of cosine terms only37:
(1)
where is the electron density contrast, h the Miller index (diffraction order) and d denotes
the lattice spacing.
EDP Determination from Global Fitting Analysis
The scattered intensity from multi-layered structures can be expressed as:
(2)
where F(q) is the bilayer form factor and S(q) is the structure factor,30 and the normalization of
q2 reflects the Lorentzian correction of the recorded intensity (for details see ref.38). The form
factor is given by the FT of the electron density profile along the membrane normal (z-axis). In
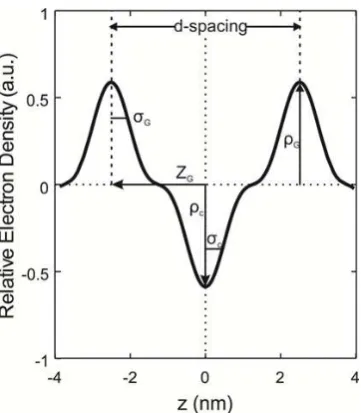
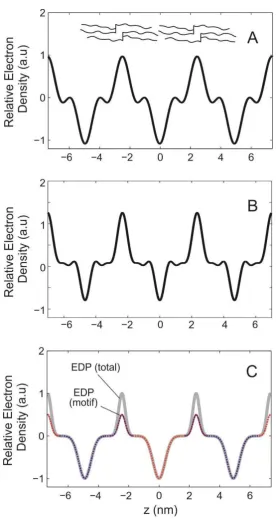
Figure 1. Applied two-Gaussian EDP model for the -polymorph of CB. The ‘positive’ Gaussian at position ±zG (width G) with an amplitude of G represents the glycerol backbone
region and the ‘negative’ Gaussian (width C) centred at zero models the hydrocarbon chain region.
The form factor of the simple 2-Gaussian model becomes by FT:
(3)
where zG and G represent the position and the width of the ‘glycerol backbone’, C the width
of ‘hydrocarbon chain region’ and r = | C/ G| is the ratio of the methyl trough to glycerol
backbone contrast. Since the -polymorph of CB is the least stable phase, we treated this
polymorph alike to liquid crystalline phases of phospholipids with a the structure factor
contribution based on the modified Caillé theory (MCT)30, 39:
exp ln (4)
where the mean number of scattering bilayers is identified as N, and is Euler’s constant. The Caillé factor, , describes the strength of disorder of second type in multi-layered structures and
takes into account the bending rigidity modulus, KC, and the bulk modulus for compression, B:
(5)
Furthermore, from the resulting Caillé factor, the mean square fluctuation of the TAG-layers in
the -polymorph the can be estimated, following the equation proposed by Petrache et al.40:
(6)
Finally, the experimental intensity data (Eq. 2) were globally fitted by using a Particle Swarm
[image:8.595.208.389.67.274.2]Estimation of the Solid Fat Content
Crystallisation of TAGs is a dynamic process in which the arrangement of the molecules
alters continuously over the cooling process or as time elapses. In fact, the -polymorph of CB coexists always with fractions of molten TAGs that decrease over time as crystallisation
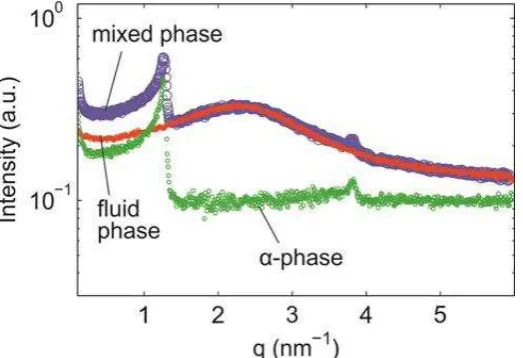
[image:9.595.169.431.186.365.2]progresses. The scattering pattern from such mixed phases is shown in Figure 2.
Figure 2. Small angle scattering curves of CB in fluid phase (red) obtained at 20 ºC (directly
after the cooling ramp was completed) and the corresponding mixed fluid and -polymorph (purple) obtained after 25 min at 20 ºC. The pure -polymorph diffraction pattern (green) has been obtained in this case by subtraction of the fluid phase contribution from the mixed phase.
In the following, we shall briefly outline how the SFC can be estimated from the global small
angle X-ray scattering analysis of the total intensity pattern (Figure 2, purple circles), that arises
from (i) the molten TAGs (red dots) and (ii) -phase contributions (green circles). Adding up
these two contributions, we can express the total intensity as:
(7)
where n is a weighing factor for the contribution of the -polymorph to the intensity profile, and F(q) and F(q)m (for F(q)m refer to part I, Eq. 11) are the form factors of the solid- and
molten-state phases, respectively. We note, that the weighing factor n is not equivalent to the
SFC, since the first term in equation 7 contains an additional structure factor contribution S(q)
(Eq. 4). However, we can exploit the fact, that generally at q = 0 different form factor
contributions to I(0) scale with their respective volumes41, i.e., (Mm/ m)/(M/ ) = Fm(0)2/F (0)2,
where m and are the densities of TAGs in the molten state and in the -phase, respectively.
Further, considering the experimentally determined weighing factors of each F(0)2, we obtain
for the solid fat content:
RESULTS AND DISCUSSIONS
Classical Electron Density Profile Determination of the -Phase
In a first approach, we determined the electron density profiles (EDP) of the -phase of CB
at 20 °C from two different data sets, applying the classical FT approach (Eq. 2). Concerning
the bench-top X-ray data, the highest recorded non-zero intensity concerned the 3rd order
diffraction peak (see Figure 2 and 3), while with a fourth-generation synchrotron source, we
were able to additionally to record a very weak 5th order diffraction peak (see SI, Figure S1). In
Table 1, the diffraction data of the -phase on CB (this work) and from Mykhaylyk and Hamley19 on SOS are compared. Note, the best phase combinations for the given set form
factors has been deduced from the continuous FT of our EDP model simulations (see subsequent section for further details). In agreement with Mykhaylyk and Hamley19, we obtained -1,+1,-1
for the first three orders and -1 for the 5th order (note, the modelled 4th order amplitude is too
[image:10.595.192.404.408.509.2]low to allow a prediction of its phase value).
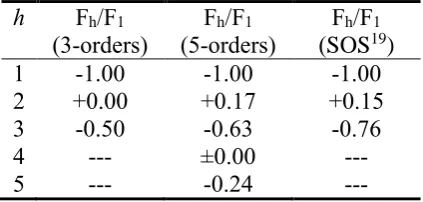
Table 1. Form factors, Fh, of CB in the -phase at β0 °C (column β and γ) compared with the
form factor values published for pure SOS at β0 °C.
h Fh/F1 (3-orders)
Fh/F1 (5-orders)
Fh/F1 (SOS19)
1 -1.00 -1.00 -1.00
2 +0.00 +0.17 +0.15
3 -0.50 -0.63 -0.76
4 --- ±0.00 ---
5 --- -0.24 ---
The resulting EDPs from the bench-top X-ray and synchrotron data were almost identical
(Figure 4A and 4B). As listed in Table 2, both d-spacings are practically the same (4.93-4.94
nm) resulting in monolayer thickness of 2.47 nm, while the methyl trough and glycerol
backbone thicknesses ( C and G) are significantly larger for the SAXS bench-top data
(0.08-0.12 nm difference; Table 2). However, the differences are very small, since the dominating
electron density contrasts stem from the 1st and 3rd order peaks, while the 2nd order and 5th order
electron density contrasts have only a minor impact on the final EDP (note, the 4th order electron
Modelling of the Electron Density Profile of the -Phase
By applying the global fitting method described in Eq. 2-4 to the scattering curve from the
[image:11.595.160.437.148.649.2]‘pure’ -phase contribution (Figure 3A; cp. also Figure 2), not only the EDP can be refined, but also the Caillé parameter is determined, indicating the inter-lamellar fluctuations.
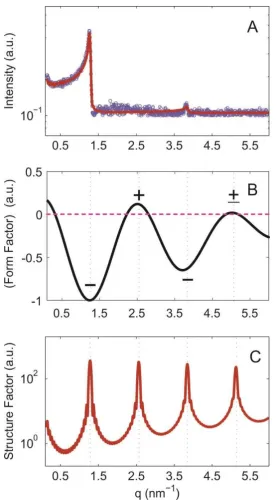
Figure 3. Global analysis of the SAXS data of the -phase of CB at 20 °C. (A) Global fitting of the ‘pure’ -phase contribution (cp. Figure 2), where the purple empty circles represent experimental data, and the red continuous line the best fit. (B) The corresponding continuous form factor plot is presented together with predicted phases. (C) The refined structure factor contribution determination based on the modified Caillé theory.39
Our analysis reveals that the d-spacing converges within experimental error to the same
was found to be 2.46 nm. Moreover, the global SAXS analysis provides also similar G and C
values (see Table 2). Plugging the obtained structural parameter values (Table 2) into Eq. 3 and
plotting the continuous Fourier transform allows the prediction of expected phases (Figure 3B).
As mentioned previously concerning the first five orders the expected best phase combination
is -1, +1, -1, ±1 and -1.
The refined structure factor (Eq. 4) is displayed in Figure 3C. The Caillé fluctuation
parameter was determined to be 0.01, which is about an order of magnitude smaller than values
found in literature for multilamellar phospholipid bilayer systems in the liquid state.31, 32 This
is understandable for two reasons: (i) phospholipid bilayers are separated by water layers of the
order of 2 nm, and hence bilayer undulations are less damped as compared to the TAG-layers
in the -phase, and (ii) the phospholipid bilayers in the liquid state are expected to display lower membrane bending rigidities as compared to the 2L-layers of the -phase. The latter argument is supported by the fact the gauche to trans conformation ratio of the FA chains within
-polymorphs is significantly smaller as compared to phospholipid membranes in the liquid
state.42 We note, that for this reason, we also fitted the data with an alternative structure factor
model, namely applying the paracrystalline theory of Hosemann,43 originally developed to
account for distortions in crystals. However, we could neither improve the goodness of our
fittings nor was the outcome for the fluctuation parameter any different. In both cases, the
derived mean fluctuations, , of the 2L-layers is about 0.15 nm (cp. Eq. 6; Table 2), thus
[image:12.595.71.427.557.708.2]representing layer undulations of about 3% of the d-spacing.
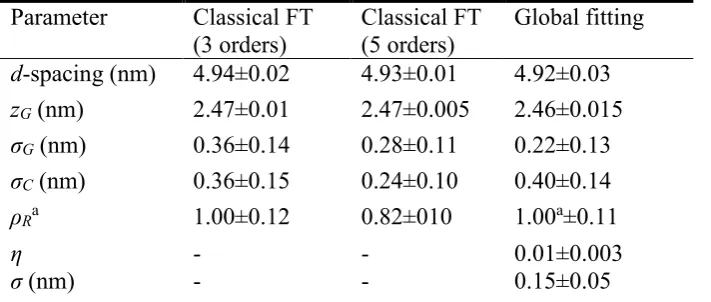
Table 2. Deduced structural parameters of CB in the -phase at 20 °C. Results from classical Fourier Transform (FT) analysis are compared to results from the global fitting of the SAXS data.
Parameter Classical FT (3 orders)
Classical FT (5 orders)
Global fitting
d-spacing (nm) 4.94±0.02 4.93±0.01 4.92±0.03
zG (nm) 2.47±0.01 2.47±0.005 2.46±0.015
G (nm) 0.36±0.14 0.28±0.11 0.22±0.13
C (nm) 0.36±0.15 0.24±0.10 0.40±0.14
Ra 1.00±0.12 0.82±010 1.00a±0.11
- - 0.01±0.003
(nm) - - 0.15±0.05
aIt is important to note, that the
R values refer in this table to the final EDP of the stacked
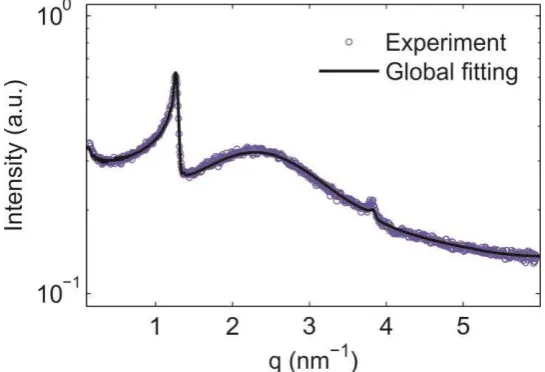
Global Fitting of Coexisting Liquid and -Phases
In order to achieve a complete picture about the molecular arrangements at the early stages
of crystallisation of CB, we can finally combine the two developed global fitting models for the
liquid (part I) and solid state (this work). Applying Eq. 7 to our background-subtracted data of
the -phase scattering together with diffuse scattering arising from the molten TAGs, we obtain
[image:14.595.168.441.201.387.2]a perfect fit of the entire SAXS curve (Figure 5).
Figure 5. The SAXS data from cocoa butter at 20 ºC and the corresponding global analysis with an obtained SFC of about 5%.
The main structural parameters of the -phase result in a repeat distance of 4.92±0.03 nm, a
glycerol backbone width of 0.22±0.13 nm and a methyl trough width of 0.40±0.14 (Table 2).
We note, the overall d-spacing in the -phase can be further decomposed into glycerol backbone
and hydrocarbon core extensions. Since CB consists mainly of three different types of FAs
(stearic: C18:0, palmitic: C16:0 and oleic: C18:1 acid) with oleic FAs having the shortest
effective length and the stearic the longest, the average hydrocarbon extension compares well
with the palmitic FA length. Assuming all trans-conformations in the FAs, leads to a thickness
of the hydrocarbon core, dC, of about 16 x 0.127 x 2 = 4.1 nm (note, a C-C bond length accounts
for 0.127 nm44), that is, the glycerol backbone thickness is about 0.8 nm, which compares well
to the fitted FWHM of the glycerol backbone thickness of 0.52±0.31 nm (Table 2).
These structural findings can now be compared with the refined structural parameters of the
coexisting the molten TAG assemblies. Since the core TAGs and second layer TAGs do
interdigitate according to our interpretation of the X-ray data fittings (see part I and the model
scheme in Table 3), the overall extension of the fluid 2L layer core of the assemblies can only
be estimated. Using the core and cluster size values, the 2L extension in the liquid state
-phase, i.e. 2Lfluid being about 1.3 nm thinner than 2Lsolid. This difference can be readily
explained by the presence of gauche conformers in the FAs in the liquid state. We note, that
precise measurements published on dipalmitoylphosphatidylcholine (DPPC) bilayers, display
a similar overall hydrocarbon chain shortening of 2 x 0.6 = 1.2 nm, when comparing the solid
lamellar phase at 20 °C with the fluid lamellar phase at 50 °C.44
Table 3. Deduced structural parameters of CB of molten TAG assemblies at 20 °C.
Parameter Global fitting of assemblies in the liquid state
Custer size (nm)
4.75±0.06
Core size (nm)
1.25±0.03
Second layer occupancy (%)
16±1
Finally, we are for the first time able to deduce directly the solid fat content (SFC) from the
globally fitted X-ray data (cp. Eq. 8). After 5 minutes equilibration of the CB sample at 20°C,
we obtained a SFC of about 5 %. For this we used the F(0)-values obtained from the global
fitting analysis and literature values for the density of molten cocoa butter (904 kg/m3 taken
from the thesis of Ladd-Parada45) and the density -polymorph (978 kg/m3 taken from Lencki and Craven46). Our SFC value compare well with literature values obtained previously:
Marrangoni et al.47 (direct quenching), Dewettinck et al.25 (direct quenching) and own
pulsed-NMR45 (step-wise cooling) led to values for the SFC from 9 to 11%, while Rigolle et al.24
estimated the SFC = 5% from WAXS-data. The lower values from X-ray scattering when
compared to the NMR data remain speculative, but it might be explained by the fact, that X-ray
data are typically recorded faster than NMR data and hence might reflect earlier stages of
CONCLUSIONS
Two novel EDP models have been developed to explain the scattering data of partially
structured TAGs in the liquid state (part I) as well as to simulate the stacking of TAGs in
-polymorphs (this work). This allowed us for the first time, to obtain a complete structural
picture of the cocoa butter in the early stages of crystallisation. The latter simulated findings
are not only in excellent agreement with FT-analysis results, but allowed, moreover, the
prediction of the correct phases of the experimental amplitudes as well as provided a first insight
into the flexibility of the 2L-layers in the -phase, i.e., small layer fluctuations of about 0.15 nm were determined.
Combining our two models, we further estimated for the first time the SFC directly from the
SAXS data, which in our case accounted for 5% after 25 minutes of isothermal equilibration at
20 °C. Importantly, we can directly compare structural elements of molten TAG assemblies
with the solid 2L-layered stacking of TAGs in the -phase. The 2L back-to-back extension of TAGs in the liquid state has been estimated here to be 3.5 nm, which compares to a repeat
distance of 4.9 nm in the -phase. This difference is fully explained through all-trans conformations of the FAs within the -phase, while trans-gauche conformations are dominant in the molten TAG assemblies. It is tempting to believe that the solidification of the proposed
AUTHOR INFORMATION
Corresponding Author
Michael Rappolt
School of Food Science and Nutrition, University of Leeds, LS2 9 JT, Leeds, U.K.
E-mail: [email protected]
Tel: +44 (0)113 3431931
Author Contributions
The manuscript was written through contributions of all authors. All authors have given
approval to the final version of the manuscript. †These authors contributed equally.
ACKNOWLEDGMENT
The authors would like to thank Nestlé for providing the cocoa butter used in this study, as
well as supporting Marjorie Ladd Parada’s PhD project. We further thank the I22-SAXS Beamline team managed by Prof Nick Terrill (Diamond Light Source Ltd.) for their help
during our beamtime in 2017 (SM15990). This work was funded by the Consejo Nacional de
Ciencia y Tecnología (México) in the manner of a full scholarship for the PhD studies of
Marjorie Ladd Parada.
ABBREVIATIONS
CB, cocoa butter; TAG, triacylglycerol; FT, Fourier Transform; POP,
sn-1,3-palmitoyl-2-oleoyl glycerol: POS, sn-1-palmitoyl-2-sn-1,3-palmitoyl-2-oleoyl-3-distearoyl glycerol SOS,
sn-1,3-distearoyl-2-oleoyl glycerol; EDP, electron density profile; SFC, solid fat content; SAXS, small angle
X-ray scattering; WAXS, wide angle X-X-ray scattering; FA, fatty acid; MCT, modified Caillé
REFERENCES
1. Koyano, T.; Hachiya, I.; Arishimo, T.; Sato, K.; Sagi, N., Polymorphism of POP and SOS. II. kinetics of melt crystallization. J. Am. Oil Chem. Soc. 1989, 66, (5), 675-679.
2. Koyano, T.; Hachiya, I.; Arishima, T.; Sagi, N.; Sato, K., Polymorphism of POS. II. kinetics of melt crystallization. J. Am. Oil Chem. Soc. 1991, 68, (10), 716-718.
3. Beckett, S. T., Science of Chocolate. The Royal Society of Chemistry: United Kingdom, 2000; p 127-142.
4. Windhab, E. J., Tempering. In Industrial Chocolate Manufacture and Use, T.Becket, S., Ed. Wiley-Blackwell: United Kindom, 2007; pp 276-319.
5. Talbot, G., Chocolate Temper. In Industrial Chocolate Manufacture and Use, 4th ed.; Becket, S. T., Ed. Blackwell Publishing, Ltd: Oxford, United Kingdom, 2009; pp 261-275. 6. Lipp, M.; Anklam, E., Review of cocoa butter and alternative fats for use in chocolate— Part A. Compositional data. Food Chemistry 1998, 62, (1), 73-97.
7. Wille, R. L.; Lutton, E. S., Polymorphism of cocoa butter. J. Am. Oil Chem. Soc. 1966,
43, (8), 491-496.
8. Tascini, A. S.; Noro, M. G.; Chen, R.; Seddon, J. M.; Bresme, F., Understanding the interactions between sebum triglycerides and water: A molecular dynamics simulation study.
Physical Chemistry Chemical Physics 2018, 20, (3), 1848-1860.
9. Takechi, C.; Kaneko, F., X-ray diffraction and vibrational spectroscopic study of the influence of cis- and trans-unsaturation on the -phase of triacylglycerols. J. Phys. Chem. B
2013, 117, (29), 8896-8905.
10. Bayés-Garcia, L.; Calvet, T.; Cuevas-Diarte, M. A.; Ueno, S.; Sato, K., Phase behavior of binary mixture systems of saturated-unsaturated mixed-acid triacylglycerols: Effects of glycerol structures and chain-chain interactions. J. Phys. Chem. B 2015, 119, (12), 4417-4427. 11. Lipp, M.; Anklam, E., Review of cocoa butter and alternative fats for use in chocolate— Part B. Analytical approaches for identification and determination. Food Chem. 1998, 62, (1), 99-108.
12. MacMillan, S. D.; Roberts, K. J.; Rossi, A.; Wells, M. A.; Polgreen, M. C.; Smith, I. H., In Situ Small Angle X-ray Scattering (SAXS) Studies of Polymorphism with the Associated Crystallization of Cocoa Butter Fat Using Shearing Conditions. Cryst. Growth Des. 2002, 2, (3), 221-226.
13. Afoakwa, E. O.; Paterson, A.; Fowler, M.; Vieira, J., Influence of tempering and fat crystallization behaviours on microstructural and melting properties in dark chocolate systems.
Food Res. Int. 2009, 42, (1), 200-209.
14. Vand, V.; Bell, I. P., A direct determination of the crystal structure of the [beta] form of trilaurin. Acta Crystallographica 1951, 4, (5), 465-469.
15. Van Langevelde, A.; Peschar, R.; Schenk, H., Structure of -trimyristin and -tristearin from high-resolution X-ray powder diffraction data. Acta Crystallographica Section B 2001,
57, (3), 372-377.
16. Van Langevelde, A.; Van Malssen, K.; Hollander, F.; Peschar, R.; Schenk, H., Structure of mono-acid even-numbered -triacylglycerols. Acta Crystallographica Section B 1999, 55, (1), 114-122.
17. Culot, C.; Norberg, B.; Evrard, G.; Durant, F., Molecular analysis of the [beta]-polymorphic form of trielaidin: crystal structure at low temperature. Acta Crystallographica Section B 2000, 56, (2), 317-321.
19. Mykhaylyk, O. O.; Hamley, I. W., The Packing of Triacylglycerols from SAXS Measurements: Application to the Structure of 1,3-Distearoyl-2-oleoyl-sn-glycerol Crystal Phases. The Journal of Physical Chemistry B 2004, 108, (23), 8069-8083.
20. Tristram-Nagle, S.; Liu, Y.; Legleiter, J.; Nagle, J. F., Structure of Gel Phase DMPC Determined by X-Ray Diffraction. Biophys.J. 2002, 83, (6), 3324-3335.
21. Loisel, C.; Keller, G.; Lecq, G.; Bourgaux, C.; Ollivon, M., Phase transitions and polymorphism of cocoa butter. Journal of the American Oil Chemists' Society 1998, 75, (4), 425-439.
22. Van Malssen, K.; Peschar, R.; Brito, C.; Schenk, H., Real-time X-ray powder diffraction
investigations on cocoa butter. III. Direct -crystallization of cocoa butter: Occurrence of a memory effect. JAOCS, Journal of the American Oil Chemists' Society 1996, 73, (10), 1225-1230.
23. van Langevelde, A.; Van Malssen, K.; Peschar, R.; Schenk, H., Effect of temperature on recrystallization behavior of cocoa butter. Journal of the American Oil Chemists' Society
2001, 78, (9), 919-925.
24. Rigolle, A.; Goderis, B.; Van Den Abeele, K.; Foubert, I., Isothermal Crystallization Behavior of Cocoa Butter at 17 and 20 °C with and without Limonene. Journal of Agricultural and Food Chemistry 2016, 64, (17), 3405-3416.
25. Dewettinck, K.; Foubert, I.; Basiura, M.; Goderis, B., Phase Behavior of Cocoa Butter in a Two-Step Isothermal Crystallization. Cryst. Growth Des. 2004, 4, (6), 1295-1302.
26. Voda, A.; Den Adel, R.; Van Malssen, K.; Van Duynhoven, J., Quantitative Assessment of Triacylglycerol Crystallite Thickness by 1H Spin-Diffusion NMR. Crystal Growth and Design 2017, 17, (4), 1484-1492.
27. Schmiele, M.; Schindler, T.; Westermann, M.; Steiniger, F.; Radulescu, A.; Kriele, A.; Gilles, R.; Unruh, T., Mesoscopic structures of triglyceride nanosuspensions studied by small-angle X-ray and neutron scattering and computer simulations. J. Phys. Chem. B 2014, 118, (29), 8808-8818.
28. Verstringe, S.; Dewettinck, K.; Ueno, S.; Sato, K., Triacylglycerol crystal growth: Templating effects of partial glycerols studied with synchrotron radiation microbeam x-ray diffraction. Crystal Growth and Design 2014, 14, (10), 5219-5226.
29. Ikeda, E.; Ueno, S.; Miyamoto, R.; Sato, K., Phase behavior of a binary mixture of 1,3-dipalmitoyl-2-oleoyl-sn-glycerol and 1,3-dioleoyl-2-palmitoyl-sn-glycerol in n-dodecane solution. J. Phys. Chem. B 2010, 114, (34), 10961-10969.
30. Pabst, G.; Rappolt, M.; Amenitsch, H.; Laggner, P., Structural information from multilamellar liposomes at full hydration: Full q -range fitting with high quality x-ray data.
Physical Review E 2000, 62, (3), 4000-4009.
31. Sanver, D.; Murray, B. S.; Sadeghpour, A.; Rappolt, M.; Nelson, A. L., Experimental Modeling of Flavonoid–Biomembrane Interactions. Langmuir 2016, 32, (49), 13234-13243. 32. Drasler, B.; Drobne, D.; Sadeghpour, A.; Rappolt, M., Fullerene up-take alters bilayer structure and elasticity: A small angle X-ray study. Chemistry and Physics of Lipids 2015, 188, (0), 46-53.
33. Rappolt, M.; Pabst, G., Flexibility and structure of fluid bilayer interfaces. In Structure and dynamics of membranous interfaces, Nag, K., Ed. John Wiley & Sons: Hoboken, 2008; pp 45-81.
34. Patil-Sen, Y.; Sadeghpour, A.; Rappolt, M.; Kulkarni, C. V., Facile Preparation of Internally Self-assembled Lipid Particles Stabilized by Carbon Nanotubes. Journal of visualized experiments 2016, (108).
36. Li, N. Y. D.; Perutková, Š.; Iglič, A.; Rappolt, M., My first electron density map: A beginner's guide to small angle X-ray diffraction. Elektrotehniski Vestnik/Electrotechnical Review 2017, 84, (3), 69-75.
37. Pabst, G.; Rappolt, M.; Amenitsch, H.; Laggner, P., Structural information from multilamellar liposomes at full hydration: full q-range fitting with high quality x-ray data.
Physical Review E 2000, 62, (3), 4000-4009.
38. Warren, B. E., X-ray Diffraction. Addison-Wesley: Reading, 1969.
39. Zhang, R.; Suter, R. M.; Nagle, J. F., Theory of the structure factor of lipid bilayers.
Physical Review E 1994, 50, (6), 5047-5060.
40. Petrache, H. I.; Gouliaev, N.; Tristram-Nagle, S.; Zhang, R.; Suter, R. M.; Nagle, J. F., Interbilayer interactions from high-resolution x-ray scattering. Physical Review E 1998, 57, (6), 7014-7024.
41. Mylonas, E.; Svergun, D. I., Accuracy of molecular mass determination of proteins in solution by small-angle X-ray scattering. J. Appl. Crystallogr. 2007, 40, (SUPPL. 1), s245-s249.
42. Czamara, K.; Majzner, K.; Pacia, M. Z.; Kochan, K.; Kaczor, A.; Baranska, M., Raman spectroscopy of lipids: A review. Journal of Raman Spectroscopy 2015, 46, (1), 4-20.
43. Hosemann, R.; Bagchi, S. N., Direct analysis of diffraction by matter. North-Holland Publ. Co.: Amsterdam, 1962.
44. Nagle, J. F.; Tristram-Nagle, S., Structure of lipid bilayers. Biochimica Et Biophysica Acta-Reviews on Biomembranes 2000, 1469, (3), 159-195.
45. Ladd-Parada, M. The effects of pressure and thermal history on the crystallisation of cocoa butter. Univsersity of Leeds, Leeds, 2018.
46. Lencki, R. W.; Craven, R. J., Negative pressure induced cavity formation during cocoa butter crystallization. JAOCS, Journal of the American Oil Chemists' Society 2013, 90, (10), 1509-1516.