General rights
Copyright and moral rights for the publications made accessible in the public portal are retained by the authors and/or other copyright owners and it is a condition of accessing publications that users recognise and abide by the legal requirements associated with these rights.
• Users may download and print one copy of any publication from the public portal for the purpose of private study or research.
• You may not further distribute the material or use it for any profit-making activity or commercial gain
• You may freely distribute the URL identifying the publication in the public portal
If you believe that this document breaches copyright please contact us providing details, and we will remove access to the work immediately and investigate your claim.
Downloaded from orbit.dtu.dk on: Dec 21, 2017
Streamlining Smart Meter Data Analytics
Liu, Xiufeng; Nielsen, Per Sieverts Published in:
Proceedings of the 10th Conference on Sustainable Development of Energy, Water and Environment Systems
Publication date: 2015
Document Version
Publisher's PDF, also known as Version of record
Link back to DTU Orbit
Citation (APA):
Liu, X., & Nielsen, P. S. (2015). Streamlining Smart Meter Data Analytics. In Proceedings of the 10th Conference on Sustainable Development of Energy, Water and Environment Systems International Centre for Sustainable Development of Energy, Water and Environment Systems.
Streamlining Smart Meter Data Analytics
Xiufeng Liu and Per Sieverts NielsenTechnical University of Denmark
{xiuli, pernn}@dtu.dk
Abstract. Today smart meters are increasingly used in worldwide. Smart meters are the advanced meters ca-pable of measuring customer energy consumption at a fine-grained time interval, e.g., every 15 minutes. The data are very sizable, and might be from different sources, along with the other social-economic metrics such as the geographic information of meters, the information about users and their property, geographic location and others, which make the data management very complex. On the other hand, data-mining and the emerging cloud computing technologies make the collection, management, and analysis of the so-calledbig datapossible. This can improve energy management, e.g., help utilities improve the management of energy and services, and help customers save money. As this regard, the paper focuses on building an innovative software solution to stream-line smart meter data analytic, aiming at dealing with the complexity of data processing and data analytics. The system offers aninformation integration pipelineto ingest smart meter data;scalable data processing and analytic platformfor pre-processing and mining big smart meter data sets; and a web-basedportalfor visualiz-ing data analytics results. The system incorporates hybrid technologies, includvisualiz-ing big data technologies Spark and Hive, the high performance RDBMS PostgreSQL with the in-database machine learning toolkit, MADlib, which are able to satisfy a variety of requirements in smart meter data analytics.
Keywords: Streamline, Software Platform, Smart meter data, Data Analytics
1
INTRODUCTION
Today smart meters are increasingly used in worldwide for the ability of providing timely read-ing, automating metering without customer promises, producing fine-grained data, and more. Smart meters collect energy consumption data at a time interval, usually every 15 minutes or hourly. Smart meter data analytics system is an ICT-based platform for analyzing the collected meter readings, which nowadays has become an indispensable part for utilities running smart grid. Smart meter data analytics can help utilities better understand customer consumption pat-terns, provision energy supply to peak demand, detect energy theft, and provide personalized feedback to customers. Also, government can make the decision for future smart grid develop-ment based on analytic results. For customers, smart meter data analytics can help them better understand their own energy consumption, save energy, and reduce their bills. Smart meter an-alytics thus is seen so important that the market has been growing rapidly, which is expected to reach over four billion dollar by year 2020 [19]. Various algorithms for smart meter data analytics have been proposed, mainly in the smart grid literature, such as the ones for elec-tricity consumption prediction, consumption profile extractions, clustering similar consumers, and personalized feedback to consumers on how to adjust their habits and reduce their bills. Nevertheless, there has been lacking smart meter analytics applications in reality until in the recent that some database vendors starts to offer smart meter analytics software, e.g., SAP and Oracle/Data Raker. So did several startups in this area, e.g., C3Energy.com and OPower.com. Furthermore, some utilities such as California’s PG&E4 also start to provide on-line portals where customers can view their electricity consumption and compare it with their neighbour-hood’s average. However, these systems and tools focus on simple aggregation and simple ways of visualizing consumption. The details of their implementations are not disclosed. It is unclear on how to build a practical and scalable analytics system to handling smart meter data, which are characterized by big volume and big velocity.
In this paper we present a software platform for streamlining smart meter data analytics. This platform is built based on our benchmark work for smart meter data analytics technologies [30],
and extended from our prototype smart meter data analytics system,SMAS[29]. This platform aims at providing a solution for facilitating the whole process of smart meter data analytics, including data ingestion, data transformation, loading, analyzing, and visualization. Utilities or customers can get the final information through these stages. We adopt a hybrid architecture in the system design, in which the primary building blocks consist of Spark and Hive in the data processing layer, and PostgreSQL with MADlib [18] in the analytics layer. The design consid-ers the support for high performance analytics queries, i.e., through RDBMS, and the support for big data analytics, i.e., through Spark and Hive. We decouple the system architecture into three layers, including data ingestion layer, processing layer, and analytics layer, which make it easy for users’ implementation and extension. Smart meter data goes through the three layers from data sources to be presented in a web portal. The processing layer is an open platform that can integrate various user-defined processing units, such as the units for data transformation, data anonymization, and anormal data detection. While, the analytics layer is also open to the extension of different analytics algorithms. The analytics layer currently supports multiple types of algorithms, including time-series analytics at different temporal aggregations (e.g., hourly, daily, or weekly), load dis-aggregation, consumption pattern discovery, segmentation, forecast-ing and consumer feedback. Consequently, in this paper we make the followforecast-ing contributions: 1) we propose a hybrid architecture of combining the best of different technologies for stream-lining smart meter data analytics; 2) we implement the open data platform that can be easily extended by using different data processing units and analtyics algorithms; and 3) we imple-ment smart meter data analytics system of supporting both supply- and demand-side analytics, which can help utilities better to manage energy supply and help consumers save energy.
The rest of this paper is structured as follows. Section 2 summarizes the related work; Sec-tion 3 presents the design principles of the system; SecSec-tion 4 gives an overview of the system; Section 5 and 6 present data processing layer and analytics layer of the system, respectively; Section 7 concludes the paper with directions for future work.
2
RELATED WORK
Systems and Platforms for Smart Meter Data Analytics.The traditional technologies, such as R (S-PLUS), Matlab, SAS, SPSS and Stata, which support numeric computing and comprehen-sive statistical analysis can be used in smart meter data analytics. The recent trend of analytics technologies is to support in-memory, in-database, and in parallel on a cluster. Main-memory based systems, such as KDB+ [16] and SAP HANA [13], and the in-database machine learning toolkit, e.g., PostgreSQL/MADlib [18] are the good options to smart meter analytics. Parallel distributed platforms such as Hive (built on top of Hadoop) or Spark are the two distinct dis-tributed computing frameworks that are able to handle big data analytics in a cluster. In this paper, we implemented our system with a hybrid architecture of using Hive, Spark and Post-greSQL/MADlib. The system combines the best of each technology, which is able to do data analytics in-database, in-memory and in parallel.
The systems or prototypes for smart meter data analytics emerge in both industry and academia. The industry companies that we mentioned in Section 1 developed smart meter ana-lytic software, but the implementation of the systems and anaana-lytics algorithms used are unclear, which may be due to the license issue. Nezhad et al. developed a smart meter dashboard in their research work, called SmartD [20], which is orthogonal to the work of the analytics layer of our system, but ours provides more comprehensive functionalities, and the whole software ar-chitecture is the complete solution of supporting data ingestion, transformation, analyzing and visualization. Liu et al. use analytic procedures in Hive to process smart grid data on cloud
stor-age, and use an RDBMS to cope with daily data management transactions on the information of meter devices, users, organizations, etc [31]. This is somewhat similar to our architecture, but our main focus is to streamline the whole process of smart meter analytics by taking ad-vantage of different technologies. Furthermore, our platform is open to the extension of adding more data processing units and algorithms. Besides, the work [31] primarily studies how to ef-ficiently retrieve smart meter data from Hive, and focuses on simple operational queries rather than the deep analytics that we address in our system. Beyond electricity sector, smart meter analytics systems and applications were also developed in the water sector, e.g.,WBKMS[25], a web-based application for providing real-time information of water consumption; and Aut-oflow[21], a tool for categorising residential water consumption. We are currently developing water data analytics algorithms, which will be integrated into the analytics layer of our system. These existing works provide useful information to our implementation.
Benchmarking Smart Meter Data Analytics.Arlitt et al. implements a toolkit, called IoTAbe-nch, to benchmark the analytics algorithms of Internet of Thing (IoT). They use synthetic elec-tricity data, and evaluates six queries for smart meter data analytics algorithms on HP Vertica cluster platform. Benchmarking time series data mining is also discussed in [17], where differ-ent implemdiffer-entations of time series similarity search, clustering, classification and segmdiffer-entation were evaluated. Anil benchmarks data mining operations for power system analysis [5], which analyzes voltage measurements from power transmission lines. However, all of these works only focus on benchmarking analytics algorithms. In our previous work [30], we benchmark four representative analytics algorithms for smart meter data, as well as five technologies with different categories, including Matlab, KDB, PostgreSQL/MADlib, Spark and Hive. They rep-resent the technologies of the traditional (Matlab), in-memory (KDB and Spark), in-database (PostgreSQL/MADlib), in-memory distributed (Spark) and Hadoop based (Hive). The work is the foundation to implement this system, i.e., providing the reference of choosing the technolo-gies.
Smart Meter Data Analytics Algorithms.Two broad applications of smart meter data ana-lytics are widely studied, which are consumer and producer-oriented. Consumer-oriented appli-cations aim to provide feedback to end-users on reducing electricity consumption and saving money (see, e.g., [10, 19, 23]). Producer-oriented applications are for utilities, system operators and governments, which provide information of consumers, such as their daily habits for the purposes of load forecasting and clustering/segmentation (see, e.g., [1, 2, 4, 7, 11, 12, 14, 15, 19, 20]). From a technical standpoint, both of the above classes of applications perform two types of operations: extracting representative features (see, e.g., [7, 10, 12, 14]) and finding similar consumers based on the extracted features (see, e.g., [1, 11, 23, 24, 27]). Household electric-ity consumption can be broadly decomposed into the temperature-sensitive component (i.e., the heating and cooling load) and the temperature-insensitive component (other appliances). Thus, representative features include those which measure the effect of outdoor temperature on consumption [3, 10, 23] and those which identify consumers’ daily habits regardless of tem-perature [1, 7, 12], as well as those which measure the overall variability (e.g., consumption histograms) [2]. Some of the above existing algorithms have been integrated into our system, as well as new implemented algorithms, which are used to study variability of consumption, load profiling, load segmentation, pattern discovery, load dis-aggregation, and load similarity to other consumers.
3
DESIGN PRINCIPLES
Scalability. The system will be able to deal with fast-increasing volume of smart meter
data, with at a high frequency, e.g., 15 minutes, 30 minutes or hourly. It may adopt the cur-rent technologies such as MapReduce to scale big data analytics. Data mining and machine learning algorithms thus have to be transformed as MapReduce programs to be parallelized in a cluster environment. The system should be capable of running at both batch and stream mode to cater for real-time data streams and big data sets.
Efficiency.The system will support low latency queries, and better service quality by giving
users great browsing and analysis experience. To enable this, in-memory based databases, high performance NoSQL databases (with trading off consistency for availability, fault-tolerance and performance), or traditional relational database management systems with their support low latency queries will be exploited. The selected data storage system should be able to support common operations over time series data such as temporal range queries.
Availability.In order to capture near real time data and provide data service and analytics,
the system must be highly available. To enable this, this system should support running the a cluster environment, e.g., a private or public cloud, which offer fault tolerance as a service to the system which requires reliability and availability.
Realtime and batch data ingestion.The system will implement two data ingestion
mech-anisms, realtime and batch data ingestion. Real-time data ingestion will integrate the data stream into the system directly from smart meters, which will provide near realtime analyt-ics results to customers, while batch ingestion will be used to the scenarios that data needs to be handled in bulk mode, e.g., the data uploaded by users, or data from legacy systems.
Solution.The system will provide a complete solution to smart meter data analytics, which
includes data ingestion, transformation, loading, data analytics and visualization. The sys-tem will aim at streamlining smart meter data analytics, and supporting big data.
4
SYSTEM OVERVIEW
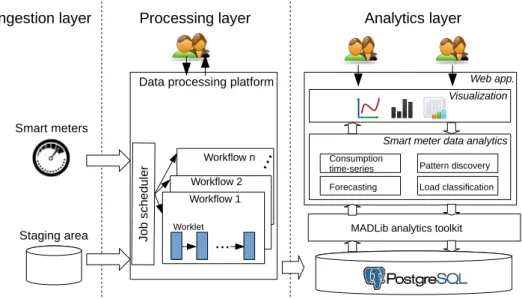
According to the design principle in the above section, we design a smart meter analytic system with the architecture shown in Fig. 1. The architecture is divided into three layers, data ingestion layer, processing layer and analytics layer. Each layer represents a separate functional system to meet the overall requirement of streamlining smart meter data analytics. The left-most is the data ingestion layer which consists of integrating real-time data stream from smart meters, and the data from heterogeneous repositories in bulk mode. The objective of this layer is to acquire the data from data sources, which are delivered to the processing layer for any necessary data cleansing or transformations.
The middle in the architecture is the processing layer, which can handle the ingested data in different data processing systems, such as Spark, Hive, Linux Shell, Python or RDBMS SQL Engine (we will discuss it further in Section 5). Data is processed through workflows, each of which consists of multiple processing tasks that are executed in the corresponding underlying data processing systems. All the workflows are scheduled to be executed only once or repeat-edly at a specific time interval, such as minutely, hourly, daily, weekly or monthly. In fact, the processing layer can manage different workflows for processing the data from different sources. A workflow is made of multiple connected worklets, each of which is used for a particular pro-cessing task and can be executed on a underlying data propro-cessing system. For example, a batch processing workflow might consist of the worklet for extracting data from a source system and writing to staging area; the worklet of running data cleansing on Spark, i.e., read data from staging area, process, and write the final results to an analytics database; and the worklet of
Fig. 1.The system architecture of smart meter data analytics system
housekeeping when the job has finished, e.g., removing the data from staging area, and sending an email for the notification.
The right-most in the architecture is the analytic layer for smart meter data implemented in our previous work [29]. The analytics layer consists of a high performance database, ana-lytics libraries, web application and report engine which are together to serve users’ analytic queries. This system is a web-based application of using Tomcat as the application server, Highcharts (www.highcharts.com) as the visualization engine, PostgreSQL as the database, and MADlib [18] as the in-database analytic library. We implement various algorithms using MADlib analytics functions as well as Pl/PgSQL. The implemented algorithms include those for load analysis, pattern discovery, segmentation, forecasting and feedback services. With these algorithms, users can do both supply- and demand-side data analytics, which will be discussed in Section 6.
We exploit this hybrid architecture for our system in order to combine the best of each components, i.e., OLTP capability (by PostgreSQL), big data capability (by Hive andSpark), and realtime streaming ability (by Spark). Since RDBMS is more suitable for online analytics with its powerful OLTP and indexing abilities, we use PostgreSQL to manage the latest smart meter data, e.g., the data aged less than two years, social-economic data, andstatistics data. It is because smart meter data typically has a big size, but is rarely updated; social-economic data, such as the information of customer, property, and geographic locations, etc., is typically small, but may be updated frequently. Statistics data is the analytics results from batch jobs, which may be much smaller than the size of the original time-series data. Therefore, in this system architecture, we use Hive as the archival database for storing history data, e.g., older than two years. The history data can be run by the analytics algorithms in batch jobs in Hive, and the results are updated to PostgreSQL.
5
DATA PROCESSING LAYER
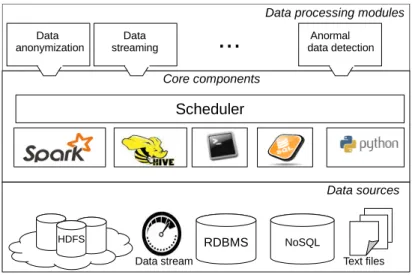
The data processing layer is shown in Fig. 2. The core components of this layer consist of the job scheduler implemented using Quartz library [22], and the data processing algorithms running in this platform. The algorithms can be run on Spark, Hive, Linux Shell, SQL Engine or Python environment. The data processing algorithms are the functional modules implemented for a certain purpose, such as data cleansing, data transformation, data anonymization, streaming
processing, anormal data detection, etc. The sources and the sinks represent the places where a job reads the data from and writes the final results to, respectively. Since this platform is an open data platform, it supports various data sources and targets in the underlying, which is simply to implement the corresponding read and write interfaces.
Fig. 2.The building blocks of data processing layer
5.1 Data Stream Processing
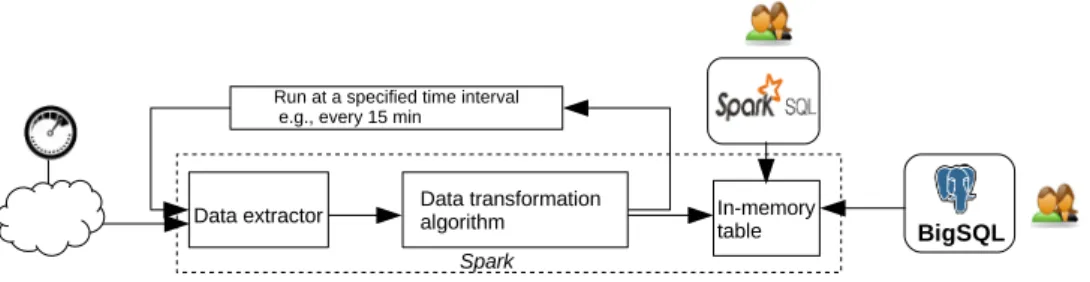
This data platform uses Spark for stream data processing (see Fig. 3). The data extractor is scheduled by the system scheduler running periodically to “pull” the data from the external sources, e.g., extracting data from sensors or smart meters for every 15 minutes. In fact, this platform can extract data from any sources as long as the corresponding extractors are imple-mented. For security reason, some data sources require user authentication for the reading, and therefore, the authentication needs to be specified in the data extractor program. The extracted data are created as a distributed data sets (RDDs) in Spark, which are fault-tolerant collections of objects partitioned across cluster nodes that can be acted on in parallel. RDDs can be ap-plied by the operations, calledtransformations, including map, filter, groupBy, and reduce, etc. The programs for processing data are developed by making use of these operators. Multiple data processing programs can constitute into a workflow, a functional module for a particular requirement, e.g., data imputation or anonymization. The final cleaned and well-formatted data are kept temporarily in an in-memory table in Spark, which is also a RDD but given the name of each attribute to improve the interoperability of Spark through SQL. When the data resides in the in-memory table, users can do ad-hoc interactive queries by typing SQL statements through a web-based user interface, and the results will be shown in a table or graphs in the user in-terface. Through the interactive queries, users can check the analytics results instantly so as to verify the implemented programs of workflows. For more complex analytics requirements, and the persistence of the data to PostgreSQL, we use BigSQL [9], an open source middleware that can query the data in Spark and Hive from PostgreSQL through foreign data wrapper (FDW).
5.2 Batch Processing
The data processing layer supports Hive as batch processing system for big data. Hive is an open source SQL-based distributed warehouse system built on top of Hadoop framework [26]. Hive is an SQL-to-MapReduce translator with an SQL dialect, HiveQL, for querying data stored in
Fig. 3.The building blocks of data processing layer
a cluster. Since it is typically complicated for users to implement a MapReduce program on Hadoop, Hive simplifies this process by the SQL abstraction. Hive can automatically translate SQL statements into MapReduce jobs, and run on Hadoop. This greatly lowers the barrier of using Hadoop, and thus people who are familiar with SQL can easily write queries that will be run on Haddoop. Hive is suitable for the situation where large-scale data is analyzed, fast response time is not required, and no frequent data updates are done. With these characteristics, Hive is employed to the batch processing in our platform. Thus, the data from legacy systems, archival data, or other large-sized data sets residing in Hadoop distributed file system (HDFS) can be processed in Hive by analytic queries in SQL, and/or by user-defined functions (UDFs). The final results of analtyics are written into the tables in Hive, which can be imported into the database in the analytics layer, or still kept and maintained in Hive, which can also be queried from PostgreSQL through the connector, BigSQL.
5.3 Job Scheduling
As mentioned earlier, the data processing layer supports different workflows running on the same platform, which are scheduled by the job scheduler. A workflow may consists of multi-ple worklets which are the programs of Spark, Hive, Python or Linux Shell. To better control the scheduling of workflow and the consumption of computing resources, we implement two scheduling algorithms to control the jobs, including deterministic scheduling and delay schedul-ing algorithms. The deterministic schedulschedul-ing algorithm schedules the workflows runnschedul-ing at the exact time specified by users. With this algorithm, the scheduling for workflows is determin-istic and remains the same for repeated executions. The workflows that are implemented in the Python and Shell script, and execute on a single server are scheduled by the deterministic scheduling algorithm. If a workflow consists of Hive or Spark programs that require to run on a cluster environment, the workflow will be scheduled by the delay scheduling algorithm, which ensures no more than one jobs submitted to the same cluster at any point of time. The reason is that Spark or Hive programs run on top of Java virtual machine (JVM) in the underlying distributed systems, which requires some amount of memory. It is easy to run out of the main memory if multiple tasks are running simultaneously on a node. In the delay scheduling algo-rithm, we use a queue to accommodate the jobs of workflows, which are ordered by the time set by users. If two scheduling times are identical, the scheduler uses a first-in-first-out (FIFO) algorithm to submit the job to the cluster. Therefore, the execution time of some workflows may be not the time specified by users, but at a later time.
6
DATA ANALYTICS LAYER
As shown in Fig. 1, the building blocks of data analytics layer consists of PostgreSQL, the in-database machine learning toolkit, MADLib, the algorithms for smart meter data analytics, and visualization. This layer was implemented in our previous work [29]. We now describe how we use these building blocks in smart meter data analytics, and the functionalties provided by this layer.
6.1 Analytics Algorithms
In traditional execution of analytics using SAS, R, Matlab and Proc-SQL there is significant data movement from database into the analtyic tools. Thus, the part of the workload related to data movement is often quite substantial. One of new trends of analytics technology development is pushing analytic algorithms into database, which aims at removing the overhead of data movement. MADlib is such a tool for doing in-database analytics for the open source database system, PostgreSQL. The analytics layer is composed of the two core building blocks,MADLib andPostgreSQL. MADlib offers various off-the-shelf analytics functions, including the ones for linear, logistic, multinomial logistic regression, elastic-net regularization for linear and logistic regressions, k-means, association rules, cross validation, matrix factorization methods, LDA, SVD and PCA, ARIMA, and many other statistical functions. The analytic functions are used through a pure SQL interface. In this system, all our analytics algorithms are implemented as stored procedures in PostgreSQL that use Pl/PgSQL and the analytics functions of MADlib.
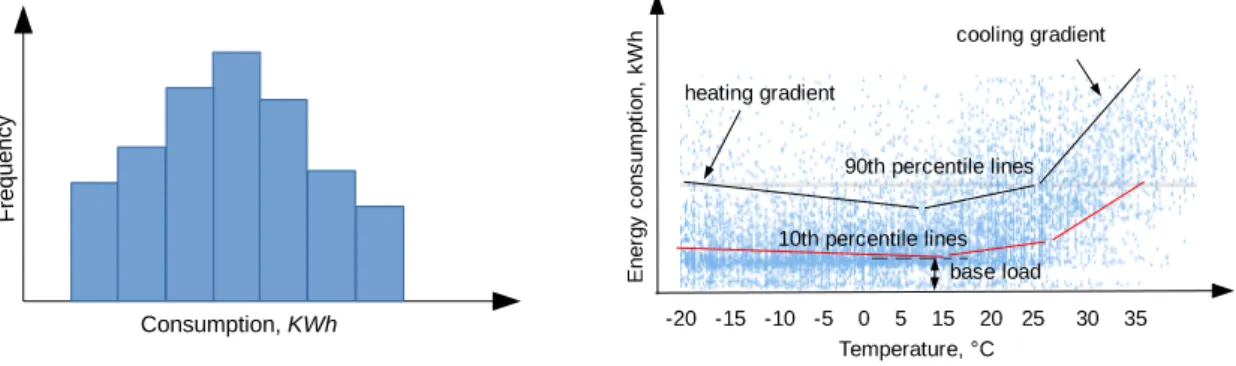
In smart grid management, utilities must be provisioned for peak demand, therefore it is important for utilities to identify consumers with highly variable consumption and offer them incentives to smooth out their demand. In the analytics, utilities can run histogram on the hourly consumption of each customer to learn the variability of a customer (see Fig. 4).
Fig. 4.Consumption variability analytics Fig. 5.
Thermal sensitivity analytics
In the analytics, we can characterize the effect of external temperature on the electricity consumption of each customer. For example, in winter and summer, consumption rises as tem-peratures become more extreme due to heating and cooling. Consider the scatter plot shown in Fig. 5, with temperature on the X-axis and consumption on the Y-axis. Each point on the scatter plot corresponds to a particular hourly consumption value and the corresponding temperature at that hour (for the same customer). We implemented a recent algorithm [10] that computes a piece-wise linear regression model to characterize. The piece-wise linear regression model the temperature sensitivity of each customer. The algorithm computes two regression models: one corresponding to the 90th percentile consumption at each temperature and one correspond-ing to the 10th percentile at each temperature. As shown in Fig. 5, these models reveal several interesting features for each customer. For example, the slope of the 90th percentile line corre-sponding to high temperature is the cooling gradient, and the slope of the line correcorre-sponding to low temperature is the heating gradient. Furthermore, the height of the 10th percentile lines at their lowest point is the base load, which corresponds to load due to appliances that are always on, such as a refrigerator.
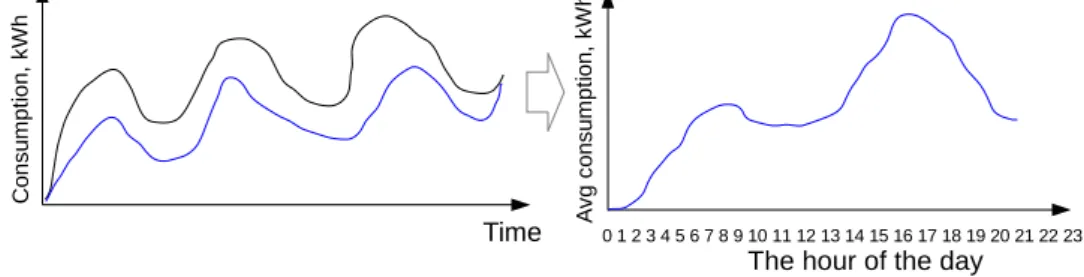
Another interesting algorithm is for extracting daily consumption patterns that occur regard-less of the external temperature, as illustrated in Fig. 6. On the left, we show a fragment of the hourly consumption time series for some consumer over a period of several days. Since smart meters report the total electricity consumption of a household, we can only observe the total consumption time series (the upper black curve). The goal of the algorithm is to determine,
for each hour, how much load is due to temperature (i.e., heating and cooling), and how much load is due to daily activity independent of temperature (the lower blue curve). Once this is determined, the algorithm fits a time series auto-regression model and computes the average temperature-independent consumption at each hour of the day, illustrated on the right of Fig. 6 (the X-axis is the hour of the day and the Y-axis is the average consumption). Since weekday and weekend activities may differ, it is useful to separately compute the typical weekday and weekend profiles for each consumer.
Fig. 6.Daily load profile analytics
In addition, we have implemented other algorithms, including for load dis-aggregation, fore-casting, clustering, and pattern discovery. We now illustrate an example on how to use Pl/PgSQL and MADlib to implement an algorithm.
Example 1 (Implement PARX Algorithm Using Pl/PgSQL and MADlib) The exemplified
al-gorithm is called periodic auto-regression with eXogenous variables (PARX) [7], which can be used to extract the load regardless of any eXogenous variables that affect the load. Let us take residential electricity consumption as the example. The additional electricity consumption may be due to size of family, house area, outdoor weather temperature, and others. For simplicity, we only consider the weather temperature in this example, i.e., for heating or cooling. Given the hourly electricity consumption time series for a consumer over time, we use this algorithm to determine, for each hour, how much load is temperature-independent. Due to the living habit of customers, the daily load may follow a certain pattern, e.g., having morning peak at 7-8 o’clock after getting up, and evening peak at 17-20 o’clock for cooking after work. Thus, in this algorithm we take 24hours as a period, and the hour of a day att, i.e.,t = 0...23, as the seasons, and use the previouspdays at the timet for auto-regression. The PARX model at the
s-th season and at then-th period is formulated as
Ys,n = p
X
i=1
αs,iYs,n−i+βs,1XT1 +βs,2XT2 +βs,3XT3 +s, s∈t (1) where Y is the data point in the time-series; pis the number of order in auto-regression;
XT1, XT2 and XT3 are the exogenous variables to account for temperature, defined in the equations of(2)−(4);αandβ are the coefficients; andis the value of the white noise.
XT1 = ( T −20 ifT >20 0 otherwise (2) XT2 = ( 16−T ifT <16 0 otherwise (3) XT3 = ( 5−T ifT <5 0 otherwise (4)
The variables represent the cooling (temperature above 20 degrees), heating (temperature be-low 16 degrees), and overheating (temperature bebe-low 5 degrees) slopes, respectively.
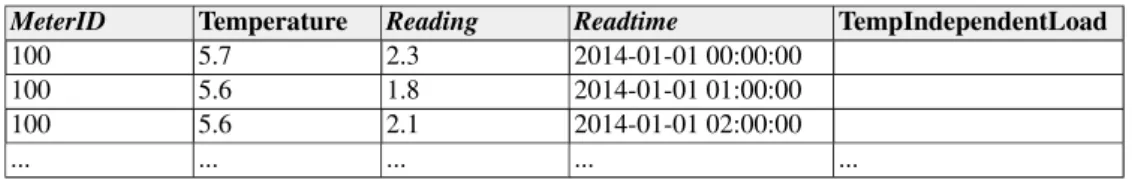
Table 1 shows the table layout for managing time-series data of hourly resolution. This table contains not only the time-series of smart meters, but also the hourly temperature time series obtained from a local weather station of customers. We let temperature independent load empty (see the column TempIndependentLoad), but it will be updated by the implemented algo-rithm. We now implement the PARX algorithm using Pl/PgSQL and MADlib, shown in Fig. 7 (only the body of stored procedure is listed). Since MADlib does not provide PARX implementa-tion, we, instead, make use of the provided multiple regression as the workaround, which takes the values ofY,XT1, XT2andXT3as the inputs of the variables. Line 1–25 in Fig. 7 shows the process of preparing the variable values for the input of multiple regression algorithm in a temporary table, where we set the orderp= 3for the auto-regression part. Line 27 performs the multiple regression using MADlib, which saves the output toresult temptable. Line 29–46 computes the temperature-independent load according to the formula (1), and updates to the time-series table.
Table 1.Table layout for storing time-series data,tbl hourlyreading
MeterID Temperature Reading Readtime TempIndependentLoad
100 5.7 2.3 2014-01-01 00:00:00
100 5.6 1.8 2014-01-01 01:00:00
100 5.6 2.1 2014-01-01 02:00:00
... ... ... ... ...
6.2 Functionalities
The system supports both supply-side and demand-side smart meter data analytics. Through supply-side analytics, utilities can optimize smart grid, plan for the future, and provision for the peak of demand. Through demand-side analytics, utilities can better understand consumption patterns of customers so as to provide personalized services. The demand-side analytics can also help customers better understand their own consumption, and help them to save energy. In the following, we will describe the functionlities of this layer for the support of supply- and demand-side analytics.
Consumption analysis.Utilities can view the consumption at different granularities with
re-spect to the dimensions of time and geographic location, and view the aggregated consump-tion with respect to the funcconsump-tions, sum, average, min or max. Utilities can also compare the consumption of any two individuals or feed areas.
Consumption pattern discovery. Smart meter time-series data reflects the load influenced
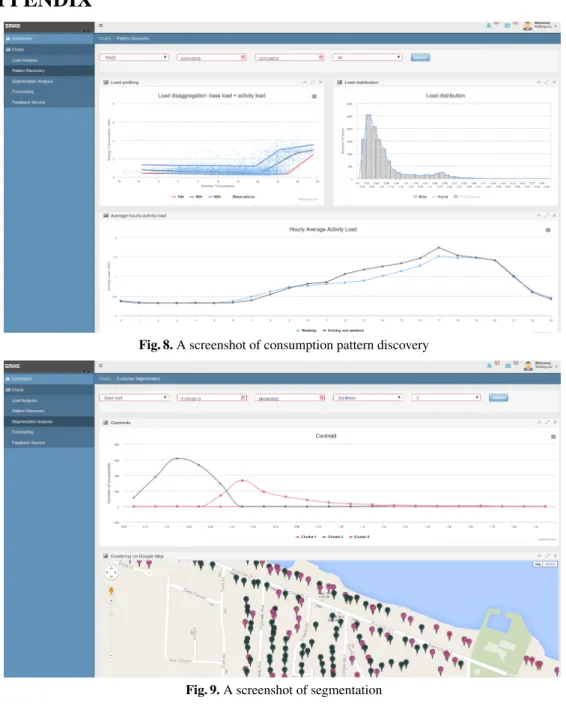
by various factors, such as consumer indoor activity, outdoor weather temperature, and the appliances used. Consumption pattern discovery can help utilities to better understand the consumption practices of customers so that they can provide customers appropriate recom-mendations for energy saving. In pattern discovery, the analytics layer can display not only the raw time-series data, but also the load shapes dis-aggregated by the 3-line and PARX algorithms (see the chart at the top left of Fig. 8 in appendix and the chart at the bottom, re-spectively). Using the 3-line algorithm, utilities are able to learn the base load, activity load, heating gradient and cooling gradient of a customer. Using the PARX algorithm, utilities can learn the daily average load profile of a customer regardless of the outdoor temperatures in weekday and weekend/holiday, respectively. Also, using the histogram, utilities can learn the hourly consumption distribution of a customer (see the chart at the top right of Fig. 8).
Segmentation.For utilities, one of the most important tasks is to segment customers
accord-ing to their energy consumption and load profiles. Customer segmentation can be used to carry out more precise marketing communication with the customers, e.g., to promote the most appropriate energy-savings programs to a targeted segment. In this layer, utilities can cluster customers based on the extracted consumption features, including base load, activity load, heating and cooling gradients; and the daily load profile of customers; and the shapes of average load over a day, a week or a month. The segmentation is proceeded by using K-means clustering algorithm. To segment customers who have similar load shapes, e.g., over a period of time, we first normalize the load at each of the time series by dividing the total load of that period, then segment them by running a clustering algorithm. The segmentation classifies customers into three segments according to their loads, or their dis-aggregated loads including base load and activity load. The customers can be shown on Google Map, indicated by a different color for each cluster (see Fig. 9).
Forecasting. Energy industry is reliant on balancing energy supply and demand, and thus
requires to predict customer energy consumption. For instance, by predicting the periods of peak demand, utilities can avoid distribution failure by upgrading the infrastructure for more capacity, use dynamic pricing to incentivize customers to lower energy usage during peak times, and give the recommendation of shifting from the peaks. The system supports the following forecasts: individual household forecasting, feed area, and the overall forecasting at the time granularity of daily, weekly, and monthly. The integrated forecast algorithms includ PARX, ARIMA, and exponential smoothing HoltWinters.
Feedback service. Feedback service allows utilities to set the rules of sending alert
consumer’s rank within the neighborhood and within the whole city in terms of overall con-sumption, base load, heating gradient and cooling gradient, and so on. Once a feedback rule is set, the system will automatically send messages with a pre-set time interval.
View my consumption and compare with neighborhoods.In this system, consumers can
ex-plore their own consumption data at different granularities at time dimension, i.e., hourly, daily, weekly or monthly (see Fig. 10). At the finest granular level, the system displays the raw time-series data of the hourly resolution. While, at higher granular levels, the system returns the summarized data. A customer can also compare his/her own consumption with the average of households in the same area. Due to the privacy reason, a customer cannot compare with an individual household. By comparing against the peers, a customer may find the root cause to improve energy efficiency. For example, if the consumption is higher than expected relative to the peers, (s)he may discover that this is due to air conditioners not being set to a higher temperature during nights or using inefficient air conditioners.
7
CONCLUSION AND FUTURE WORK
With the widely implementation of smart meters, smart meters produce considerable volumes of data, presenting the opportunity for utilities to enhance end-customer service, lower cost and improve energy efficiency; and for consumers to reduce the bills and save energy. Smart meter data analytics is a complex process that involves data ingestion, pre-processing, analyzing and visualization. In this paper, we have implemented the system with a hybrid architecture to streamline smart meter data analytics, which consists of the building blocks including Spark, Hive and PostgreSQL/MADlib. The architecture of the system has been divided into ingestion layer, processing layer, and analytics layer, which support open extensions for different data processing units, and different analytics algorithms. The system supports handling realtime data stream and batch analytics for smart meter data, and OLTP operations for social-economic data. We have conducted the benchmark work to evaluate the technologies used in this system, and the results verified the effectiveness for our system design. In the future work, we will evaluate the performance of the system, including the analytics queries performance in the analytics layer, the performance of processing data in batch jobs and realtime stream in the processing layer. It would also be interesting to evaluate the system in handling more other types of data sets, such as data set of IoT, water, gas, and heat consumption data sets, which might arise improving the system, i.e., by adding new analytics algorithms for other data sets.
Acknowledgment.This work is part of the CITIES (NO. 1035-00027B) research project funded by Danish Strategic Research Council.
References
1. J. M. Abreu, F. P. Camara, and P. Ferrao. Using Pattern Recognition to Identify Habitual Behavior in Residential Electricity Consumption. Energy and Buildings, 49:479-487, 2012.
2. A. Albert, T. Gebru, J. Ku, J. Kwac, J. Leskovec, and R. Rajagopal. Drivers of Variability in Energy Consumption. In Proc. of ECML-PKDD DARE Workshop on Energy Analytics, 2013.
3. A. Albert and R. Rajagopal. Building Dynamic Thermal Profiles of Energy Consumption for Individuals and Neighborhoods. In Proc. of IEEE Big Data, pp. 723–728, 2013.
4. A. Albert and R. Rajagopal. Smart Meter Driven Segmentation: What Your Consumption Says About You. IEEE Transactions on Power Systems, 4(28), 2013.
5. C. Anil. Benchmarking of Data Mining Techniques as Applied toPower System Analysis, Master Thesis, Uppsala University, 2013
6. Apache Spark, Available atspark.apache.orgas of 2015-05-15.
7. O. Ardakanian, N. Koochakzadeh, R. P. Singh, L. Golab, and S.Keshav. Computing Electricity Consumption Profiles from Household Smart Meter Data. In Proc. of EnDM Workshop on Energy Data Management, pp. 140–147, 2014.
8. M. Arlitt, M. Marwah, G. Bellala, A. Shah, J. Healey, and B. Vandiver. IoTAbench: an Internet of Things Analytics Benchmark. In Proc. of ICPE, 2015.
9. BigSQL, Available athttp://www.bigsql.orgas of 2015-05-15.
10. B. J. Birt, G. R. Newsham, I. Beausoleil-Morrison, M. M. Armstrong, N. Saldanha, and I. H. Rowlands. Disaggregating Categories of Electrical Energy End-use from Whole-house Hourly Data. Energy and Buildings, 50:93–102, 2012. 11. G. Chicco, R. Napoli, and F. Piglione. Comparisons among Clustering Techniques for Electricity Customer Classification.
IEEE Trans. on Power Systems, 21(2):933-940, 2006.
12. M. Espinoza, C. Joye, R. Belmans, and B. DeMoor. Short-term Load Forecasting, Profile Identification, and Customer Segmentation: A Methodology Based on Periodic Time Series. IEEE Trans. on Power Systems, 20(3):1622-1630, 2005. 13. F. F´’arber, S. K. Cha, J. Primsch, C. Bornhvd, S. Sigg, & W. Lehner. SAP HANA Database: Data Management for
Modern Business Applications. ACM Sigmod Record, 40(4):45-51, 2012.
14. V. Figueiredo, F. Rodrigues, Z. Vale, and J. Gouveia. An Electric Energy Consumer Characterization Framework Based on Data Mining Techniques. IEEE Trans. on Power Systems, 20(2):596-602, 2005.
15. M. Ghofrani, M. Hassanzadeh, M. Etezadi-Amoli and M. Fadali. Smart Meter Based Short-Term Load Forecasting for Residential Customers. North American Power Symposium (NAPS), 2011.
16. KDB+ – The time-series Database for Performance-critical Environments, Available athttp://kx.com/as of 2015-05-15.
17. E. Keogh, and S. Kasetty. On the Need for Time Series Data Mining Benchmarks: A Survey and Empirical Demonstration. Data Miningand Know. Disc. (DMKD), 7(4):349–371, 2003.
18. MADlib, Available atmadlib.netas of 2015-05-15.
19. F. Mattern, T. Staake, and M. Weiss, ICT for green - How Computers Can Help Us to Conserve Energy. In Proc. of e-Energy, pp. 1–10, 2010.
20. A. J. Nezhad, T. K. Wijaya, M. Vasirani, and K. Aberer. SmartD: Smart Meter Data Analytics Dashboard. In Proc. of Future Energy Systems (ACM e-Energy), 213-214, 2014.
21. K. A. Nguyena, R. A. Stewart, H. Zhang, C. Jones. Intelligent Autonomous System for Residential Water end Use Classification: Autoflow. Applied Soft Computing, 31:118–131, 2015.
22. Quartz, Available athttp://www.quartz-scheduler.orgas of 2015-05-15.
23. T. Rasanen, D. Voukantsis, H. Niska, K. Karatzas and M. Kolehmainen. Data-based method for creating electricity use load profiles using large amount of customer-specific hourly measured electricity use data. Applied Energy,
87(11):3538-3545, 2010.
24. B. A. Smith, J. Wong, and R. Rajagopal. A Simple Way to Use Interval Data to Segment Residential Customers for Energy Efficiency and Demand Response Program Targeting. In ACEEE Summer Study on Energy Efficiency in Buildings, 2012.
25. R. A. Stewart, R. Willis, D. Giurco, K. Panuwatwanich, and G. Capati. Web-based Knowledge Management System: Linking Smart Metering to the Future of Urban Water Planning. Australian Planner, 47(2):66-74, 2010.
26. A. Thusoo, J. S. Sarma, N. Jain, Z. Shao, P. Chakka, N. Zhang, and R. Murthy. Hive-a Petabyte Scale Data Warehouse Using Hadoop. In Proc. of ICDE, pp. 996–1005, 2010.
27. G. Tsekouras, N. Hatziargyriou, and E. Dialynas. Two-stage Pattern Recognition of Load Curves for Classification of Electricity Customers, IEEE Trans. Power Systems, 22(3):1120-1128, 2007.
28. J. M. Hellerstein, C. Re, F. Schoppmann, D. Z. Wang, E. Fratkin, A. Gorajek, and A. Kumar. The MADlib Analytics Library: or MAD Skills, the SQL. PVLDB, 5(12):1700-1711, 2012.
29. X. Liu, L. Golab, and I. F. Ilyas. SMAS: A Smart Meter Data Analytics System. In Proc. of ICDE, pp. 1476–1479, 2015. 30. X. Liu, L. Golab, W. Golab, I. F. Ilyas. Benchmarking Smart Meter Data Analytics. In Proc. of EDBT, pp. 385–396, 2015. 31. Y. Liu, S. Hu, T. Rabl, W. Liu, H. A. Jacobsen, K. Wu, and J. Chen. DGFIndex for Smart Grid: Enhancing Hive with a
Cost-Effective Multidimensional Range Index. In Proc. of VLDB, 2014.
32. M. Zaharia, M. Chowdhury, M. J. Franklin, S. Shenker, and I. Stoica. Spark: Cluster Computing with Working Sets. In Proc. of USENIX, 2010.
A
APPENDIX
Fig. 8.A screenshot of consumption pattern discovery
Fig. 9.A screenshot of segmentation