https://doi.org/10.1177/2041419618766153
© 2018 The Authors. Reproduced in accordance with the publisher's self-archiving policy.
[email protected] https://eprints.whiterose.ac.uk/ Reuse
Items deposited in White Rose Research Online are protected by copyright, with all rights reserved unless indicated otherwise. They may be downloaded and/or printed for private study, or other acts as permitted by national copyright laws. The publisher or other rights holders may allow further reproduction and re-use of the full text version. This is indicated by the licence information on the White Rose Research Online record for the item.
Takedown
If you consider content in White Rose Research Online to be in breach of UK law, please notify us by
https://doi.org/10.1177/2041419618766153
International Journal of Protective Structures
1 –17
© The Author(s) 2018 Reprints and permissions: sagepub.co.uk/journalsPermissions.nav DOI: 10.1177/2041419618766153 journals.sagepub.com/home/prs
Local variations in gabion
structures
Sam Clarke
1, Andrew Barr
1, Jim Warren
1,2and Angus Williams
3Abstract
Gabion structures are widely used for force protection as they enable locally available material to be used, reducing logistical expense. The soil fill within these structures provides the blast and ballistic resistance; hence, any localised variation in the contained soil can potentially lead to reductions in protective capability. Specifically, built gabion structures were monitored in internal and external environments to assess the variation of soil moisture content and density over a full year and with changing weather conditions. The gabions were filled with fine sand according to manufacturer’s instructions. Internal and external moisture content readings were recorded at regular intervals, and a continuously monitoring weather station was installed to collect comparative data. LIDAR scanning was used to record the shape and volume of the gabions to estimate variations in the density of the soil fill. The data indicate that moisture content can vary by over 20% between the top and base of the gabion, and by over 5% from face to face and between readings depending on recent weather conditions, while the core of the gabions remains relatively unaffected. This leads to localised variations in density which can impact on both the ballistic performance and blast resistance of the structure.
Keywords
Gabions, moisture content, force protection, HESCO, soil, density
Introduction
Geotextile-lined wire mesh gabions filled with local soil are commonly used to construct defensive base infrastructure for protection against blast and ballistic threats. Recent underpinning work in the Force Protection Engineering (FPE) research programme (Warren et al., 2013) has sought to understand the behaviour of soils in these extreme conditions, including the effect of moisture content and density on fragment penetration in sand. This study presents data on the variability of moisture content and density in sand-filled gabions over time to enable a more realistic evaluation of the protective capability of real-life structures.
1Department of Civil and Structural Engineering, The University of Sheffield, Sheffield, UK 2Blastech Ltd, Sheffield, UK
3QinetiQ, Hampshire, UK
Corresponding author:
Sam Clarke, Department of Civil and Structural Engineering, The University of Sheffield, Mappin Street, Sheffield S1 3JD, UK.
Email: [email protected]
766153PRS0010.1177/2041419618766153International Journal of Protective StructuresClarke et al.
research-article2018
Localised variations in moisture content will also affect the pressure–volume response of the soil and hence its penetrative resistance (Barr et al., 2016; Børvik et al., 2015; Church et al., 2015). Børvik et al. (2015) found that for 0–2 mm sand, the change in moisture content from dry to fully saturated can lead to an increase of up to 100% in the penetration of small arms rounds. Both Dirlewanger et al. (2017) and Børvik et al. (2015) studies show the importance of having an accurate representation of the typical densities and moisture contents which may be encountered in the field. This article aims to inform future studies in this area by providing these data.
Gabion setup
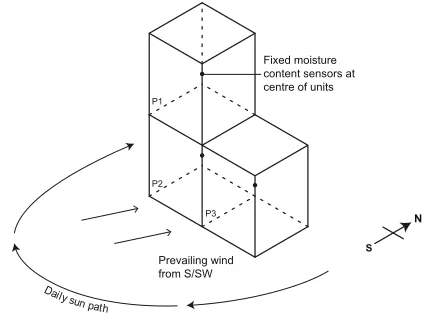
The variability of gabion moisture content and density was monitored in both internal and external environments at the University of Sheffield laboratory near Buxton, Derbyshire, UK. The internal gabion forms a benchmark for the assessment of the external gabions allowing the effects of the weather to be isolated. The test positions and the location of data collection systems for weather and soil moisture are highlighted in Figure 1.
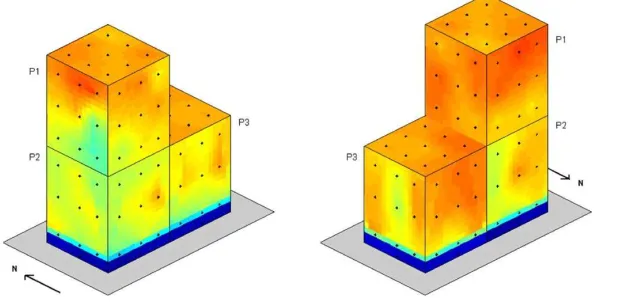
The external structure was formed from three segments of a HESCO MIL-1 unit (P1, P2 and P3), arranged on a concrete base in a two-storey structure as shown in Figure 2. This structure was exposed to the weather. The internal structure consisted of a single segment from a HESCO MIL-1 unit, placed on a concrete base inside a concrete bunker. Although this structure was protected from the elements, the space was unheated.
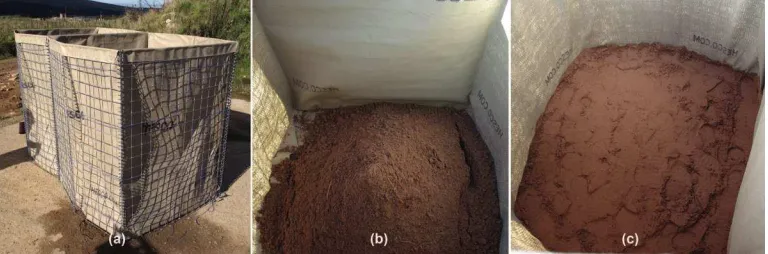
Gabions were filled according to HESCO’s Defensive Barriers Assembly Guide (HESCO, 2015), where fill material is added in layers, evenly distributed and compacted by foot, as shown in Figure 3. It should be noted that while the filled gabions have a complex geometry (see Figure 4), they have been approximated as cuboids in figures throughout this report for ease of representation. The approximate unfilled dimension of a single MIL-1 unit segment is 1.06 m (W) × 1.06 m (D) × 1.37 m (H).
The filling material used in this study was a fine and medium quartz sand. The particles were sub-rounded to sub-angular in shape and the mean particle size was 250 µm, with the majority of particles between 130 and 500 µm.
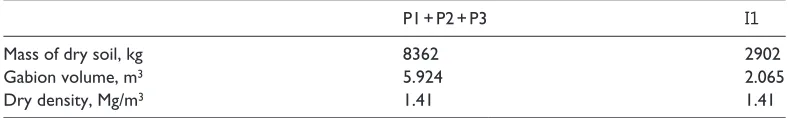
Sand was supplied in 1-tonne bulk bags and was used at its as-received moisture content hence, the initial moisture content varied from layer to layer. The moisture content of each layer was assessed by the change in mass of a sample during oven drying and is summarised in Figure 5. The initial dry density of the sand fill was calculated using the dry mass of fill and the volume of the gabions as assessed by the initial LIDAR (light radar) scan, as shown in Table 1.
Monitoring methodology
Clarke et al. 3
were taken periodically. These readings were complemented by LIDAR scans at quarterly intervals to quantify changes in the overall volume of the gabions and hence variations in density were also calculated.
Internal moisture content
[image:4.482.142.347.66.276.2]Internal measurements were recorded using Irrometer Watermark sensors, which continuously transmitted to the receiver on the Davis Vantage Pro 2 weather station used to record local weather conditions. Sensors were placed at the centre of each gabion, and at the interface between P1 and P2, as shown in Figure 6(a). The sensors consist of a pair of electrodes embedded in a granular Figure 1. Location of internal and external gabions and data collection.
[image:4.482.136.348.322.481.2]matrix, whose moisture content equilibrates with the surrounding soil. Soil water tension (kPa) is measured from the resistance between the electrodes when a current is applied. Care was taken to ensure good contact between the sensor and the surrounding soil on installation, as this is essential for obtaining accurate readings (see Figure 6(b) and (c)).
The sensors provide an integer reading in the range of 0–200 kPa, and calibration is required to define the relationship between water tension and moisture content for the specific soil utilised. Figure 7 shows the relationship obtained from laboratory testing, where Watermark sensors were installed in sand specimens prepared at a known moisture content and allowed to equilibrate. As the sand is relatively coarse compared to typical agricultural soils, the soil water tension is low at moisture contents above 2% and reads 0 kPa (‘saturated’) for all moisture contents above 9%. This limits the useful range of the sensor, but readings of 0 kPa were only obtained at the start of the recording period, as the sensors were required to be installed saturated.
Sensor validation
[image:5.482.48.432.62.189.2] [image:5.482.71.407.242.354.2]As only one internal moisture sensor was installed in each gabion, a control volume was moni-tored to provide an indication of the variation of moisture content into the depth of the gabion. This was achieved by adapting a sealed 9 L plastic box to have HESCO geotextile and mesh on one face, and fitting three moisture sensors at 100, 200 and 300 mm depth into the box, as shown Figure 3. Gabion filling method: (a) deployment, (b) addition of fill material layer and (c) distribution and compaction of layer.
Clarke et al. 5
in Figure 8. The box was filled with the same sand at a mean moisture content of 13% and dry density of 1.40 Mg/m3. This moisture content value includes the water in the sensors, which were
installed wet following the manufacturer’s instructions. Once sealed, the box was stored indoors at room temperature out of direct sunlight.
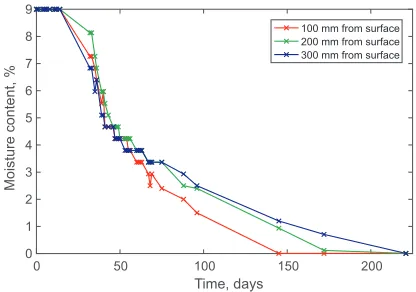
[image:6.482.70.420.61.354.2]Regular readings were taken, as shown in Figure 9. The sensors cannot read moisture contents above 9% as previously mentioned, but once the moisture content falls into the measurable range it can be seen that all three locations initially have a very similar drying response with time. The dry-ing time increases exponentially as the moisture content decreases with the differences between the three sensors becoming more apparent. The 100 mm probe took 145 days with the 300 mm probe taking an extra 50% time. This suggests that at higher moisture contents without weather effects, the soil dries relatively uniformly due to capillary effects. Once the surface has dried sufficiently, how-ever, this action is broken and the drying time of the inner soil is dramatically increased.
Figure 5. Initial fill moisture content: (a) P1, P2 and P3, and (b) I1.
Table 1. Initial gabion dry densities.
P1 + P2 + P3 I1
Mass of dry soil, kg 8362 2902
Gabion volume, m3 5.924 2.065
[image:6.482.47.441.401.460.2]Figure 7. Relationship between Watermark reading and moisture content for fine sand.
[image:7.482.136.341.310.442.2]Figure 8. Control volume for internal moisture content (a) schematic and (b) as built.
[image:7.482.45.432.490.599.2]Clarke et al. 7
External moisture content measurements
The variation in moisture content over the surface of the gabions (5 cm depth) was measured using a Delta-T ML3 ThetaProbe at weekly intervals. The ThetaProbe consists of four steel rods which are inserted into the soil. An electromagnetic field is transmitted into the soil through the rods and is affected by the permittivity of the soil, which varies with moisture content. The ThetaProbe records the resulting output voltage as a reading of volumetric moisture content θ
θ =V
V
w (1)
where Vw is the volume of water and V is the total volume. This can be converted to a geotechnical moisture content w
w M M w
s
= (2)
where Mw is the mass of water and Ms is the mass of soil, using the equation
w w d =θρ
ρ (3)
where ρw is the density of water and ρd is the dry density of the soil.
[image:8.482.140.348.63.209.2]volume of soil, such as in a gabion, are likely to have additional associated error due to local density variations.
The ThetaProbe was used to record the moisture content at nine locations on each face of the gabions, as shown in Figure 11(a), where the regularity of the grid was restricted by the presence of the wire mesh. An additional reading was taken at the base of faces in contact with the ground, as a thin saturated layer was observed at the base of the exterior gabions. The absolute external moisture content measurements for each gabion are shown interpolated over each gabion face (e.g. Figure 13).
Interpolated images are included to aid visualisation of the moisture distribution, but it should be noted that the underlying data grids (black points) are relatively coarse.
Total volume measurement
[image:9.482.136.340.64.200.2] [image:9.482.57.422.250.418.2]The shape and volume of the gabions were monitored using data from LIDAR (light radar) scan-ning, which uses laser light to create an accurate three-dimensional representation of an object. Figure 10. Accuracy of ThetaProbe volumetric moisture content measurements.
Clarke et al. 9
During Scans 1, 3 and 4, measurements were taken at several locations around each target using a Faro Focus 3D X330, which has an accuracy of ±2 mm, corresponding to an upper bound of ±0.020 m3 error in the volume measurement of each gabion. For Scan 2, a Riegl VZ400 was used,
which is more suited to operation in wet weather conditions.
To allow for easy comparisons of the gabion’s shape, sections were taken through both the N-S and E-W axes showing the unfilled and deflected shapes. The total volume during each scan was also recorded.
Weather data
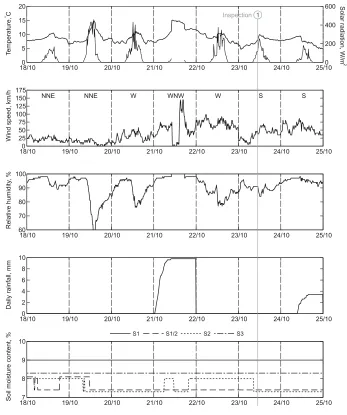
To allow the assessment of the weather conditions on the gabions, local weather data (temperature, humidity, rainfall, wind speed and direction, solar radiation) were recorded every 15 min during the first three months, then every hour once logging resumed in April 2016. The decrease in sampling rate was required to allow longer between data downloads. The values recorded are the average reading over the sampling period, that is, 15 min or 1 h. This could be compared directly to the internal moisture content measurements from the Watermark sensors buried in gabions P1, P2 and P3, which were sampled at the same rate as the weather data.
Results
Due to the sheer volume of data gathered, the results have been collated in two ways: weekly and annual views. The weekly data show daily variations in weather conditions and the resulting effect on the internal moisture content of the gabions. The weather charts and internal moisture content data are placed on the same time base. As the Watermark sensors only output integer values, the sensor data tend to obscure other series when the values are similar. To aid identification of the different sensors, a small offset has been applied to the moisture content data, as shown in Table 2.
During the initial stages, weekly inspections were also carried out to collect surface moisture content data. Absolute external moisture content measurements for all gabions are shown interpo-lated over each gabion face. Interpointerpo-lated images are included to aid visualisation of the moisture distribution, but it should be noted that the underlying data grids (black points) are relatively coarse. The interpolated data have been left coarse to emphasise this.
The annual data show the effect of climatic variation on the internal moisture content. The LIDAR scan data for the external gabions is also presented: sectional data for the internal gabion have not been reported as there was no detectable variation in volume during the 15 months monitoring period. The full data set is available for further interrogation through FigShare (Clarke et al., 2017).
Weekly indicative data and inspections
[image:10.482.47.441.73.110.2]Figure 12 shows the second week after logging began, in which the first inspection took place (as indicated). The data show a relatively dry week at the laboratory, except for the storm on the 21/10 when 10 mm of rain fell in a few hours. Note that solar radiation can be distinguished from temperature due to it dropping to zero every night whereas the temperature does not. It can be seen from the figure Table 2. Moisture content offsets applied to data for clarity.
Sensor S1 S1/2 S2 S3
that over the period of a week, the external weather conditions had no effect on the internal moisture content. However, there is a minor decrease in moisture content with depth from the surface with the S1 sensor remaining saturated throughout the first week (9% is saturated as shown in Figure 7).
[image:11.482.63.410.68.483.2]Clarke et al. 11
The presence of concrete beneath the gabion also exacerbated this issue due to the lack of drainage. As expected, the internal gabion remained relatively uniform with the values being similar to those recorded upon filling (Figure 5(b)).
Annual data
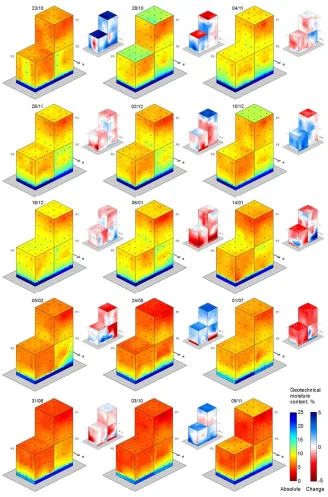
[image:12.482.66.427.61.381.2]The absolute surface moisture content plots are shown in Figure 15, with the change in external moisture content since the last reading also being plotted. For the plots of change, a white image would indicate that no change had occurred, red being a decrease in moisture content and blue being an increase. There are no change plots through the entire series which remain white, demon-strating how susceptible the surface of the gabions is to the prevailing weather. A variation of 5% wetting or drying can be observed over a week depending on recent weather conditions. The key point from this figure is that at no point does the base of the gabion dry out. If sat on an imperme-able surface for long durations, it is suggested that a freely draining material like gravel be used in the base of the gabions to ensure that this does not occur. While this zone will have a minimal impact of the ballistic resistance, it will have a profound influence on the overall stability of the structures against blast, due to the reduction in strength of the soil (during dynamic events) as it approaches saturation.
Figure 13. External soil moisture for P1, P2 and P3, 23/10/2015.
[image:12.482.64.386.66.220.2]Clarke et al.
[image:14.482.83.636.55.421.2]13
is maintained throughout the year. The variation in internal moisture content is minimal when compared with the range in temperature and rainfall seen externally. Interestingly, the internal sen-sors and surface survey do reach a point of equilibrium when comparing the data for October 2016 with the 03/10 surface plot in Figure 15. This occurred after a period of lower rainfall as well as warmer late summer temperatures over a relatively sustained period.
The internal gabion was subject to the same monitoring approach. Figure 17 shows the variation in the surface moisture contents over the year. It should be noted that although protected from the external weather, the space in which the gabion was housed suffered from condensation leading to a wet floor by mid-November, which can be clearly seen in the figure. The base of the gabion was never fully allowed to dry due to the presence of small amounts of water around the base; however, the rest of the gabion progressively dried out over a 9 month period, becoming essentially dry around July 2016.
[image:15.482.47.434.61.382.2]Clarke et al. 15
the material from the exposed top surfaces. The minimal variation in volume also confirms that the level of compaction achieved during filling was sufficient to stop any further densification. This can be clearly seen in Figure 18, which shows the deflected shapes of the gabions evolving with time. There is negligible difference in all areas apart from the top of each of the exposed gabions. Thus, any change in density will be caused by changes in moisture content as the volume and hence, dry density remains constant. This gives a variation in the local bulk density from 1.51 to 1.83 Mg/m3 assuming no change in the initial dry density of 1.41 Mg/m3 and a variation in moisture
content from 3% to 30%.
Conclusion
Data from the external gabions have shown the following:
•
• Surface moisture content generally increased from the top of the gabion downwards, with large surface variations, for example, 3% (relatively dry) on top, 30% (saturated) at base;
•
• Internal moisture content was relatively unaffected by the weather conditions, showing a minor increase in moisture content towards the surface (1%–2%);
•
• Moisture content varied depending on the orientation of gabion faces due to the directional nature of sunlight, wind and rainfall, with variations on the order of 5%;
•
• Moisture content also varied between consecutive readings, with up to 5% wetting or drying observed over a week depending on recent weather conditions.
The variation in moisture content also affected the bulk density of the gabions: the variation from 3% to 30% moisture content increases the local bulk density from 1.45 to 1.83 Mg/m3
assum-ing no change in the initial dry density of 1.41 Mg/m3. LIDAR scans have shown that the overall
volume change of the gabions after filling is negligible; hence, any bulk density changes experi-enced are likely to be caused by local variations in the moisture content of the gabions. The pres-ence of a saturated zone at the base of the gabion when sited on an impermeable base is be of concern to experimentalists and numerical modellers due to the possible reduction in strength in this zone. It is recommended that a well-drained fill material such as gravel be used in the base of gabions installed in such conditions.
[image:16.482.48.442.72.179.2]While it is acknowledged that the trial was conducted in an exposed position in the United Kingdom, and the gabions had little opportunity for drying due to frequent rainfall, high rela-tive humidity and low temperatures, the data show significant variations in moisture content in the test structure. This indicates that there is a likelihood of moisture variation in all gabion structures to some extent, which, combined with a detailed understanding of the varying Table 3. Gabion surveyed volume and associated changes.
Scan P1 P2 P3 I1
1, 13/10/15 1.925 1.998 2.001 2.065
Change −0.016 +0.013 −0.008 −0.002
2, 02/12/15 1.909 2.011 1.993 2.063
Change −0.015 +0.002 −0.013 +0.001
3, 27/01/16 1.894 2.013 1.980 2.064
Change −0.023 +0.013 −0.036 0.000
ballistic performance of sand with moisture content, highlights the possibility of enhancing the performance of sand-filled structures. However, it is unlikely that significant benefits will be realised with current fill-based protective wall structures due to the relatively large thicknesses associated with such structures to ensure structural stability and blast resistance. Nevertheless, with an ongoing desire to produce effective lightweight (or perhaps more realistically lighter-weight) structures that use less material and are potentially easier to construct, the knowledge gained from this field trial warrant an investigation of practical techniques to control and remove moisture from cohesionless fill structures. In addition to this, further work is required both to understand the physics associated with the response of other soil types (e.g. clay, silt, loess) and to understand how the physical regime varies within actual structures (i.e. moisture content, density).
Clarke et al. 17
Declaration of conflicting interests
The author(s) declared no potential conflicts of interest with respect to the research, authorship and/or publi-cation of this article.
Funding
The author(s) disclosed receipt of the following financial support for the research, authorship, and/or publica-tion of this article: The authors wish to thank Dstl for funding the research under the UK Force Protecpublica-tion Engineering programme DSTLX-1000070145.
References
Barr AD, Clarke SD, Rigby SE, et al. (2016) Design of a split Hopkinson pressure bar with partial lateral confinement. Measurement Science and Technology 27(12): 125903.
Børvik T, Dey S and Olovsson L (2015) Penetration of granular materials by small-arms bullets. International Journal of Impact Engineering 75(Suppl. C): 123–139.
Church P, Ingamells V, Wood A, et al. (2015) Development and validation of model for sand. EPJ Web of Conferences 94: 04024.
Clarke SD, Barr AD and Warren JA (2017) HESCO Monitoring Data. Sheffield: The University of Sheffield. Dirlewanger H, Pope D, Russell D, et al. (2017) Enhancement of HESCO Bastion wall models to better pre-dict magnitudes of response under far field loading conditions. In: Proceedings of the 17th international symposium on the interaction of the effects of munitions with structures, Bad Neuenahr, 14 December. HESCO (2015) Defensive Barriers Assembly Guide. Leeds: HESCO Bastion Ltd.
Pope DJ, Dirlewanger H, Russell D, et al. (2015) Gabion systems exposed to blast pressure experimental tests to validate numerical simulations. In: Proceedings of the 16th international symposium on the interac-tion of the effects of muniinterac-tions with structures, Destin, FL, 9–13 November.
Pope DJ, Scherbatiuk K and Fowler J (2005) The use of finite element analysis to generate pressure-impulse diagrams for temporary soil structures. In: Proceedings of the sixth Asia-Pacific conference on shock and impact loads on structures, Perth, WA, Australia, 7–9 December, pp. 457–464. Singapore: CI-Premier PTE Ltd.
Scherbatiuk K (2010) Analytical models for calculating the response of temporary soil-filled walls subjected to blast loading. PhD Thesis, University of Manitoba, Winnipeg, MB, Canada.
Scherbatiuk K and Rattanawangcharoen N (2008) Experimental testing and numerical modeling of soil-filled concertainer walls. Engineering Structures 30(12): 3545–3554.
Scherbatiuk K and Rattanawangcharoen N (2010) A hybrid rigid body rotation model for predicting a response of a temporary soil-filled wall subjected to blast loading. International Journal of Impact Engineering
37(1): 11–26.
Scherbatiuk K, Rattanawangcharoen N, Pope DJ, et al. (2008) Generation of a pressure impulse diagram for a temporary soil wall using an analytical rigid-body rotation model. International Journal of Impact Engineering 35(6): 530–539.