ORIGINAL ARTICLE
Design of Lattice Structures Using Local
Relative Density Mapping Method
Guo‑Hua Song
1, Shi‑Kai Jing
2*, Fang‑Lei Zhao
2, Ye‑Dong Wang
2, Hao Xing
2and Long‑Fei Qie
2Abstract
In order to solve the problem of substantial computational resources of lattice structure during optimization, a local relative density mapping (LRDM) method is proposed. The proposed method uses solid isotropic microstructures with penalization to optimize a model at the macroscopic scale. The local relative density information is obtained from the topology optimization result. The contour lines of an optimized model are extracted using a density contour approach, and the triangular mesh is generated using a mesh generator. A local mapping relationship between the elements’ relative density and the struts’ relative cross‑sectional area is established to automatically determine the diameter of each individual strut in the lattice structures. The proposed LRDM method can be applied to local finite element meshes and local density elements, but it is also suitable for global ones. In addition, some cases are con‑ sidered in order to test the effectiveness of the LRDM method. The results show that the solution time of the LRDM is lower than the RDM method by approximately 50%. The proposed method provides instructions for the design of more complex lattice structures.
Keywords: Lattice structures, Local relative density mapping, Topology optimization, Additive manufacturing
© The Author(s) 2018. This article is distributed under the terms of the Creative Commons Attribution 4.0 International License (http://creat iveco mmons .org/licen ses/by/4.0/), which permits unrestricted use, distribution, and reproduction in any medium, provided you give appropriate credit to the original author(s) and the source, provide a link to the Creative Commons license, and indicate if changes were made.
1 Introduction
Additive manufacturing (AM), also known as 3D print-ing, refers to a process by which a 3D digital model is used to build a part or product by depositing material in layers. The advantage of AM is that it can provide designers with great opportunities to maximize the per-formance of their designed products through the synthe-sis of shapes, sizes, hierarchical structures, and material composition [1]. To an extent, AM can not only reduce material costs but also speed up novel and/or concep-tual designs, especially with the use of foam, honeycomb structures, and lattice structures. The area of lattice structures has received considerable attention owing to their excellent properties: they can be designed and used for multiple purposes, such as weight reduction, heat transfer, energy absorption, thermal and protec-tion [2–6]. The lattice structure with a relative density of 10% is approximately three times stronger than foam [1].
However, it is a challenging task to design lattice struc-tures owing to their geometric complexities and pro-hibitive computational costs in the design process. In the past few decades, several approaches were put forward for the design of lattice structures or mesoscale truss structures with a strut diameter in the range of 0.1 mm to 10 mm, and these methods can be roughly classified into two categories: solid modeling techniques and optimiza-tion techniques.
Wang and Rosen developed a computer-aided design tool for designing truss structures that could easily be incorporated into 3D printed parts [7]. Wallach et al. [8] designed a 3D periodic truss structure using the linear array command. They analyzed the elastic moduli as well as the uniaxial and shear strengths of the truss structures. Wang et al. [9] proposed a parametric modeling method for truss-like structures. Based on a unit cell approach, a conformal lattice structure is designed to enhance the performance of the cellular structure that was devel-oped by Wang [10]. For large truss-like cellular struc-tures, computational complexities can cause difficulties in CAD modeling, and therefore, Wang et al. [11] intro-duced a hybrid geometric modeling method. From the
Open Access
*Correspondence: [email protected]
2 School of Mechanical Engineering, Beijing Institute of Technology,
Beijing 100081, China
above analysis, we can see that solid modeling methods are primarily used for generating truss/lattice structures without considering the optimization problem. Moreo-ver, optimization techniques can also be an effective tool for designing truss/lattice structures. Typical optimiza-tion approaches, such as the ground truss approach and homogenization method, synthesize the topology and geometry of the truss structures [12, 13]. Chu et al. [14] presented a synthesis method using particle swarm opti-mization and least-squares miniopti-mization for designing components comprised of cellular structures. The opti-mization approaches of truss structures are limited by the computational demands of a great number of design variables and/or by the memory limitations of computers [15–18].
Therefore, one of the key problems is how to optimize lattice structures such that the potential for mass reduc-tion and computareduc-tional costs can be fully realized in the design process. A non-iterative size, matching, and scal-ing (SMS) method was proposed by Graf et al. [19]. It eliminates the need for time-consuming optimization by using a combination of a solid-body finite element analy-sis and a pre-defined lattice configuration to generate a structure’s lattice topology. However, the non-iterative SMS approach lacked a truly systematic methodology [20]. To counter the traditional manufacturing limitation, Chang et al. [21] presented a new SMS method in order to take advantage of the potential of additive manufactur-ing. To address the drawbacks of the SMS approach in determining the appropriate diameters for the structure’s struts, a new augmented SMS method that incorporates conformal lattice structure construction methods was presented by Nguyen et al. [22]. They studied the process of generation of lattice structures for a complex shape. However, the design of lattice structures using various SMS methods is only applicable in the case of targeted loading. These methods cannot be used in the case of multiple loading conditions. In addition, a relative den-sity mapping (RDM) method was developed to obtain lat-tice structures that are capable of handling multi-loading conditions without additional computational costs [23]. However, there exist some problems with the principles of the RDM method. Firstly, one of assumptions made is that the relative cross-section diameter of each strut is dependent on the contribution of all the relevant density elements. The distance calculation requires much putational resources due to its exponential time com-plexity. Moreover, the relative density elements include several 0 values, which do not contribution for the strut. Furthermore, the RDM method does not guarantee the structural strength of the generated lattice structures during the mapping process.
To further reduce the computational costs and to improve the performance of the lattice structures,an LRDM method is presented. First, the SIMP method is used to gain a topology optimization result at the mac-roscopic scale. The relative density contour is then extracted using the density contour approach and a tri-angular mesh is generated using a mesh generation algorithm. Finally, a new mapping relationship between the local relative densities and local finite element mesh (FEM) is established to generate the lattice structures. The rest of this paper is organized as follows. We first describe a mesh generating process in Section 2. In Sec-tion 3, we present the LRDM method, and in Section 4, some case studies are used to verify the effectiveness and efficiency of the proposed method. The conclusions drawn are presented in the final section.
2 Mesh Generating Process
The LRDM method uses the triangular FEM because it is difficult to approximate the part’s surface for the unit-cell type mesh used in the RDM method. In order to gener-ate the mesh configuration in the optimized region of the topology optimization result, three following steps are required to be taken.
2.1 Generating Relative Density Point Cloud
First, a density threshold value is set to obtain the point cloud data. The cloud point is set as 1 where the relative density is greater than or equal to the threshold value else, it is set as 0. The formula for the could points is given in Eq. (1). In addition, in order to ensure that the sum of the relative density values remains unchanged, the total number of grayscale elements must be a constant during their conversion to cloud points.
wheref(x,y) is the set of the relative density, and g(x,y) is the set of cloud points. The sum off(x,y) and g(x,y) must be zero. The suitable density threshold value T can then be determined by using the bisection algorithm.
2.2 Density Contour Approach
Although there is no intermediate relative density value in the point cloud data obtained from step (1), there is still a jagged border. In order to obtain a smooth bound-ary, a density contour method is used to reassign the relative density of each element to each node point, and the density contour is obtained using the interpolation (1)
g(x,y)=
255, iff(x,y)≥T, 0, otherwise,
(2)
approach. The relative density of the nodes can be calcu-lated by using an average weight function, and the inter-polation formula is given in Eq. (3). The contour line was reconstructed using the density contour approach and B-spline curves [24]:
where ρk is the relative density of the kth node, M is the number of neighboring elements at this node, and ρk,i is the relative density of the ith neighboring element of the kth node.
2.3 Triangular Mesh Generation
After obtaining the relative density contour from step (2), the triangular mesh is generated using a mesh generation algorithm [25, 26]. The Delaunay algorithm cannot gen-erate a high-quality triangular mesh as there is no cloud data inside the boundary contours. Thus, in order to gen-erate a high-quality triangular mesh, the following steps are required to be followed. First, the Delaunay algorithm is implemented to generate the initial triangular mesh. The mesh can then be optimized and adjusted locally using the mesh generation [26, 27]. The advantage of this approach is that it does not generate an elongated trian-gular mesh. The mesh generation process is illustrated in Figure 1.
3 LRDM Method
3.1 Formulation of LRDM Method
The computational cost can be further reduced by using our proposed schemes. Firstly, it seems reasonable to assume that the relative cross-section diameter of the strut must depend on the local relative densities. The local relative densities refer to the density elements that are located in the range of a circle of radius R having its center at the midpoint of the strut. Secondly, it is possible to reduce the number of FEM by using the mesh genera-tion process in Secgenera-tion 2. Thirdly, an improved strategy
(3) ρk = 1
M
M
i=1
ρk,i,
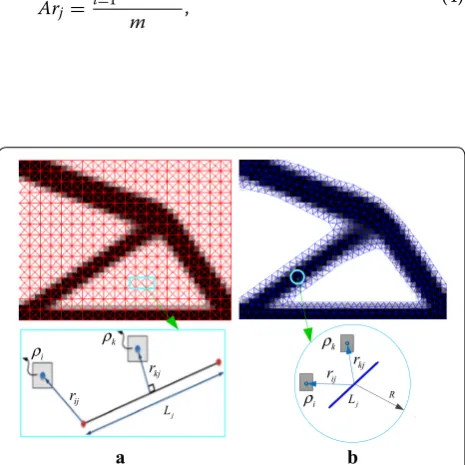
of the distance weight function is presented to reduce the calculation time. The conditions assumed for the RDM and LRDM methods are shown in Figure 2a, b respec-tively. RDM uses the relative densities of the topology optimization and global FEM mesh. LRDM uses local relative densities having a non-zero value and the local FEM mesh. The local FEM mesh refers to the mesh that is located in the optimized region of the topology optimi-zation result.
The key process in the RDM method is the calculation of the distance of all the relative density elements from each line segment in the FEM mesh. The RDM method requires a substantial amount of computing resources because of its exponential time complexity. Moreover, it implements three judgement conditions for determining which relative density element is at the shortest distance from the two endpoints or pedals of each line segment, as shown in Figure 2a. The algorithm efficiency is low for a unit-cell of a few millimeters. To alleviate these deficien-cies, three steps can be taken to improve the efficiency of the RDM algorithm. First, the local relative densities are used to replace the global ones. Secondly, we can reduce the number of meshes with a local mesh in the optimized region. Thirdly, a new distance formula is derived for the LRDM method. Let us assume that there are m rela-tive density elements within the range of the circle j (as shown in Figure 2b), and thus, the improved formula for mapping the relative density of m elements to the struts is given in Eq. (4):
(4)
Arj = m
i=1
ρiω(rij)
m ,
a b c
Figure 1 Mesh generation process: a topology optimization result; b
obtaining density contour; c generating triangular mesh
a b
R ij
r
kj r i
ρ ρk ρk
i
ρ
kj r
j L j
L
ij r
where Arj is the relative cross-sectional area of the strut,
ρi is the relative density, ω is a weight function, m is the number of elements within the radius R, and rij is the distance of element i from strut j. The advantage of the new formula is that it can reduce the computational costs incurred by reducing the number of relative density ele-ments that are far away from the strut during the map-ping process. In addition, a general weight function is also proposed, and its formula is given in Eq. (5):
To ensure the strut diameter is neither too large nor too small, a lower value min(Ar) and a higher value max(Ar) = 1 for the relative cross-sectional area are set during the mapping process. Therefore, the scaling and adjustment of the strut can be performed according to [23]:
The next step is to calculate the scaling factor between the relative cross-sectional area and actual cross-sec-tional area of each strut for the lattice structures. How-ever, it does not guarantee the structure strength of the generated lattice structures because the RDM method uses a fixed volume constraint. Moreover, the strength of lattice structures is governed by their relative den-sity. Therefore, the appropriate relative density may be required to ensure that the elastic modulus of the gener-ated lattice structure is equivalent to the corresponding elastic constants of the topology optimization. According to the Gibson–Ashby model [28], the elastic modulus has a polynomial law relationships with the relative density. For example, for a plane stress problem, the anisotropic constitutive law is σ = Cε. A scaling law between rela-tive density and elastic matrix of lattice structures can be written as follows:
where C (i = 0, 1, 2, ···) are constant symmetric matri-ces that can be determined using a finite element analysis method. The scaling law for the lattice cellular structure can be formulated from the FEA simulation results as a function of the density. Based on Hashin–Shtrikman bounds the valid range of relative density is 0.41 to 0.76 for 2D lattice structures [29]. Similarly, the valid range of relative density is 0.44 to 0.79 for 3D lattice structures. Therefore, the lower actual cross-sectional area of the strut is obtained using Eqs. (8) and (9):
(5) ω(rij)=exp(−krij).
(6)
Arj=
1−min(Ar) max(Ar)−min(Ar)
× [Arj−max(Ar)] +1.
(7) C(ρ)=C0+C1ρ+C2ρ2+ · · ·,
(8) ρv =
ρ∗
ρs =c0
dmin l ,
where c0 is a near-unity numerical constant, dmin is the diameter of the strut, l is the length of the strut, and Armin is the lower value of the actual cross-sectional area. Therefore, the scaling factor Sf can be calculated to determine appropriate values for the cross-sectional areas of all the struts. The values of Ar are then scaled accordingly:
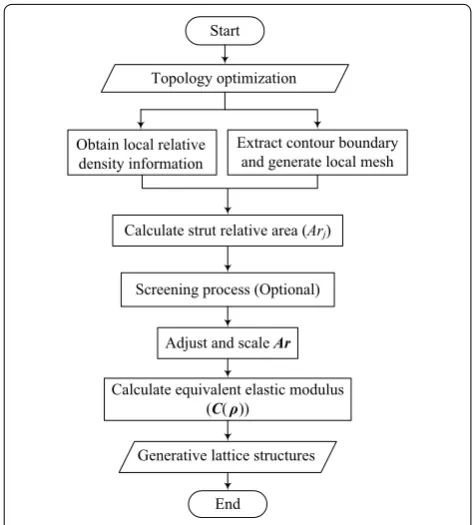
Using Eqs. (4)–(11), the lattice structures can be gener-ated, and the structural strength of the obtained design can be guaranteed based on the equivalent elastic modu-lus of lattice structures. The overall process of the pro-posed LRDM method is summarized in Figure 3.
The main difference between RDM and LRDM is that the RDM process starts with two inputs: the information from the topology optimization and a coarse FEM, while the LRDM process starts with only one input: the topol-ogy optimization. Secondly, the key principles of RDM
(9) Armin=π
dmin
2 2
,
(10) Sf = Armin
min(Ar),
(11)
Ar=Sf ·Ar.
Extract contour boundary and generate local mesh Start
Topology optimization
Obtain local relative density information
Calculate strut relative area (Arj)
Screening process (Optional)
Adjust and scaleAr
Calculate equivalent elastic modulus (C(ρ))
Generative lattice structures
and LRDM are essentially different. The RDM method depends on the relative densities of all the elements and all the FEMs in the design region, while the LRDM method only requires the relative densities of the local elements and local FEM. Thirdly, different formulas are used to calculate the strut relative area in each method. A weighted average is used in the RDM method while a geometric mean is used in the LRDM. Furthermore, the formulas used to calculate the scaling factor Ar and the vector min(Ar) are also different.
3.2 LRDM Method Validation
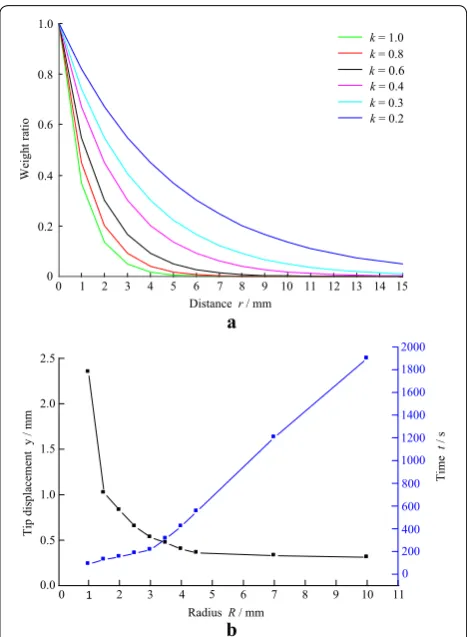
To validate the hypothesis of the LRDM method as well as to address the effect of the constant k and the distance rij on the weight function in Eq. (5), a simply supported beam is considered. The structure of the beam is simi-lar to that in Ref. [29]. The design domain is discretized using 80 × 20 elements, the volume fraction is 0.35, and the properties of the beam are shown in Table 1 (case 1). A penalization factor of 3 is used in the optimization pro-cess in all cases in this paper. Two 2D lattice structures are generated in the RDM method and LRDM method using the relative density information obtained from by-products of the topology optimization. The same unit-cell type and unit-cell sizes are used in both the methods. The effects of different constant k and the distance rij on the weight function are shown in Figure 4a. As shown in the Figure, an increase in rij leads to a reduction in the weight function ω(rij) until a zero value is reached for a given dif-ferent constant k (k = 0. 2, 0.3, 0.4, 0.6, 0.8, and 1.0). The trends in these curves show that the strut’s relative cross-sectional area has no effect on the relative density ele-ments that are beyond a certain distance from the strut his result is also shown in Figure 4b. It was found that an increase in the radius R leads to a reduction in the tip displacement until a final steady-state value is reached; however, the corresponding solution time has been sub-stantially increased. Therefore, it is reasonable to rely on the contribution of local relative density elements.
In order to precisely test the solution time of the RDM and LRDM methods, the same unit-cell type is used to generate the 2D lattice structures. The second
case (Table 1) is the same as that in Ref. [23], which is a cantilevered beam loaded at the middle of the right tip using the same topology optimization results. The lattice structures are generated using the RDM method with the lower relative cross-sectional value of 0.01, the size of the element is 2.5 mm×2.5 mm. While the LRDM method uses the same unit-cell type, R=6.5 mm and k=1.0.
The solution times for the RDM method are 30 s for generating the lattice structure and only 11 s for gener-ating the lattice structure using the LRDM method. The RDM method requires more time to calculate the dis-tance of all the relative density elements from each strut in the FEM. As for the LRDM method, it only calculates some of the relative density elements that are located in the range of a circle of radius 6.5 mm with its center at the midpoint of the strut. The RDM method pro-duced the smallest tip displacement of 0.635 mm. The LRDM method result had a displacement of 0.613 mm, which is only 3.5% lower than that obtained with the RDM method. The results show that the LRDM method Table 1 2D and 3D beams
Properties Case 1 Case 2 Case 3 Case 4
Length (mm) 80 40 80 40
Height (mm) 20 10 40 10
Thickness (mm) 4 1 1 4
Loading magnitude (N) 100 1 1 1
Elasticity modulus (MPa) 1960 1960 1960 1960
b a
1
0 2 3 4 5 6 7 8 9 10 11
0.0 0.5 1.0 1.5 2.0 2.5
0 200 400 600 800 1000 1200 1400 1600 1800 2000
Ti
p
di
sp
la
ce
m
en
ty
/m
m
RadiusR/ mm
Time
t
/s
0 1 2 3 4 5 6 7 8 9 10 11 12 13 14 15 0
0.2 0.4 0.6 0.8 1.0
k= 1.0
k= 0.8
k= 0.6
k= 0.4
k= 0.3
Distancer/ mm
Weight
ratio
k= 0.2
is more efficient with respect to computational costs as compared with the RDM method for almost the same structural strength. Here, we note that our method can-not only be applied to the global FEM but is also suitable for the local FEM.
To test the computational accuracy and convergence of the RDM and LRDM methods, three elements of differ-ent sizes are generated using RDM and LRDM and the same topology optimization result. There are two types of unit-cells with a set size L of 1 mm×1 mm, 2 mm×2 mm, 3 mm×3 mm and 1 mm, 2 mm, and 3 mm, respectively. A regular triangular unit-cell is chosen for the compari-son between the RDM and LRDM methods because it is convenient for controlling the unit-cell size. A 2D canti-lever beam is used, and the design domain is discretized into 80×20 elements. Figure 5 shows the lattice struc-ture generated using the RDM and LRDM methods for R = 3L. The results of the computation accuracy and con-vergence of the RDM and LRDM methods are summa-rized in Table 2.
Table 2 shows that the average computation accuracy of RDM is 2.05% higher than that of LRDM. One possi-ble reason is that the total volume of the generated lattice structure must meet the volume constraint in the RDM method. The average iterative number for RDM is 43.62% higher than that for LRDM. The main reason for this is the use of the local relative density information and the triangular mesh.
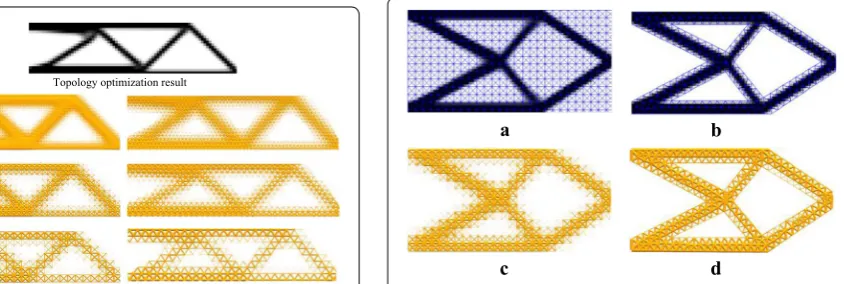
4 Case Illustrations and Analysis 4.1 2D Cantilever Beam
To demonstrate the performance of the LRDM method, a 2D cantilever beam is used with the SIMP method. The third case is similar to that in Ref. [30]. The design domain is discretized into 80×40 elements, and a vertical unit force is considered at the middle of the right end of
the beam. The properties of the 2D cantilever beam are shown in Table 1 (case 3). Figure 6a, b show the results of the topology optimization and the generation of the FEM with the same unit-cell size of 1 mm. The lower rel-ative cross-sectional area and the rejection ratio are set as 0.001 and 0.1, respectively for the RDM method. As for the LRDM method, the radius is 6.5 times the length of the cell of the density element. Figure 6c, d show the generated lattice structure with 616 and 587 struts using the RDM and LRDM methods respectively. The RDM method result showed the smallest tip displacement of 0.383 mm. The LRDM method result showed a dis-placement of 0.347 mm, which was 9.4% lower than that obtained with the RDM method. The solution time for generating the lattice structure with the RDM method was 76 s and only 32 s in the case of the LRDM method.
The reason why different proportions for case 2 and case 3 is that the same FEM is used to map the topology optimization result to the lattice structure with RDM and LRDM methods respectively in case 2. The various FEMs are adopted to generate different lattice structures with RDM and LRDM in case 3. Thus, the various FEMs may
Topology optimization result
RDM method LRDM method
Figure 5 Lattice structures generated with various unit‑cell sizes using RDM and LRDM methods
Table 2 Test results of computation accuracy
and convergence for RDM and LRDM methods
Method Mesh size (mm) Target volume (mm3)
Optimized volume (mm3)
Iteration no.
RDM 1 × 1 50 48.1304 143
LRDM 1 50 47.7206 84
RDM 2 × 2 40 38.0690 86
LRDM 2 40 37.0607 51
RDM 3 × 3 30 27.8695 45
LRDM 3 30 27.0312 23
a b
d c
result in different proportions of the LRDM method to some extent.
4.2 3D Cantilever Beam
To verify the effectiveness of the proposed method, a 3D cantilever beam is used to generate a lattice structure using the LRDM method, which is then compared with that obtained using the RDM method. The beam has a length of 40 mm, height of 10 mm, and thickness of 4 mm. The properties of the 3D cantilever beam are shown in Table 1 (case 4). The prismatic design is fully con-strained at one end and a unit distributed vertical load is applied downwards on the lower free edge. Figure 7a shows the topology optimization result for solving the minimum compliance problem under a 30% volume frac-tion constraint. Figure 7b shows the generated FEM with a unit-cell size of 2 mm × 2 mm, and the unit-cell type is the same as that used with the RDM method. Figure 7c shows the FEM generated using the Delaunay algorithm with a unit-cell size of 1 mm × 1 mm. Figure 7d, e show the 3D lattice structures generated using the RDM and LRDM methods, respectively, with the same volume constraint.
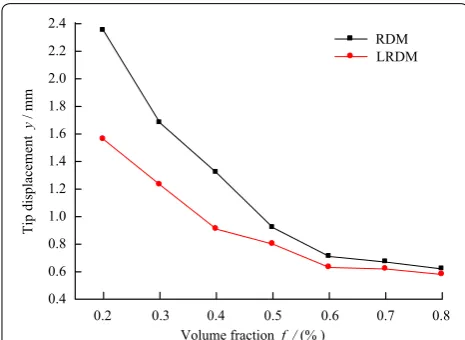
The variation in the tip displacement and solution time of the generated lattice structures are displayed in Fig-ures 8 and 9 for various volume fractions. An increase in the volume fraction leads to a reduction in the tip dis-placement while the disdis-placement gap of the RDM and LRDM methods is also gradually reduced. The gap reduc-tion in the tip displacement is caused by the gradual removal of the partial volume in the topology optimiza-tion process.
It should be noted that the solution time for the lat-tice structure generated using the RDM method remains almost unchanged as the volume fraction of the topol-ogy optimization increases. In the case of the LRDM method, the solution time of the generated lattice struc-ture increases gradually as the volume fraction increases in the topology optimization, but the solution time is still less than that of the RDM method. The reason for this phenomenon is that the computational cost is relate to the number of FEMs and relative density elements. In the case of the RDM method, the number of FEMs is fixed once the initial design area is set; however, the number of FEMs increases with the increase in the volume fraction of the LRDM method during the mapping process.
In order to test the structural strength of the lat-tice structures using the two models from Figure 7d, e, we print them with the help of a MakerBot Replicator 2 printer using fused deposition modeling technology. We use a plastic PC-ABS material with a yield strength of 4.1×10⁷ N/m2. An electromechanical universal test-ing machine (HUALONG WDW-100) is used to evalu-ate the strength of the printed lattice structures. We ran compression tests for the two printed lattice structures. The 2460.467 g lattice structure that was tested using the RDM method could resist a force of 983.7 N; the other lattice structure tested using the LRDM method, failed at an applied force of 1153.5 N with a mass of 2450.074 g. Therefore, the calculated strength-to-weight ratio of the LRDM method is 14.83% higher than that of the RDM method. Moreover, we can calculate the strength using a simple formula based on the volumetric density [23]. The volume fraction of the lattice structures optimized with the RDM and LRDM are 0.3045% and 0.3568%, respec-tively. The theoretical calculation results are 14.65%
a
c
d e
b
Figure 7 Generated 3D lattice structures using RDM and LRDM methods: a RDM 3D mesh; b LRDM 3D mesh; c Topology optimization result; d RDM 3D lattice structures; e LRDM 3D lattice structures
0.2 0.3 0.4 0.5 0.6 0.7 0.8
0.4 0.6 0.8 1.0 1.2 1.4 1.6 1.8 2.0 2.2 2.4
Volume fractionf /(% )
RDM LRDM
Ti
pd
isplacement
y
/m
m
higher than that obtained with the RDM, which almost the same as the experiment results.
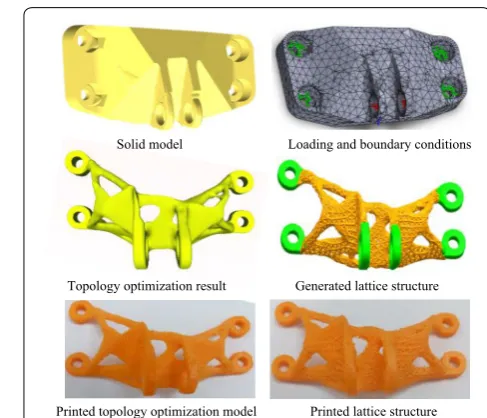
4.3 Micro Jet Engine Bracket
To demonstrate the applicability of the LRDM method for complex 3D structures, a micro jet engine bracket [31] is designed and optimized using a continuum topol-ogy optimization (SIMP). The optimization problem can be stated as follows:
where c is the compliance, U and F are the global force vector and displacement respectively; K is the global stiff-ness matrix, xe is the element density, V(x) is the lattice structure volume, V0 is the design domain volume, and f is the prescribed volume fraction. Here, V0 = 480000 mm3, f=0.3, and F=42000 N. The bracket is to be sub-jected to two loads and supported as shown in Fig-ure 10b. Figure 10a shows the original bracket model. Figure 10c shows an optimized 3D model obtained using the topology optimization. Figure 10d shows the lattice structures with 5837 struts that are generated using the LRDM method. The solution time for the LRDM method is 2468 s. The RDM method would not be able to gener-ate a complex mesh, as the RDM would not be a feasible choice in this case. As compared to the topology optimi-zation, it can be estimated that LRDM saves 9.8% mate-rial despite its longer generation time.
(12)
minc(x)=UTKU = N e=1
Ee(xe)uTek0ue,
s.t.,V(x)/V0=f,
KU=F,
0≤x≤1,
5 Conclusions
1. The average iterative number of RDM is 43.62% higher than that of LRDM, and the average compu-tation accuracy of RDM is 2.05% higher than that of LRDM for the same two-dimensional mesh.
2. As compared to the continuum topology optimiza-tion, the LRDM method can save approximately 9.8% 3D printing material for the same 3D model.
3. It is no contributions to the strut’s relative cross-sec-tional diameter to the relative density elements that are beyond a certain distance away from the strut for RDM and LRDM method.
4. The solution time of the lattice structures generated using the LRDM method is approximately 50% lower than that of the RDM method.
Authors’ Contributions
G‑HS and S‑KJ was in charge of the whole trial; F‑LZ and Y‑DW wrote the manuscript; HX and L‑FQ assisted with sampling and laboratory analyses. All authors read and approved the final manuscript.
Author Details
1 Beijing Xinghang Mechanical‑electrical Equipment Co. Ltd., Beijing 100074,
China. 2 School of Mechanical Engineering, Beijing Institute of Technology,
Beijing 100081, China.
Authors’ Information
Guo‑Hua Song, born in 1984, is currently an engineer at Beijing Xinghang Mechanical and Electrical Equipment Co. Ltd, China. His main research interests include structure design, additive manufacturing and topology optimization.
Shi‑Kai Jing, born in 1975, is currently a lecturer and a master candidate supervisor at School of Mechanical Engineering, Beijing Institute of Technology, China. He received his PhD degree from Northwestern Polytechnical University, Xi’an, in 2005. His research interests include product data management,
0.2 0.3 0.4 0.5 0.6 0.7 0.8
20 30 40 50 60 70 80 90 100
Volume fraction f /(%)
RDM LRDM
So
lut
ion
tim
e
t
/s
Figure 9 Comparison of the solution time of generated lattice structure for various volume fractions
Solid model Loading and boundary conditions
Topology optimization result Generated lattice structure
knowledge management, design theory and method, and manufacturing services technology.
Fang‑Lei Zhao, born in 1991, is currently a master candidate at School of Mechanical Engineering, Beijing Institute of Technology, China. His main research interests include additive manufacturing and functionally graded materials.
Ye‑Dong Wang, born in 1993, is currently a master candidate at School of Mechanical Engineering, Beijing Institute of Technology, China. His main research interests include additive manufacturing and functionally graded materials.
Hao Xing, born in 1991, is currently a master candidate at School of Mechanical Engineering, Beijing Institute of Technology, China. His main research interests include additive manufacturing and functionally graded materials.
Long‑Fei Qie, born in 1989, is currently a PhD candidate at School of Mechanical Engineering, Beijing Institute of Technology, China. His main research interests include additive manufacturing and topology optimization.
Competing Interests
The authors declare that they have no competing interests.
Funding
Supported by National Hi‑tech Research and Development Program of China (863 Program, Grant No. 2015BAF04B00), and China Aerospace Science and Technology Corporation Program of China (CASIC Program, Grant No. 461717).
Publisher’s Note
Springer Nature remains neutral with regard to jurisdictional claims in pub‑ lished maps and institutional affiliations.
Received: 7 June 2016 Accepted: 28 September 2018
References
[1] Gibson, D W Rosen, B Stucker. Additive manufacturing technologies. New York: Springer, 2010: 283–300.
[2] J Banhart. Manufacture, characterisation and application of cellular met‑ als and metal foams. Progress in Materials Science, 2001, 46(6): 559–632. [3] A G Evans, J W Hutchinson, N A Fleck, et al. The topological design of
multifunctional cellular metals. Progress in Materials Science, 2001, 46(3): 309–327.
[4] A Takezawa, M Kobashi, M Kitamura. Porous composite with negative thermal expansion obtained by photopolymer additive manufacturing. APL Materials, 2015, 3(7): 076103.
[5] L J Gibson. Biomechanics of cellular solids. Journal of Biomechanics, 2005, 38(3): 377–399.
[6] S Varanasi, J S Bolton, T H Siegmund, et al. The low frequency perfor‑ mance of metamaterial barriers based on cellular structures. Applied Acoustics, 2013, 74(4): 485–495.
[7] H V Wang, D W Rosen. Computer-aided design methods for the additive fabrication of truss structure. School of Mechanical Engineering, Georgia Institute of Technology, 2001.
[8] J C Wallach, L J Gibson. Mechanical behavior of a three‑dimensional truss material. International Journal of Solids and Structures, 2001, 38(40): 7181–7196.
[9] H Wang, D W Rosen. Parametric modeling method for truss structures. ASME 2002 International Design Engineering Technical Conferences and Computers and Information in Engineering Conference, Quebec, Canada, September 29–October 2, 2002: 759–767.
[10] H V Wang. A unit cell approach for lightweight structure and compliant mechanism. Georgia Institute of Technology, 2005.
[11] H Wang, Y Chen, D W Rosen. A hybrid geometric modeling method for large scale conformal cellular structures. ASME 2005 International Design
Engineering Technical Conferences and Computers and Information in Engi-neering Conference, Long Beach, USA, September 24–28, 2005: 421–427. [12] S Gonella, M Ruzzene. Homogenization and equivalent in‑plane proper‑ ties of two‑dimensional periodic lattices. International Journal of Solids and Structures, 2008, 45(10): 2897–2915.
[13] J Patel, S K Choi. Classification approach for reliability‑based topology optimization using probabilistic neural networks. Structural and Multidisci-plinary Optimization, 2012, 45(4): 529–543.
[14] J Chu, S Engelbrecht, G Graf, et al. A comparison of synthesis methods for cellular structures with application to additive manufacturing. Rapid Prototyping Journal, 2010, 16(4): 275–283.
[15] L Liu, J Yan, G Cheng. Optimum structure with homogeneous optimum truss‑like material. Computers & Structures, 2008, 86(13): 1417–1425. [16] D Rosen. Design for additive manufacturing: past, present, and future
directions. Journal of Mechanical Design, 2014, 136(9): 090301. [17] Y Tang, A Kurtz, Y F Zhao. Bidirectional evolutionary structural optimiza‑
tion (BESO) based design method for lattice structure to be fabricated by additive manufacturing. Computer-Aided Design, 2015, 69: 91–101. [18] T Stankovic, J Mueller, P Egan, et al. A generalized optimality criteria
method for optimization of additively manufactured multimaterial lattice structures. Journal of Mechanical Design, 2015, 137(11): 111405. [19] G C Graf, J Chu, S Engelbrecht, et al. Synthesis methods for lightweight
lattice structures. ASME 2009 International Design Engineering Technical Conferences and Computers and Information in Engineering Conference, San Diego, California, USA, January 01, 2009: 579–589.
[20] P S Chang, D W Rosen. An improved size, matching, and scaling method for the design of deterministic mesoscale truss structures. ASME 2011 International Design Engineering Technical Conferences and Computers and Information in Engineering Conference, Washington DC, USA, 2011: 697–707.
[21] P S Chang, D W Rosen. The size matching and scaling method: a synthesis method for the design of mesoscale cellular structures. International Journal of Computer Integrated Manufacturing, 2013, 26(10): 907–927. [22] J Nguyen, S Park, D W Rosen. Heuristic optimization method for cellular
structure design of light weight components. International Journal of Precision Engineering and Manufacturing, 2013, 14(6): 1071–1078. [23] M Alzahrani, S K Choi, D W Rosen. Design of truss‑like cellular structures
using relative density mapping method. Materials & Design, 2015, 85: 349–360.
[24] A V Kumar, D C Gossard. Synthesis of optimal shape and topology of structures. Journal of Mechanical Design, 1996, 118(1): 68–74.
[25] M Bern, D Eppstein. Mesh generation and optimal triangulation. Comput-ing in Euclidean Geometry, 1995, 4: 47–123.
[26] S H Lo. A new mesh generation scheme for arbitrary planar domains. International Journal for Numerical Methods in Engineering, 1985, 21(8): 1403–1426.
[27] P O Persson, G Strang. A simple mesh generator in MATLAB. SIAM Review, 2004, 46(2): 329–345.
[28] L J Gibson, M F Ashby. Cellular solids: structure and properties. Cambridge University Press, 1999.
[29] P Zhang, J Toman, Y Yu, et al. Efficient design‑optimization of variable‑ density hexagonal cellular structure by additive manufacturing: theory and validation. Journal of Manufacturing Science and Engineering, 2015, 137(2): 021004.
[30] E Biyili, A C To. Proportional topology optimization: a new non‑gradient method for solving stress constrained and minimum compliance problems and its implementation in MATLAB. Plos One, 2015, 10(12): e0145041.