This is a repository copy of
Fault Detection Algorithm for Multiple GCPV Array
Configurations
.
White Rose Research Online URL for this paper:
http://eprints.whiterose.ac.uk/127730/
Version: Accepted Version
Proceedings Paper:
Dhimish, M, Holmes, V, Dales, M et al. (4 more authors) (2017) Fault Detection Algorithm
for Multiple GCPV Array Configurations. In: 2017 IEEE Manchester PowerTech.
PowerTech 2017, 18-22 Jun 2017, Manchester, UK. IEEE . ISBN 978-1-5090-4237-1
https://doi.org/10.1109/PTC.2017.7980825
Copyright IEEE. Personal use of this material is permitted. Permission from IEEE must be
obtained for all other uses, in any current or future media, including reprinting/republishing
this material for advertising or promotional purposes, creating new collective works, for
resale or redistribution to servers or lists, or reuse of any copyrighted component of this
work in other works.
[email protected] https://eprints.whiterose.ac.uk/
Reuse
Items deposited in White Rose Research Online are protected by copyright, with all rights reserved unless indicated otherwise. They may be downloaded and/or printed for private study, or other acts as permitted by national copyright laws. The publisher or other rights holders may allow further reproduction and re-use of the full text version. This is indicated by the licence information on the White Rose Research Online record for the item.
Takedown
If you consider content in White Rose Research Online to be in breach of UK law, please notify us by
Fault Detection Algorithm for Multiple GCPV Array
Configurations
Mahmoud Dhimish, Violeta Holmes, Mark Dales, Peter
Mather, Martin Sibley
Dept. Computing and Engineering University of Huddersfield Huddersfield, United Kingdom
Benjamin Chong, Li Zhang
School of Electronic and Electrical Engineering Leeds University
Leeds, United Kingdom
Abstract—In this paper, a fault detection algorithm for multiple
grid-connected photovoltaic (GCPV) array configurations is introduced. For a given set of conditions such as solar irradiance and photovoltaic module temperature, a number of attributes such as power, voltage and current are calculated using a mathematical simulation model. Virtual instrumentation (VI) LabVIEW software is used to monitor the performance of the GCPV system and to simulate the theoretical I-V and P-V curves of the examined system. The fault detection algorithm is evaluated on multiple GCPV array configurations such as series, parallel and series-parallel array configuration. The fault detection algorithm has been validated using 1.98 kWp GCPV system installed at the University of Huddersfield. The results indicates that the algorithm is capable to detect multiple faults in the examined GCPV plant and can therefore be used in large GCPV installations.
Index Terms—Photovoltaic (PV); Fault detection algorithm;
GCPV multiple array configurations; VI LabVIEW software.
I. INTRODUCTION
Over the past few years, the number of photovoltaic (PV) systems has increased rapidly at global level. Grid-connected PV (GCPV) plants with size varying from a few kWp to hundreds of MWp (commercial/industrial and utility-scale systems) represent worldwide the power technology with the highest growth rate. As reported in [1], at the end of 2014 the total installed PV capacity was 177GWp. This result is not only related to the incentives given by governments during the past years but also to the recent attainment of the grid-parity in key countries such as Germany and Italy.
It is important to facilitate a reliable fault detection algorithm which can be adapted in GCPV plants. Currently, there are several fault detection algorithms that are proposed to detect faults in photovoltaic installations. In [2] proposed a new procedure for fault detection in GCPV systems based on the evaluation of the current and voltage indicators. The algorithm is based on mathematical modelling of the current and voltage across GCPV plants. However, M. Dhimish et al. [3 and 4] proposed a fault detection algorithm for GCPV systems based on a new statistical analysis technique called t-test. The fault detection algorithm can determine the location and the type of the faults in the DC-side of the GCPV system.
Moreover, W. Chine et al. [5] proposed a novel fault diagnosis technique that allows detecting multiple faults in the GCPV systems such as short circuit fault in PV module, bypass diodes failures and partial shading effect in group of cells equipped by a faulty bypass diodes.
Ehsan el al. [6] proposed a solution for a real-time FPGA based switch failure diagnosis and fault tolerant DC-DC converter method. The method is based on the analysis of the current levels in the DC-DC converter in PV applications. Furthermore, hot spot fault detection in PV applications is an active area of research nowadays. In [7] presented a novel hot-spot detection approach which can be used in GCPV systems. The algorithm is based on the AC parameters characteristics of the PV modules.
Faults such as module failure, partial shading, shadow effect with faulty bypass diode and shadow effect with connection fault can be monitored using different monitoring platforms such as virtual instrumentation (VI) LabVIEW [8] and MATLAB/Simulink [9].
In this work, a fault detection algorithm for multiple GCPV array configuration is presented. Three different array configurations are examined: Series array, Parallel array and Series-Parallel array configuration.
The algorithm was developed based on 1.98 kWp GCPV system installed at the University of Huddersfield. The theoretical simulation of the examined GCPV system is carried out using virtual instrumentation (VI) LabVIEW software.
II. METHODOLOGY
A. Data Acquisition
The GCPV system used in this work consists of a grid-connected PV plant which contains 9 polycrystalline silicon PV modules with a nominal power of 220 Wp. The PV modules are connected to a controlling unit which is used to facilitate the different GCPV array configuration for the GCPV plant. The controlling unit is connected to a maximum power point tracker (MPPT) that has output efficiency ≥ 98.5%. The DC current and voltage are measured using the internal sensors which are part of the
Flexmax MPPT unit. A battery bank is used to store the energy that is produced by the GCPV plant.
Vantage Pro monitoring unit is used to receive the global solar irradiance measured by Davis weather station which includes pyranometer. Hub 4 communication manager is used to facilitate acquisition of module temperature using Davis external temperature sensors, and the electrical data for each photovoltaic string. VI LabVIEW software is used to implement data logging and monitoring functions of the GCPV system. Fig. 1 illustrates the overall system architecture of the GCPV plant.
The SMT6 (60) P solar module manufactured by Romag has been used in this work [3]. The standard test condition (STC) for these solar panels are: solar irradiance = 1000 W/m2 and module temperature = 25 oC.
The real-time measurements are taken from averaging 60 samples, each sample is taken at 1 s interval. Therefore, the obtained results of the power, voltage and current are calculated at one minute interval for each sample.
B. Examined GCPV Configrations
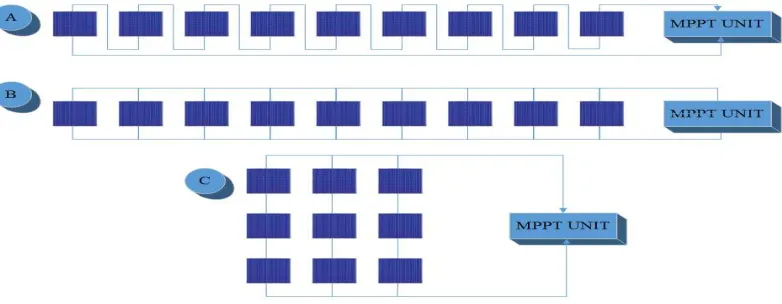
There are three different GCPV array configurations which are studied in this paper. As shown in Fig. 2, series, parallel and series-parallel configurations are examined. The main difference between each of the GCPV array configuration can be illustrated in the following:
1. The current of the series configuration under STC is equal to the current of one PV module: 7.67 A.
2. The voltage of the parallel configuration under STC is equal to the voltage of one PV module: 28.7 V.
3. The series-parallel configuration has 3 series connected PV modules with 3 parallel PV strings. The voltage and the current under STC for this particular array configuration is equal to 86.1 V and 23.01 A respectively.
III. PROPOSED FAULT DETECTION ALGORITHMS
A. Algorithm 1: Series GCPV Configuration
Algorithm (1) is used to diagnose the faults occurred in the GCPV series array configuration. The faults in this type of array configuration can be diagnosis using the power and the voltage ratios between the theoretical GCPV calculations with the real-time long-term measured power output of the examined GCPV system.
The power and the voltage ratios are given by the following expressions:
Power Ratio (PR) = Ptheretical / Pmeasured (1)
Voltage Ratio (VR) = Vtheretical / Vmeasured (2)
where the Pmeasured and Vmeasured are the measured power
and voltage of the examine GCPV plant.
The analysis of the PR and VR for the GCPV system can be used to create a fault diagnosis rules which are described in Table I. Each power and voltage region describes a faulty condition which might occur in the GCPV plant.
[image:3.612.58.552.477.711.2]Since the power and the voltage does change rapidly during each faulty condition the current ratio of the GCPV series configuration system does not play a major role in the fault detection rules.
B. Algorithm 2: Parallel GCPV Configuration
Algorithm 2 is used to diagnose the faults occurred in the parallel GCPV array configuration system. This algorithm is based on the analysis of the power and current of the examined GCPV system. The power ratio can be calculated using (1). The current ratio is calculated using (3).
Current Ratio (CR) = Ctheretical / Cmeasured (3)
As shown in Table I, it is possible to observe the difference between each faulty condition which might occur in the parallel GCPV array configuration.
During the simulation process, the voltage of the parallel GCPV array configuration does not change rapidly. Therefore,
it is possible to examine the faulty conditions based only on the power and the current ratios.
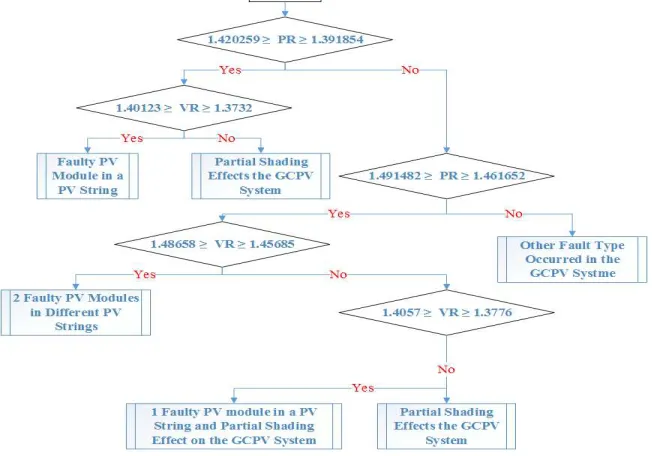
C. Algorithm 3: Series-Parallel GCPV Configuration
This algorithm is used to diagnoses the faults in the series-parallel GCPV array configuration. The algorithm can detect multiple faults in the examined GCPV array configuration such as:
1. Partial shading effect on the overall system
2. Faulty PV module in a PV string
3. Faulty PV module and partial shading affects the overall system
[image:4.612.118.509.35.187.2]4. Two faulty PV modules in different PV strings
Figure. 2. GCPV array configuration. (A) Series configuration; (B) Parallel Configuration; (C) Series-Parallel Configuration
TABLEI
SERIES AND PARALLEL GCPVARRAY CONFIGURATION CALCULATIONS UNDER STC:1000W/M2 AND 25OC
Series GCPV System
Configuration Theoretical Power (W)
Measured Power (W)
Power Ratio Region
Theoretical Voltage (V)
Measured Voltage (V)
Power Ratio Voltage Normal Operation 1982 1982 1 – 1.02 258.1 258.1 1 – 1.02 Faulty PV Module 1982 1762 1.12 – 1.15 258.1 299.5 1.12 – 1.15 2 Faulty PV Modules 1982 1542 1.29 – 1.31 258.1 200.8 1.29 – 1.31 3 Faulty PV Modules 1982 1322 1.5 – 1.53 258.1 172.1 1.5 – 1.53
4 Faulty PV Modules 1982 1101 1.80 – 1.84 258.1 143.4 1.80 – 1.84
5 Faulty PV Modules 1982 881 2.25 – 2.30 258.1 114.7 2.25 – 2.30
6 Faulty PV Modules 1982 660.7 3.0 – 3.06 258.1 86.1 3.0 – 3.06
7 Faulty PV Modules 1982 440.5 4.5 – 4.59 258.1 57.4 4.5 – 4.59
8 Faulty PV Modules 1982 220.2 9 – 9.19 258.1 28.7 9 – 9.19
PV String Failure 1982 0 1000 258.1 0 1000
Parallel GCPV System Configuration
Theoretical Power (W)
Measured Power (W)
Power Ratio Region
Theoretical Current (A)
Measured Current (A)
Current Ratio Current Normal Operation 1982 1982 1 – 1.02 73.62 73.62 1 – 1.02
Faulty PV Module 1982 1762 1.12 – 1.15 73.62 65.44 1.125 – 1.15
2 Faulty PV Modules 1982 1542 1.29 – 1.31 73.62 57.26 1.29 – 1.31
3 Faulty PV Modules 1982 1322 1.5 – 1.53 73.62 49.08 1.5 – 1.53
4 Faulty PV Modules 1982 1101 1.80 – 1.84 73.62 40.9 1.8 – 1.84
5 Faulty PV Modules 1982 881 2.25 – 2.30 73.62 32.72 2.25 – 2.3
6 Faulty PV Modules 1982 660.7 3.0 – 3.06 73.62 24.54 3 – 3.06
7 Faulty PV Modules 1982 440.5 4.5 – 4.59 73.62 16.36 4.5 – 4.59
8 Faulty PV Modules 1982 220.2 9 – 9.19 73.62 8.18 9.0 – 9.18
The faulty regions based on the analysis of the voltage and the power for each type of the observed faults is presented in Fig. 3.
As described in the sub section III (A) and III (B), it is possible to measure the power and voltage rations based on (1) and (2). All calculations presented in Fig. 1 are based on the analysis of the theoretical and real-time long-term measured data which can be described in Table II.
IV. EVALUATION OF THE PROPOSED ALGORITHM
In this section, the obtained results discussed briefly; using three case studies based on algorithm 1 to 3 are illustrated based on long term full day real-time data measurements.
A. Case 1: Series Configuration
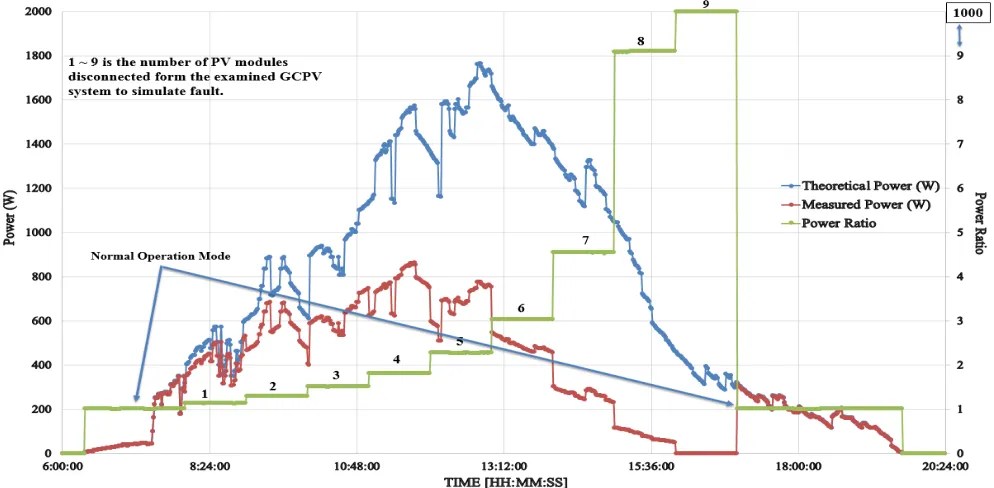
In order to test the ability of the proposed algorithm 1 which is used to detect possible faults occurred in the series GCPV array configuration, real-time data measurements were conducted as shown in Fig. 4.
Firstly, a normal operation mode of the GCPV system has been examined. The power ratio and a measured output power close to the theoretical power. By disconnecting one PV
module between the time 8:00 am and 9:00 am, the power ratio of this experiment is between 1.127 – 1.144.
Two PV modules have were disconnected form the GCPV plant. Between the time 9:00 am and 10:00 am the power ratio increased to 1.295 – 1.3. The rest of the results are described on the left hand side on Fig. 4.
Process continue up to all 9 PV modules been disconnected. This experiment shows that the power ratio between the measured and the theoretical power is equal to 1000 which is the same value described previously in Table I.
The value 1000 has been selected because the experimental results prove that the maximum partial shading effects on the GCPV system is equal to 99.64%, which means that the power ratio is equal to:
1982 / 7 (max partial shading power value) = 283.857 < 1000.
B. Case 2: Parallel Configuration
In this case, the fault detection algorithm 2 will be applied on parallel GCPV array configuration. Various faults will be examined during faulty conditions occurred in the GCPV plant.
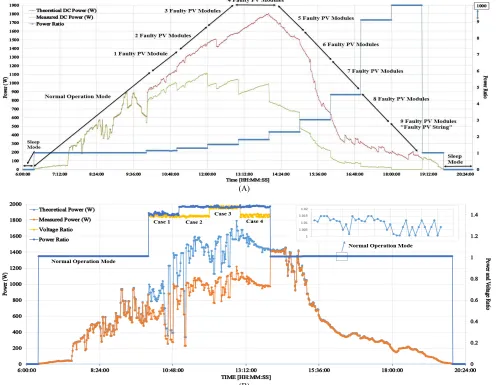
As shown in Fig. 5(A), a real-time measured data for a period of a full day has been carried out to estimate the accuracy and validity of the proposed algorithm 2. Between the times 6:23 am – 10:00 am, the GCPV system was operating in a normal mode condition. Starting at 10:00 am, a faulty PV module being disconnected from the GCPV system, the power ratio of this experiment is between 1.16 – 1.11.
Two PV modules has been disconnected at 11:00am, this experiment leads to a more drop in the power ratio of the GCPV system. Similarly, additional PV module has been disconnected between at 12:00pm – 1:00pm.
[image:5.612.150.477.38.266.2]Fig. 5(A) describes a variety of experiments which were conducted on a parallel GCPV array configuration. Faulty PV module, two fault PV modules, three faulty PV module, etc. The last experiment shows a significant impact on generated
Figure. 3. Fault detection algorithm (algorithm 3) used for the series-parallel GCPV array configuration
TABLEII
SERIES-PARALLEL GCPVARRAY CONFIGURATION CALCULATIONS UNDER STC:1000W/M2 AND 25OC
Type of the Fault Output Measured Power (W)
Output Measured Voltage (V) Faulty PV module in a PV string 1424 - 1395.5 62.70 - 61.45
Faulty PV module and partial shading effects the GCPV
system
1356 - 1328.8 62.5 - 61.25
Two faulty PV modules in different PV string
output power of the GCPV system which is equal to 0. The power ratio of this experiment is equal to 1000, similarly the reason of selecting 1000 is discussed previously in case 1.
The time and the type of each fault which is detected using the fault detection algorithm 2 were accurate. The power ratio for each test scenario indicate that the algorithm can achieve a high accuracy rate for detecting the fault in the GCPV system not only in stable irradiance levels but also for rapid irradiance level changes as shown between the time 14:00 pm – 16:00 pm on Fig. 6(A).
C. Case 3: Series-Parallel Configuration
This case is created to confirm the capability of the fault detection algorithm 3 to detect possible faults occurred in series-parallel GCPV array configuration systems.
Fig. 5(B) shows the output results which are conducted on a series-parallel GCPV array configuration using VI LabVIEW software. Four different case studies have been examined as shown in Table III and Fig. 5(B).
As shown in Fig. 5(B), it is possible to detect various faults in the examined GCPV configuration based on the analysis of the power and voltage ratio. For each scenario the power and voltage ratio limits are illustrated in Table III. It is evident that which are within the regions described in Fig. 3.
The fault detection algorithm 3 shows a significant results and accuracy in detecting various faults in the examined series-parallel GCPV array configuration system during a period of a 24 hrs.
V. DISCUSSION
In this paper, three fault detection algorithms have been presented. Number of PV modules plays a major role in implementing the fault detection algorithms. In this work, 9 PV modules have been examined. However, in order to apply these fault detection algorithms in other GCPV plants, the ratios of the voltage, current and power must be calculated using the proposed equations (1-3). Furthermore, the estimation of the faulty regions in large scale PV systems can be obtained by the following points:
1. Identifying the main parameters which have the most impact on the GCPV configuration (example: voltage, current and power).
2. Analyzing the maximum theoretical power, voltage and current ratios
3. Taking into account the MPPT efficiency units used in the GCPV configuration.
[image:6.612.60.557.32.276.2]
Figure. 4. Detecting faults in the series GCPV array configuration
TABLEIII
CASE STUDIES EXAMINED IN THE SERIES-PARALLEL GCPVARRAY CONFIGURATION
Case
Study Output Measured Power (W)
PR VR
Scenario 1 Faulty PV module in a PV string 1.452 – 1.387
1.397 – 1.377 Scenario 2 Two faulty PV modules in
different PV strings
1.491 – 1.471
1.481 – 1.462 Scenario 3 Faulty PV module in a PV string
and Partial shading effect the GCPV plant
1.488 – 1.469
1.398 – 1.381
Scenario 4 Partial shading effects the GCPV plant
1.489 – 1.463
[image:6.612.312.561.315.458.2]VI. CONCLUSION
In this paper, a fault detection algorithms for detecting possible faults occurred in multiple grid-connected photovoltaic (GCPV) array configuration has been proposed. Three different GCPV array configuration have been examined: series, parallel and series-parallel array configuration. Virtual Instrumentation (VI) LabVIEW software is used to facilitate the theoretical analysis of the examined GCPV system. All data measurements have been validated using 1.98 kWp GCPV system installed at the University of Huddersfield, UK.
In order to identify the failure in multiple GCPV array configuration, we have defined three indicators named as power ratio (PR), voltage ratio (VR) and current ratio (CR).
Novel contribution of this research is the multiple GCPV array configuration fault detection algorithm which can detect multiple faults in each of the proposed array configurations.
REFERENCES
[1] Mekki, H., Mellit, A., & Salhi, H. (2016). Artificial neural network-based modelling and fault detection of partial shaded photovoltaic modules.Simulation Modelling Practice and Theory, 67, 1-13.
[2] Silvestre, S., da Silva, M. A., Chouder, A., Guasch, D., & Karatepe, E. (2014). New procedure for fault detection in grid connected PV systems based on the evaluation of current and voltage indicators. Energy Conversion and Management, 86, 241-249. [3] Dhimish, M., & Holmes, V. (2016). Fault detection algorithm for
grid-connected photovoltaic plants. Solar Energy, 137, 236-245.
[4] Dhimish, M., Holmes, V., & Dales, M. (2016, November). Grid-connected PV virtual instrument system (GCPV-VIS) for detecting photovoltaic failure. In Environment Friendly Energies and Applications (EFEA), 20164th International Symposium on (pp. 1-6). IEEE.
[5] Chine, W., Mellit, A., Lughi, V., Malek, A., Sulligoi, G., & Pavan, A. M. (2016). A novel fault diagnosis technique for photovoltaic systems based on artificial neural networks. Renewable Energy, 90, 501-512. [6] Jamshidpour, E., Poure, P., & Saadate, S. (2015). Photovoltaic systems
reliability improvement by real-time FPGA-based switch failure diagnosis and fault-tolerant DC–DC converter. IEEE Transactions on Industrial Electronics,62(11), 7247-7255.
[7] Kim, K. A., Seo, G. S., Cho, B. H., & Krein, P. T. (2016). Photovoltaic Hot-Spot Detection for Solar Panel Substrings Using AC Parameter Characterization. IEEE Transactions on Power Electronics, 31(2), 1121-1130.
[8] M. Dhimish, V. Holmes and B. Mehrdadi, "Grid-connected PV monitoring system (GCPV-MS)," 2016 4th International Symposium on
Environmental Friendly Energies and Applications (EFEA), Belgrade, Serbia, 2016,pp. 1-6.doi: 10.1109/EFEA.2016.7748772
[9] Alajmi, B. N., Ahmed, K. H., Finney, S. J., & Williams, B. W. (2013). A maximum power point tracking technique for partially shaded photovoltaic systems in microgrids. IEEE Transactions on Industrial Electronics, 60(4), 1596-1606.
(A)
[image:7.612.70.566.36.421.2](B)