50
Secretariat of the
Convention on
Biological Diversity
A Technical Report for the
Global Biodiversity Outlook 3
CBD Technical Series No. 50
BIODIVERSITY SCENARIOS:
PROJECTIONS OF 21
st
CENTURY
CHANGE IN BIODIVERSITY
AND ASSOCIATED
BIODIVERSITY SCENARIOS
Projections of 21
stcentury change
in biodiversity and associated
ecosystem services
A Technical Report for the
Global Biodiversity Outlook 3
The designations employed and the presentation of material in this publication do not imply the expression of any opinion whatsoever on the part of the copyright holders concerning the legal status of any country, territory, city or area or of its authorities, or concerning
the delimitation of its frontiers or boundaries.
This publication may be reproduced for educational or non-profit purposes without special permission from the copyright holders, provided acknowledgement of the source is made. The Secretariat
of the Convention would appreciate receiving a copy of any publications that use this document as a source.
Published by the Secretariat of the Convention on Biological Diversity.
ISBN 92-9225-219-4 Copyright © 2010, Secretariat of the
Convention on Biological Diversity
Citation
Leadley, P., Pereira, H.M., Alkemade,
R., Fernandez-Manjarrés, J.F., Proença, V., Scharlemann, J.P.W., Walpole, M.J. (2010) Biodiversity Scenarios: Projections of 21st century change in biodiversity and associated ecosystem
services. Secretariat of the Convention on Biological Diversity, Montreal. Technical Series no. 50, 132 pages.
For further information please contact: Secretariat of the Convention on Biological Diversity
World Trade Centre 413 St. Jacques, Suite 800 Montreal, Quebec, Canada H2Y 1N9
Phone: 1 (514) 288 2220 Fax: 1 (514) 288 6588 E-mail: [email protected]
Website: www.cbd.int
Photo Credits
Cover (from top to bottom): iStockphoto.com; Eric Gilman; Frank Kovalchek, Flickr.com
Page 1: UN Photo/Ray Witlin Page 4: courtesy of UNEP
Page 11: Joel Craycraft Page 36: Kalovstian/UNEP Page 38: Gaethlich, UNEP-Alpha Presse
Page 45: Anne Larigauderie
DIVERSITAS (an international program of biodiversity science) and UNEP-WCMC coordinated this synthesis for the Secretariat of the Convention on Biological Diversity as a contribution to the third Global Biodiversity Outlook (GBO-3). Paul Leadley is the co-chair and Rob Alkemade and Miguel Araujo are members of the scientific steering committee of DIVERSITAS’ bioDISCOVERY core project. Georgina Mace and Bob Scholes are vice-chairs and David Cooper a member of the scientific committee of DIVERSITAS.
The lead authors would like to thank Lucy Simpson for organising the workshop, Anna Chenery and Francine Kershaw for their assistance with getting permission to reproduce the figures, Simon Blyth and Gillian Warltier for assistance with proof reading, and Kieran Mooney for photo searches.
This study was funded by the Department of the Environment, Food and Rural Affairs of the United Kingdom with additional financial assistance from the European Commission and UNEP. The views expressed herein can in no way be taken to reflect the official opinion of the these bodies, or of the Convention on Biological Diversity.
John Agard, The University of The
West Indies, Trinidad and Tobago
Miguel Araújo, Museo Nacional
de Ciencias Naturales, Spain
Andrew Balmford, University
of Cambridge, UK
Patricia Balvanera, Universidad
Nacional Autónoma de México, Mexico
Oonsie Biggs, Stockholm
University, Sweden
Laurent Bopp, Institute Pierre
Simon Laplace, France
Stas Burgiel, Global Invasive
Species Programme, USA
William Cheung, University of
British Columbia, Canada
Philippe Ciais, Laboratory
for Climate Sciences and the Environment, France
David Cooper, CBD
Secretariat, Canada
Joanna C. Ellison, University
of Tasmania, Australia
Juan F. Fernandez-Manjarrés,
Université Paris-Sud 11, France
Joana Figueiredo, Universidade
de Lisboa, Portugal
Eric Gilman, Global Biodiversity
Information Facility Secretariat, Denmark
Sylvie Guénette, University of
British Columbia, Canada
Robert Hoft, CBD
Secretariat, Canada
Bernard Hugueny, IRD,
Muséum National d’Histoire Naturelle, France
George Hurtt, University of
New Hampshire, USA
Henry P. Huntington, USA
Michael Jennings, University
of Idaho, USA
Fabien Leprieur, IRD,
Muséum National d’Histoire Naturelle, France
Corinne Le Quéré, University
of East Anglia, UK
Georgina Mace, Imperial
College, UK
Cheikh Mbow, Université
Cheikh Anta Diop, Senegal
Kieran Mooney, CBD Secretariat
Aude Neuville, European
Commission, Belgium
Carlos Nobre, Instituto Nacional
de Pesquisas Espaciais, Brazil
Thierry Oberdorff, IRD,
Muséum National d’Histoire Naturelle, France
Carmen Revenga, The Nature
Conservancy, USA
James C. Robertson, The
Nature Conservancy, USA
Patricia Rodrigues, Universidade
de Lisboa, Portugal
Juan Carlos Rocha Gordo,
Stockholm University, Sweden
Hisashi Sato, Nagoya
University, Japan
Bob Scholes, Council for
Scientific and Industrial Research, South Africa
Mark Stafford Smith,
CSIRO, Australia
Ussif Rashid Sumaila, University
of British Columbia, Canada
Pablo A. Tedesco, IRD,
Muséum National d’Histoire Naturelle, France
THIS DOCUMENT
WAS PREPARED BY:
Lead Authors
Contributing Authors
Paul Leadley, Université
Paris-Sud 11, France
Henrique Miguel Pereira,
Universidade de Lisboa, Portugal
Rob Alkemade, Netherlands
Environmental Assessment Agency, Netherlands
Juan F. Fernandez-Manjarrés,
Université Paris-Sud 11, France
Vânia Proença, Universidade
de Lisboa, Portugal
Jörn P.W. Scharlemann,
United Nations Environment Programme World Conservation Monitoring Centre, UK
Matt J. Walpole, United Nations
CONTENTS
Executive summary ...7
Technical summary of the biodiversity scenarios synthesis ...11
Terrestrial systems ...11
Freshwater systems ...27
Marine systems ...31
The way forward for biodiversity models and scenarios ...36
Endnotes ...38
List of Acronyms...44
References ...45
Appendix 1 Arctic tundra ...53
Appendix 2 Mediterranean forest ...60
Appendix 3 Amazonian forest ...68
Appendix 4 West Africa: the Sahara, Sahel and Guinean region ...76
Appendix 5 Miombo woodlands ...87
Appendix 6 Invasive Species on Islands ...92
Appendix 7 Coastal terrestrial systems and sea-level rise ...100
Appendix 8 Arctic ocean ...111
Appendix 9 Marine fisheries ...117
Appendix 10 Tropical coral reefs ...125
box 1 What is a tipping point and why are tipping points important? ...12
box 2 Arctic tundra ...19
box 3 Mediterranean forest ...19
box 4 Amazonian forest ...20
box 5 West Africa: the Sahara, Sahel and Guinean region ...21
box 6 Miombo woodlands ...22
box 7 Invasive species on islands ...23
box 8 Coastal terrestrial systems and sea-level rise ...25
box 9 Snow and glacier melt ...27
box 10 Lake eutrophication ...29
box 11 Marine fisheries ...32
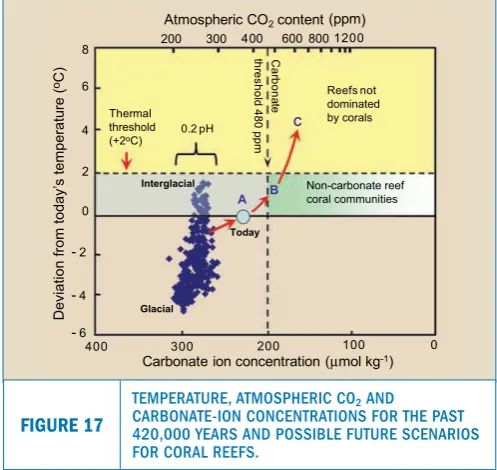
box 12 Tropical coral reefs ...33
box 13 Marine phytoplankton ...35
Figure 1 Map of the distribution of tipping points of global importance. ...11
Figure 2 Historical extinction rates and scenario projections for the 21st century. ...12
Figure 3 Projected changes in land-cover and impact on birds for 2100. ...14
Figure 4 Projected changes in area and vascular plant diversity for each biome in 2050. ...14
Figure 5 Observed changes and scenario projections to 2050 in abundance of terrestrial species. ...15
Figure 6 Estimated historical changes in abundance of terrestrial species and comparison of projected changes in 2050 for different sustainability policies. ...16
Figure 7 Projected changes in the extent of forests to 2050 in different global scenarios. ...16
Figure 8 Projected changes in major vegetation types by 2100 due to climate change. ...17
Figure 9 Projected changes in vegetation cover of trees and herbaceous species from 1860 to 2099. ...18
Figure 10 Relationship between projected changes in species abundances and ecosystem services from 2000 to 2050. ...24
Figure 11 Modeled impact of three global biodiversity conservation schemes on ecosystem services. ...24
Figure 12 Projected changes in annual water availability for 2100. ...28
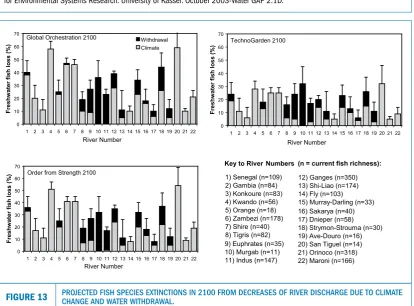
Figure 13 Projected fish species extinctions in 2100 from decreases of river discharge due to climate change and water withdrawal. ...28
Figure 14 Projected population living in river basins facing severe water stress from 2000 to 2050. ...30
Figure 15 Estimated changes in total river nitrogen load during 1970 –1995 and 1995–2030. ...30
Figure 16 Projections of marine biodiversity in the Pacific Ocean to 2050. ...31
Figure 17 Temperature, atmospheric CO2 and carbonate-ion concentrations for the past 420,000 years and possible future scenarios for coral reefs. ...32
Figure 18 Projections of coral reef bleaching frequency for the Caribbean and the Indo-Pacific in 2050-2059. ...33
This synthesis focuses on estimates of biodiversity change as projected for the 21st century by models or extrapolations based on experiments and observed trends. The term “biodiversity” is used in a broad sense as it is defined in the Convention on Biological Diversity to mean the abundance and distribu-tions of and interacdistribu-tions between genotypes, species, communities, ecosystems and biomes. This syn-thesis pays particular attention to the interactions between biodiversity and ecosystem services and to critical “tipping points” that could lead to large, rapid and potentially irreversible changes. Compari-sons between models are used to estimate the range of projections and to identify sources of uncertain-ty. Experiments and observed trends are used to check the plausibility of these projections. In addition we have identified possible actions at the local, national and international levels that can be taken to conserve biodiversity. We have called on a wide range of scientists to participate in this synthesis, with the objective to provide decision makers with messages that reflect the consensus of the scientific com-munity and that will aid in the development of policy and management strategies that are ambitious, forward looking and proactive.
EXECUTIVE SUMMARY
KEY CONCLUSIONS
Projections of global change impacts on biodiversity show continuing and, in many cases, accelerating species extinctions, loss of natural habitat, and changes in the distribution and abundance of species and biomes over
the 21st century.
n Combined changes in land use, exploitation
of forests and marine resources, rising atmo-spheric CO2 concentrations, climate change and eutrophication are projected by models to result in significant changes in the distribu-tion and abundance of species, species groups and biomes. Many of these biodiversity trans-formations will involve large and sometimes highly visible modifications of ecosystems such as widespread conversion of tropical forest to pastures and croplands, climate-induced inva-sion of tundra by boreal forest, reductions in the abundance of top predators in marine systems, etc. Some species are projected to increase in abundance or expand their ranges, but the abundance or range size of many species will decline, often leading to substantially increased risk of extinctions.
n Land use change, modification of river flow,
freshwater pollution, and exploitation of marine resources are currently the most important drivers of biodiversity change and are projected to remain so over the coming century. Climate change and ocean
acidification will become increasingly
impor-tant drivers during the 21st century.
n New socio-economic scenarios point to
plausi-ble development pathways of low greenhouse gas emissions and low land conversion that could lead to much lower biodiversity impacts than projected in previous studies. These opti-mistic scenarios require fundamental changes in development paradigms, but are coherent with known constraints on economics, resource use and human development goals.
n The synthesis of a broad range of global land
use scenarios and models of climate change impacts on terrestrial and ocean systems shows there is much greater variability in projec-tions of biodiversity loss compared to previous assessments. In addition, if greenhouse gas emissions continue along current trajectories, several Earth System models project that this will result in far greater climate-induced trans-formations of terrestrial biomes and marine biota than projected in earlier global biodiver-sity assessments.
n Experiments, observations of current trends and/or the paleontological record are consis-tent with some model projections, such as the poleward migration of boreal forest due to climate change, but other projections such as massive extinctions due to mid-century climate change have weaker support from past and present trends at least for certain taxa (e.g., some plants and insects).
n The projected changes are heterogeneous
spatially and among taxonomic groups, so even moderate biodiversity losses at the global level may translate to dramatic biodiversity losses or changes at the regional level or for a given
functional species group or set of vulnerable species. The largest impacts are projected to be habitat and species losses in tropical forests, biome shifts in boreal and Arctic tundra, and dramatic changes in species abundance in many freshwater and marine systems.
n Lags in the underlying socio-economic,
climate and global biogeochemical drivers make acceleration in biodiversity transforma-tions inevitable over the next several decades and require that mitigation and adaptation measures must be taken well before unaccept-ably large impacts on biodiversity are observed.
Thresholds, amplifying feedbacks and time-lag effects leading to “tipping points” are widespread and make the impacts of global change on biodiversity hard to predict, difficult to control once they begin, and slow and expensive to reverse once they have occurred.
n The existence of tipping-points can be
antici-pated with high confidence; however, specific thresholds cannot yet be predicted with adequate precision and advanced warning to allow them to be approached without high risk. This argues for a precautionary approach to human activities that are known drivers of biodiversity loss.
n Human demands for food, fiber and energy
play a key role in driving many of the tipping points especially through conversion of natu-ral and semi-natunatu-ral ecosystems to farming and the overexploitation of marine resources. While global biodiversity assessments have emphasized the significance of these drivers, the potential importance of thresholds, amplifying feedbacks and time-lag effects leading to tipping-points has been underestimated. For example, previ-ous global biodiversity assessments have not fully accounted for the extremely rapid disappearance of the Arctic polar ice cap, nor the possible wide-spread dieback of the Amazon forest.
n Tipping points analyses indicate that rising
atmospheric CO₂ concentrations and climate change could lead to major biodiversity trans-formations at levels near or below the 2°C global warming defined by the IPCC as “danger-ous”. Widespread coral reef degradation, large shifts in marine plankton community structure especially in the Arctic ocean, extensive inva-sion of tundra by boreal forest, destruction of many coastal ecosystems, etc. are projected to occur below this low level of warming. Due to lags in the socio-economic, biological and physical systems of the Earth these transfor-mations will be essentially irreversible over the next several centuries.
n Many of the tipping points occur due to
n Most of the biodiversity tipping points that we have identified will be accompanied by large negative regional or global scale impacts on ecosystem services and human well-being. For example, the widespread and irrevers-ible degradation and loss of natural coastal habitats due to pollution, habitat destruction, changes in sedimentation and sea-level rise will be accompanied by increased risk of coastal damage by waves and storm surges and the loss of productivity of coastal fisheries.
n Biodiversity loss and the erosion of the capacity
of ecosystems to deliver services often respond in similar ways to shared drivers; however, the relationship between them is not simple, and may be different for the various dimensions of biodiversity. For example, the links between local species extinctions and reduced capacity to deliver ecosystem services remain, in many cases, elusive.
n Experiments, observations and models
indi-cate that changes in ecosystem services are more tightly coupled to changes in the abun-dance and distribution of dominant or keystone species than to species extinctions. This calls for
increased awareness of the importance of shifts in species distribution and changes in local abundance as the principal drivers of change in ecosystem services. Global analyses of biodiver-sity change may conceal large, disproportionate local changes for some functional species groups (e.g., top predators) that have a strong influence on ecosystem services.
n Improvements in ecosystem services,
espe-cially provisioning services such as food, fiber and energy production, can come at the cost of habitat loss, reductions in species abundance and species extinctions. Efforts to maximize a small range of these provisioning services in the short term typically result in negative impacts on biodiversity and important sustaining, regu-lating and cultural ecosystem services. This calls for prudence in using ecosystem services as a blanket argument for conserving species. It also argues in favor of management that sustains a broad and balanced range of ecosystem services, including existence values, as opposed to focusing on provisioning services.
For many important cases the degradation of ecosystem services goes hand-in-hand with species extinctions, declining species abundance, or widespread shifts in species and biome distributions. However, conservation of biodiversity and of some ecosystem services, especially provisioning services, are often at odds.
Strong action at international, national and local levels to mitigate drivers of biodiversity change and to develop adaptive management strategies could significantly reduce or reverse undesirable and dangerous biodiversity transformations if urgently, comprehensively and appropriately applied.
n Increasing agricultural efficiency is one of
the most important keys to minimizing the destruction of natural terrestrial and fresh-water habitats and limiting pressure on marine resources. There is considerable debate concerning the margin for increasing agricultural efficiency, but some recent socio-economic scenarios require no net increase in land under cultivation at the global scale
over the 21st century. Attaining this goal would
require limited population growth, substan-tial increases in agricultural productivity and efficient use of primary production (e.g., reduction of post-harvest losses, limited meat consumption). Negative impacts of agricultural intensification on biodiversity can be mini-mized by appropriate agricultural practices.
n International regulation of fishing in
non-terri-torial waters and improved governance at local to global scales are key to avoiding wide-spread modifications of marine food chains and collapse of important fisheries. Some forms of low-impact aquaculture could play an impor-tant role in preserving marine resources, but without appropriate regulation aquaculture has and will continue to lead to significant environ-mental problems.
n Climate mitigation is urgent as illustrated in
many of the tipping points analyses. In
partic-ular, the target of limiting 21st century climate
of climate mitigation should be assessed for their likely impacts on biodiversity. Poten-tial synergies between climate mitigation and biodiversity conservation are numerous, for example the negotiations for the UNFCCC include a mechanism to encourage the reduc-tion of emissions of greenhouse gases due to deforestation and degradation (REDD) which could preserve tropical forest biodiversity and significantly reduce global greenhouse gas emissions if appropriately implemented.
n Limited deployment and appropriate
manage-ment of biofuels can substantially reduce competition between intensively managed ecosystems and natural habitats. Current trends and models suggest that large-scale deploy-ment of biofuels results in net negative impacts on biodiversity. Previous biodiversity assess-ments have underestimated the opportunities for reducing climate change impacts on biodi-versity, in part, because they relied heavily on biofuels for climate mitigation.
n Protected areas on land and sea are one
of the most effective means of biodiversity
conservation if their status is properly respected. Existing protected areas and new networks need to account for the highly dynamic nature of future biodiversity trans-formations, which will require much stronger integration of biodiversity conservation in and outside protected areas, especially for freshwa-ter ecosystems.
n Ecosystem-based approaches can contribute
to climate change mitigation and adaptation and to sustainable development more broadly. Spatial planning for ecosystem services at inter-national, national and local levels will be an important component of ecosystem-based approaches. However, because not all elements of biodiversity are critical for ecosystem services, it is important to also target critical areas for protecting biodiversity for its own sake in spatial planning.
n Widespread ecological restoration, e.g.
large-scale reforestation, has not been included in biodiversity projections, but could play an important role in maintaining biodiversity, and the provision of associated ecosystem services.
In the following sections we provide the details of the scientific underpinning of the conclusions outlined above (Section 2) and highlight the areas of research where significant progress must be made in order to improve the confidence in biodiversity scenarios (Section 3).
This section synthesizes existing scenarios for
bio-diversity change over the 21st century. It focuses
on the response of biodiversity to five main global change drivers: habitat degradation and destruc-tion, climate change, nutrient loading,
overexploita-tion of biological resources and biotic exchange1. We
use “biodiversity” in a broad sense as it is defined in the Convention on Biological Diversity to mean the abundance and distributions of and interactions between genotypes, species, communities, ecosys-tems and biomes, and are very careful in our analy-ses to identify which of these components are being addressed. In addition to examining the potential impacts of global change on biodiversity, we have also identified key actions that can be taken to slow, halt or even reverse biodiversity loss.
Our work differs from previous scenario assessments such as the Millennium Ecosystem Assessment (MA 2005), the Global Environmental Outlook 4 (UNEP 2007) and the Global Biodiversity Outlook 2 (CBD 2006), because it focuses on synthesizing informa-tion from a broad range of models and scenarios. Previous assessments have relied on a single model framework for generating scenarios of biodiversity
change over the 21st century, which has the
advan-tage of providing fully integrated and internally coherent projections of the indirect and direct drivers of biodi-versity and their effects on biodiver-sity. The disadvantage of using a single model framework is that it may under-estimate uncertainty, since mod-els differ greatly in their underlying assumptions and their projections of biodiversity change. In addition, we have attempted to confront projec-tions with observaprojec-tions and experi-mental data in order to evaluate the degree of certainty in model projec-tions. Our synthesis relies primarily on global and large regional scale pro-jections, and to the extent possible is
based on research published in peer-reviewed sci-entific journals. A wide range of scientists participat-ed in the preparation of this synthesis by contribut-ing text, especially for the tippcontribut-ing points analyses, by participating in a scoping workshop and by pro-viding ample comments on drafts of this synthesis.
This synthesis of biodiversity scenarios is organized by major realms: terrestrial, freshwater and marine systems. Within each realm we present model pro-jections for biodiversity change at the global scale and for specific ecosystem types or regions, with a focus on biodiversity tipping points (Box 1). Our analyses of tipping points cover several regions of the world (Figure 1) which are a subset of a much wider list of potential tipping points.
TERRESTRIAL SYSTEMS
Global biodiversity models project that terrestrial species extinctions, loss of natural habitat, and changes in the distribution and abundance of species, species groups and biomes will continue throughout this century, with land use change being the main threat in the short term, and climate change becoming progressively much more important over the next several decades.
TECHNICAL SUMMARY OF THE
BIODIVERSITY SCENARIOS SYNTHESIS
2.
Tundra
Arctic
Tundra
Coral reefs
Fisheries
Mediterranean forest
Miombo woodlands
Marine plankton
Coastal systems Sahel-Sahara
Amazonian forest
FIGURE 1 MAP OF THE DISTRIBUTION OF TIPPING POINTS OF GLOBAL IMPORTANCE.
BOX 1 WHAT IS A TIPPING POINT AND WHY ARE TIPPING POINTS IMPORTANT?
In general, land use change has been the main driver of terrestrial biodiversity loss during the past centu-ry. Land use change, climate change and to a lesser extent nutrient loading, have been predominantly selected over other drivers to explore projections of terrestrial biodiversity change at the global scale. The effects of species invasions and overexploita-tion, although suspected to be important are still underexplored due to a lack of adequate global
data-sets and models2.
Models of terrestrial biodiversity response to global change vary considerably in the methods of model-ing biodiversity responses to drivers and in measures of biodiversity change, which greatly complicates the task of synthesis. Methods for modeling biodiversity responses are particularly diverse and include
niche-based models3, dose-response relationships4,
spe-cies-area relationships5, empirical estimates of
vul-nerability based on IUCN criteria6, global vegetation
models7 and various combinations of these and
oth-er models. We have focused on four key measures
of biodiversity change – (i) species extinctions8, (ii)
changes in species abundance9, (iii) habitat loss10
and (iv) changes in the distribution of species,
func-tional species groups11 or biomes12.
SPECIES EXTINCTIONS — Projections of 21st century
terrestrial species extinctions, also referred to as
A relatively broad definition of tipping point has been used in the context of the GBO3 biodiversity scenarios synthesis. It includes situations where changes in ecosystem functioning are significant enough to have important impacts on biodiversity or ecosystem services at regional to global scales, and that meet any one of the following four criteria:
Tipping points are a major concern for scientists, managers and policy makers because of their potentially large impacts on biodiversity, ecosystem services and human well-being and the difficulty in adapting coupled human-environmental systems to rapid and potentially irreversible regime shifts. While it is almost certain that tipping points will occur in the future, the dynamics in most cases cannot yet be predicted with enough precision and advance warning to allow for secure and adequate approaches to avoid or mitigate impacts. This reality argues for a precautionary approach to human activities which are known to drive biodiversity loss.
For the GBO3 a diverse, but not exhaustive, range of biodiversity and ecosystem services tipping points has been selected. The tipping points selected cover examples from terrestrial, freshwater and marine systems and differ in terms of the main drivers of the underlying mechanisms and of the extent of their spatial distribution. We have not considered all potentially policy-relevant tipping points, and the selection presented should not be regarded as a prioritization of tipping points with respect to their relevance for biodiversity and ecosystem services. This selection aims to provide an overview of tipping points of global importance and to raise the awareness about these phenomena and their consequences. All tipping point descriptions are accompanied by a diagram summarizing the main drivers and mechanisms involved. Pictures illustrating the current condition and the potential future state are also shown.
Birds
Plants
0.1 1 10 100 1000 10000 100000
Background
extinction rate Red list Jetz van Vuuren Malcom Thomas
E/MSY
Recent past
Distant past Future
Mammals, birds & amphibians
Mammals Species extinction
Plants & animals
[image:14.595.304.553.381.620.2]Plants & animals
FIGURE 2 HISTORICAL EXTINCTION RATES AND SCENARIO PROJECTIONS FOR THE 21ST CENTURY.
Extinctions per million species years (E/MSY) for distant past, recent past and future. “Distant past” refers to the background extinction rate of mammals obtained from the fossil record (MA 2005). “Recent past” refers to documented extinctions registered in the 20th century, by the Red List — mammals (upper bound), amphibians (lower bound) and birds (in between) (Baillie et al. 2004). “Future” refers to projections of species “committed to extinction” according to different global scenarios: birds (Jetz et al. 2007, for the period of 2000–2050), vascular plants (van Vuuren et al. 2006 for the period 1995–2050) and various taxa (Thomas et al. 2004 for the period 2000–2050 and Malcolm et al. 2006 for the period 2000–2100). This figure shows that projected extinction rates have large uncertainties (both intra and inter-study), but are nonetheless higher than recent extinction rates.
1. The overall effect of a global change driver is amplified by positive feedback loops;
2. There is a threshold beyond which an abrupt shift between alternate ecological stable states occurs;
3. The changes induced by the driver are long lasting and hard to reverse;
4. There is a significant time lag between the dynamics of the drivers and the expression of impacts, causing great difficulties in ecological management.
IMPACT OF DRIVERS Drivers:
Habitat change
Climate change
Overexploitation
Invasive species
Pollution
Positive/amplifying feedback
Threshold
Irreversibility
Time lag
TIPPING POINT MECHANISMS
high Low
“species loss”, have been the focus of several recent studies, which is understandable because extinc-tions constitute an irrevocable loss of unique life forms. We have summarized these projections in
Figure 2 and Table 113.
The majority of these studies project that a very large fraction of species will be “committed to
extinc-tion” in the 21st century due to land use and climate
change (Figure 2, Table 1). These projected rates are, with one exception, two orders of magnitude high-er than obshigh-erved extinction rates in the second half
of the 20th century, which are already
approximate-ly two orders of magnitude higher than in the Ceno-zoic fossil record.
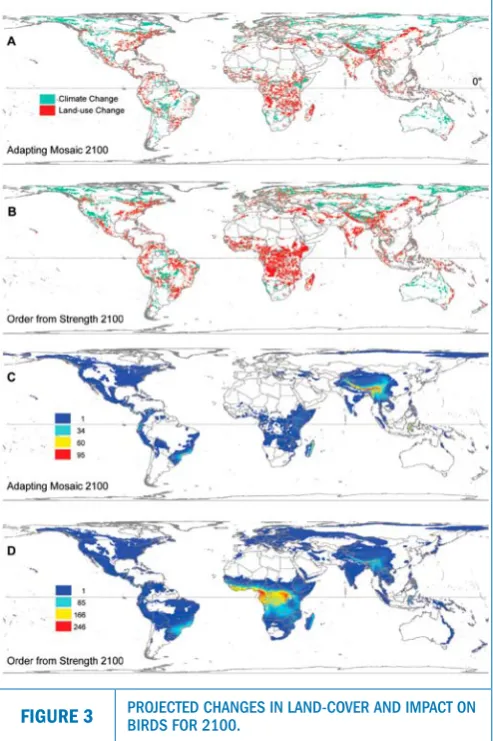
Projected species loss varies substantially across biomes in all studies. For example, the Jetz et al. study indicates that birds in tropical regions are the most sensitive, due to large-scale deforestation in these biomes that are characterized by exception-al species richness and narrow geographicexception-al rang-es of specirang-es (Figure 3). In contrast, van Vuuren et al. rank warm mixed forests, temperate deciduous forests and savannahs as being the most sensitive to global change (Figure 4). Part of this divergence is due to the focus on percent species loss in van Vuuren et al. versus numbers of species extinctions in Jetz et al., highlighting the importance of global
patterns in species richness as a critical determi-nant of future species extinctions.
Land use change typically remains the dominant driver of species loss at the global scale throughout
the 21st century in projections that account for both
land use and climate change. In all studies based on the Millennium Assessment (MA) socio-economic scenarios, the regions most heavily impacted by land use change are grasslands, savannas and tropical forest in Central and Southern Africa (also see tip-ping points in Box 5 and Box 6), the Atlantic coast-al regions of South America which include megad-iverse Atlantic forests, and parts of Southeast Asia (Figure 3). Habitat loss accounts for more than three quarters of global species loss at 2050 in van Vuuren et al., although climate change impacts predominate in high latitude biomes (Figure 3). Surprisingly, the highest projections of species loss come from mod-els that only account for climate change (Thomas et al. and Malcolm et al. in Figure 2). Large differenc-es in methods and specidifferenc-es groups studied make it
difficult to determine why this occurs14.
[image:15.595.47.512.61.397.2]Socio-economic scenarios with high population growth rates and low value placed on public goods have the highest projected species loss (i.e., the “Order from Strength” scenario in studies based on the MA (2005), Table 1), but in general there are TABLE 1 Characteristics of models of extinction risks for terrestrial species presented in Figure 2.
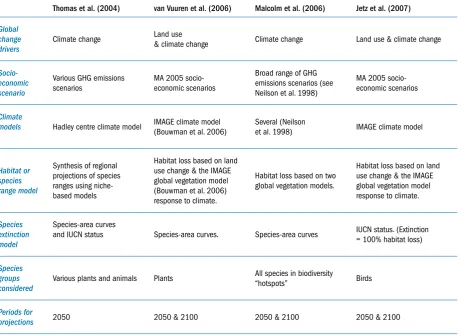
Thomas et al. (2004) van Vuuren et al. (2006) Malcolm et al. (2006) Jetz et al. (2007)
Global change
drivers Climate change
Land use
& climate change Climate change Land use & climate change
Socio-economic scenario
Various GHG emissions
scenarios MA 2005 socio-economic scenarios
Broad range of GHG emissions scenarios (see Neilson et al. 1998)
MA 2005 socio-economic scenarios
Climate
models Hadley centre climate model IMAGE climate model (Bouwman et al. 2006) Several (Neilson et al. 1998) IMAGE climate model
Habitat or species range model
Synthesis of regional projections of species ranges using niche-based models
Habitat loss based on land use change & the IMAGE global vegetation model (Bouwman et al. 2006) response to climate.
Habitat loss based on two global vegetation models.
Habitat loss based on land use change & the IMAGE global vegetation model response to climate.
Species extinction model
Species-area curves
and IUCN status Species-area curves. Species-area curves IUCN status. (Extinction = 100% habitat loss)
Species groups
considered Various plants and animals Plants
All species in biodiversity
“hotspots” Birds
Periods for
only modest differences between socio-econom-ic scenarios in many studies of species loss (e.g., Figure 4) despite important differences in human population growth, greenhouse gas emissions, envi-ronmental technologies, etc. The absence of large differences in impacts on species across scenarios appears to be the result of complex compensatory effects of development pathways on land use and
climate change impacts15. We delve into potential
explanations for this in the “Species Abundance” section below.
There is growing concern that projections of species extinctions, especially those based on species-area relationships, rely on insufficiently tested hypotheses and are incoherent with recent historical extinctions
and the paleontological record16. It should also be
kept in mind that most models project the propor-tion of species that are “committed to extincpropor-tion” at some future time because their habitat or range size shrinks, but the lag time between becoming “com-mitted to extinction” and actually going extinct may
range from decades to many millennia17.
Interest-ingly, in our analysis, the model that does not use species-area curves (Jetz et al. 2007) forecasts only slightly higher extinction rates compared to those observed over the last century, while the remain-ing models project extinction rates that are as much as two orders of magnitude higher (Figure 2). Argu-ably, the Jetz et al. model may be too optimistic as it only projects extinctions when the entire
habi-tat of a species has been modified18. Furthermore,
habitat loss often makes species more vulnerable to other drivers of extinction such as exploitation, as is the case for large mammals, or disease, as is
cur-rently the case for Central American amphibians19.
In addition, future extinctions could be worse than projected in the most pessimistic scenarios in Figure 2, because the non-linear dynamics of tipping points have not been fully accounted for (see below). The above considerations clearly illustrate that there is far more uncertainty in projections of species extinc-tions than previous assessments have suggested, and therefore it is incumbent on the scientific communi-ty, biodiversity managers and policy makers to make concerted efforts to better understand this uncer-tainty and to develop plans of action accordingly.
SPECIES ABUNDANCE — Population sizes of species, also
[image:16.595.45.292.48.419.2]referred to as “species abundance”, are an important and sensitive indicator of the intensification or alle-viation of pressures on species and their habitats. Changes in species abundances of well-studied ter-restrial and marine vertebrates are the basis of the Living Planet Index (LPI), one of the most widely used measures of global biodiversity status. Models have recently been developed to project changes in
FIGURE 3 PROJECTED CHANGES IN LAND-COVER AND IMPACT ON BIRDS FOR 2100.
A) and B) Projected land cover changes due to land use and climate change for two contrasting socio-economic senarios, with the “Adapting Mosaic” being environmentally proactive and the “Order from Strength” being environmentally reactive. C) and D) Pattern of richness of species with projected range declines >=50%. The map represents the summed occurrences of qualifying species across a 0.5° grid. Source: Jetz et al. 2007.
FIGURE 4 PROJECTED CHANGES IN AREA AND VASCULAR PLANT DIVERSITY FOR EACH BIOME IN 2050.
terrestrial species abundance over the 21st century at regional and global scales, where change in species abundance is defined as the loss of species between a “natural” or relatively undisturbed reference eco-system and a transformed ecoeco-system in these
stud-ies20. We present the two published global
projec-tions of species abundance (GEO4 and GBO2), both based on the GLOBIO model, and compare them with recent trends in the LPI for terrestrial species.
Global models project that mean species abundanc-es will decrease during the first half of the century between 9% and 17% (Figure 5A). Observed trends in the Living Planet Index (LPI) for terrestrial eco-systems also show strong reductions in abundance for vertebrate species (Figure 5B), although consid-erable caution must be exercised when comparing observed and projected trends because of important
methodological differences21. Despite these
differ-ences in methods, observations and model-based projections indicate that populations of many spe-cies, especially those that depend on natural habi-tats, can be expected to decline rapidly over the next several decades at the global scale. Projections from the GEO4 even suggest that species abundances will decline at increasing rates (Figure 5A).
One of the novel aspects of the analyses of the GBO2 is that specific policy and development pathways were examined individually to study their impacts on biodiversity (Figure 6B), making analysis for pol-icy action easier than with complex socio-econom-ic storylines (e.g., MA and GEO4 scenarios). Sub-stantial increases in protected areas are projected to have the greatest positive impact on biodiversity by
2050 compared to the baseline scenario22.
Sustain-able meat production also has beneficial effects on biodiversity through reduced pressure on land use for pastures and crops. Concerted efforts to alleviate poverty have a negative effect on species abundanc-es, primarily due to increased demand for food and
energy production in this option23. Surprisingly, the
climate mitigation option results in lower species abundance than in the baseline scenario, primarily
because this option relies heavily on large-scale conversion of natural systems for biofuels. Large-scale deployment of biofuels is also a key element of “environmentally friendly” socio-economic sce-narios used by the MA (i.e., “Technogarden”) and GEO4 (i.e., “Sustainability first”) and explains in part why these scenarios don’t lead to more
favor-able outcomes for biodiversity24. A second
impor-tant explanation is that climate mitigation will have relatively small impacts on global warming by 2050
because of long time lags in the Earth system25.
Cli-mate mitigation is expected to play an extreme-ly important role in limiting biodiversity change by the end of the century, in the absence of large-scale deployment of biofuels (see examples “Shifts in the distribution of species, species groups and biomes” below).
Species abundance models avoid some of the pitfalls of projecting species extinctions, because they are anchored in observations of environmental impacts on species. However, they do have some important limitations. In particular, defining the reference eco-system can be problematic, especially when few pristine ecosystems remain or are not a relevant
baseline26. It has been suggested that long-term
pop-ulation monitoring data provides a much
stron-ger basis for a species abundance approach27, but
this is strongly limited by the lack of data for many regions and species groups (cf. LPI). An additional caveat is that these models have not been validat-ed at large regional or global scales, so we do not know if the limited number of local-scale measure-ments of species response to environmental impacts used in constructing the models can correctly cap-ture trends at these large scales.
HABITAT LOSS — Conversion of relatively undisturbed
terrestrial ecosystems to agricultural, urban systems or other highly human dominated systems, also referred to as “habitat loss”, is currently the main driver of changes in species abundance globally. All models that we have analyzed project a substan-tial loss of natural habitats over the coming century
FIGURE 5 OBSERVED CHANGES AND SCENARIO PROJECTIONS TO 2050 IN ABUNDANCE
OF TERRESTRIAL SPECIES.
A) Modelled changes in terrestrial mean species abundance (MSA) using the GLOBIO model (Alkemade et al. 2009) for the GEO4 and GBO2 scenarios from 1970 to 2050. B) The Living Planet Index (LPI) for terrestrial species is based on observed changes in the population sizes of well-studied terrestrial vertebrates from 1970 to 2005 (Source: Jonathan Loh, WWF). These two indicators assess changes in species abundances, but are calculated differently so they are not directly comparable. Nevertheless, they suggest that species abundances have been declining globally, and will continue to do so in the examined scenarios. The scenario that has the least biodiversity loss is the one where effective protected areas are implemented and expanded globally.
1970 1990 2010 2030 2050
0.7 0.8 0.9 1.0
(1970 = 1)
Historical GBO2 Protected Areas GBO2 Trade Liberatisation
GEO4 Sustainability First GEO4 Markets First GLOBIO3
A
1970 1990 2010 2030 2050
0.7 0.8 0.9 1.0
(1970 = 1)
LPI Living Planet Index
Potential 1700 1800 1900 2000 2050 0
20 40 60 80 100
M
ea
n
sp
ec
ie
s
ab
un
da
nc
e
(%
)
Biomes
Trop. grassland and savannah Temp. grassland and steppe Tropical rain forest Tropical dry forest
Mediterranean forest, woodland and shrub Temperate broadleaved and mixed forest
Temperate coniferous forest Boreal forest Desert Tundra Polar No biome distinction
%
Baseline
2050 Liberali-sation reductionPoverty Climatechange Sustainablemeat prod. Plantationforestry Protectedareas -20
-10
0 level 2000
Historical development of world biodiversity
[image:18.595.49.546.49.315.2]A B Change in mean species abundance — World
FIGURE 6 ESTIMATED HISTORICAL CHANGES IN ABUNDANCE OF TERRESTRIAL SPECIES AND COMPARISON OF PROJECTED CHANGES IN 2050 FOR DIFFERENT SUSTAINABILITY POLICIES.
[image:18.595.46.551.353.696.2]A) Historical and projected changes for a “Business as Usual” scenario in Mean Species Abundance. B) Comparison of scenarios examining the effect of different policy options on Mean Species Abundance for 2050 as compared to the Baseline projection. Projections were made using the GLOBIO model. Source: ten Brink et al. 2007.
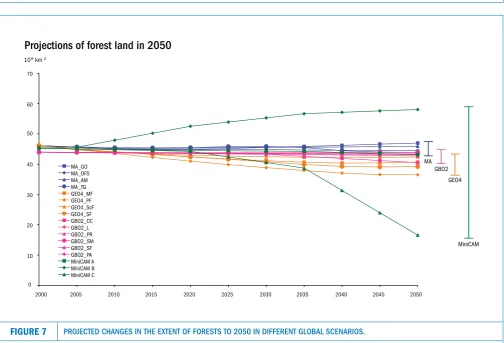
FIGURE 7 PROJECTED CHANGES IN THE EXTENT OF FORESTS TO 2050 IN DIFFERENT GLOBAL SCENARIOS.
Data sources: MA scenarios (Sala et al. 2005), GBO2 scenarios (ten Brink et al. 2007), GEO4 scenarios (UNEP 2007) and MiniCAM scenarios (Wise et al. 2009). For the MA, GBO2 and GEO 4 (all based on IMAGE (Bouwman et al. 2006)), forest includes mature forest, regrowth forest and wood plantations (for timber or carbon sequestration), but excludes woody biofuel crops. The MiniCAM scenarios uses different categories, and forest includes managed and unmanaged forest. The MiniCAM scenarios show that there is a much wider range of possible futures for forest, depending on the policies and societal choices, than had been previously anticipated in other scenario assessments. An increase in forest area can be achieved by increasing crop yields in developing countries, limiting meat consumption, and avoiding large-scale deployment of biofuels.
0 10000000 20000000 30000000 40000000 50000000 60000000 70000000
2000 2005 2010 2015 2020 2025 2030 2035 2040 2045 2050
MA_GO MA_OFS MA_AM MA_TG GEO4_MF GEO4_PF GEO4_ScF GEO4_SF GBO2_CC GBO2_L GBO2_PR GBO2_SM GBO2_SF GBO2_PA MiniCAM A MiniCAM B MiniCAM C
MA
GEO4 GBO2
MiniCAM 70
60
50
40
30
20
10
0
2000 2005 2010 2015 2020 2025 2030 2035 2040 2045 2050
106 km2
primarily due to conversion for crop or bioenergy production, or due to climate change (e.g., Figure 3 and Figure 4).
Deforestation is the most important cause of hab-itat loss at the global scale, so we have used a sim-ple index — the area of natural and semi-natural forest globally — to provide an overview of model-based projections of habitat loss. Most models proj-ect loss of forests globally, but some best-case sce-narios result in an increase in forest area by 2050 (Figure 7). The relative importance of land use and climate change in driving these losses or gains var-ies in different scenarios (Figure 3), with climate change growing in importance over time in all sce-narios. The strongest negative impacts of land-use change are projected to occur in the tropical for-ests, while boreal forests will be mainly affected by climate change (Figure 3), although global vege-tation modeling studies (see below) and our tip-ping points analyses suggest that climate change impacts in temperate and tropical forests could be much greater than previous biodiversity assess-ments have suggested.
The range of habitat loss projections across studies suggests that the differences between future path-ways may be much greater than previously anticipat-ed. Within most previous studies, there are relative-ly small differences in projected forest area change arising from the various socio-economic scenar-ios (Figure 7, GEO4, GBO2 and MA studies). This has been attributed to compensating mechanisms, two of the most important being related to
bioen-ergy production and agricultural productivity28. As
discussed above, most “environmentally friend-ly” socio-economic scenarios achieve only minor reductions in habitat loss in comparison with oth-er development pathways, in part because climate mitigation relies on large-scale deployment of bio-energy production. In contrast, some recent socio-economic scenarios suggest that climate mitigation can be plausibly achieved with modest reliance on bioenergy (Figure 7, miniCAM B). Second, most scenarios require large-scale conversion of natu-ral habitats to croplands, either because crop yield improvements are low or because food consumption
rises rapidly29. Some recent scenarios suggest that
substantially increased crop yields in developing countries is plausible (though this is hotly debated), and when combined with limited meat consump-tion can substantially reduce the conversion of
nat-ural habitats to croplands30 (Figure 7 — miniCAM B).
At the opposite extreme, plausible scenarios com-bining large-scale deployment of biofuels and rap-idly rising food consumption lead to a loss of for-ests that far exceeds the worst scenarios in previous
biodiversity assessments (Figure 7 — miniCAM C). One of the key lessons drawn from this analysis is that differences in socio-economic development pathways can have a tremendous impact on habi-tat loss as well as on biodiversity at other levels, but that the suite of storylines that have been used for most global biodiversity assessments are not well adapted to demonstrating the potential impacts of policy choices on biodiversity.
SHIFTS IN THE DISTRIBUTION OF SPECIES, SPECIES GROUPS
AND BIOMES — Shifts in the spatial distribution of
spe-cies, vegetation types or biomes have been project-ed at the regional and global scales by a wide range of models, especially niche-based models and glob-al vegetation models that focus on climate change as the main driver. We have not made an exhaus-tive review of these models and their projections, but have chosen to focus on representative exam-ples of recent work with global vegetation models.
[image:19.595.303.550.47.382.2]As shown in Figure 8 and Figure 9, climate driven shifts in the ranges of species and biomes could be many 100’s of km poleward over the next century. These shifts in the distribution of species, vegeta-tion types or biomes are important biodiversity
FIGURE 8 PROJECTED CHANGES IN MAJOR VEGETATION TYPES BY 2100 DUE TO CLIMATE CHANGE.
(a) High CO2 emissions scenario from the IPCC (A1 SRES) and (b) Low
changes even when they do not result in substan-tially increased extinction risk, declining species abundance or net habitat loss. Northern hemi-sphere forests provide a salient example of the importance of species and biome shifts. Boreal for-est species are projected to move northward into arctic tundra as climate warms, and at their south-ern edge they are projected to die back and give way to temperate conifer or mixed forest species (Figure 8, and see Tundra tipping point in Box 2). These range shifts of boreal species are likely to cause substantial disruptions in the provisioning of key ecosystem services including wood harvests and climate regulation, even though it does not lead to high levels of habitat loss (Figure 4), species extinctions (figure 3 C & D) or reductions in spe-cies abundance (Figure 6A). A wide range of stud-ies at regional scales with a broad range of model types all indicate that large scale vegetation shifts
are likely to occur in the 21st century due to
cli-mate change31. The paleontological record clearly
demonstrates that past climate change has result-ed in large-scale shifts in the distribution of spe-cies and vegetation types, and observations indi-cate that species have been moving poleward and up in altitude in response to climate warming over
the last several decades32.
The primary uncertainty is not whether species and biome range shifts will happen in response to climate change, but rather the rate and extent to which these shifts will occur. These uncertainties have been underestimated in previous global bio-diversity assessments. The IMAGE model used in most of these assessments falls in the mid-range of climate sensitivity of global vegetation models, and therefore projects modest climate change impacts
on vegetation distributions (Figure 3, Figure 4). Some other global vegetation models also foresee modest vegetation shifts even under high climate warming scenarios (Figure 9, Orchidee model), but several widely-used models project dramatic vege-tation shifts including the collapse of the Amazon forest, large-scale invasion of tundra by boreal for-est and widespread dieback at the southern edge of boreal and temperate forest ranges (Figure 8A, Fig-ure 9-Triffid model, and see Box 4 and Box 2). The moderate sensitivity of the IMAGE global vegetation model to climate change means that climate miti-gation brings about only modest reductions in bio-diversity change in this model. Other widely used, well-tested models suggest that strong climate miti-gation is absolutely essential in order to avoid large-scale displacement of species and biomes over the
21st century (compare Figure 8B, based a low
green-house gas emissions scenario, with Figure 8A, based on a high emissions scenario).
Terrestrial tipping points will hit regions with developing economies the hardest. Most tipping points will be difficult to predict because of the complex interactions between global change factors that drive them, but will have exceptionally large impacts on human well-being if they occur.
The terrestrial tipping points are summarized in Boxes 2 to 8 and described in greater detail in the Appendices. This is not an exhaustive list of terres-trial tipping points: for example many arid systems have tipping points similar to those described for the Sahel, invasive species lead to tipping points in
many terrestrial systems other than islands, etc.33
We have focused on a representative sample of tip-ping points mediated by a range of global change
FIGURE 9
PROJECTED CHANGES IN VEGETATION COVER OF TREES AND HERBACEOUS SPECIES FROM 1860 TO 2099.
Trees (TREE, panels on the left) and herbaceous species (HER, panels on the right) from 1860 to 2099 based on two global vegetation models that simulate terrestrial vegetation dynamics and ecosystem function (ORC = Orchidee, TRI = Triffid). Colors indicate projected percentage cover changes. These projections are based on scenarios of the highest levels of greenhouse gas emissions considered by the IPCC (SRES A1FI) and use a common climate model. Note that areas in blue or red indicate vegetation shifts that are large enough to
be qualified as changes in biome type109.
For this study, only climate change impacts on vegetation were simulated. Source: Sitch et al. 2008.
−50 −20 −1 1 20 50 −50 −20 −1 1 20 50
LPJ HER
−50 −20 −1 1 20 50
TRI HER
−50 −20 −1 1 20 50
ORC HER 90°N
60°N
30°N
0°
30°N
180 ° 90°W 0 ° 90°E
90°N
60°N
30°N
0°
30°N
180 ° 90°W 0 ° 90°E
90°N
60°N
30°N
0°
30°N
180 ° 90°W 0 ° 90°E
90°N
60°N
30°N
0°
30°N
180 ° 90°W 0 ° 90°E
−50 −20 −1 1 20 50
ORC TREE
−50 −20 −1 1 20 50
TRI TREE
BOX 2 ARCTIC TUNDRA*
TIPPING POINT MECHANISMS
Climate warming has been and will be stronger in the Arctic than in other parts of the globe with projected increases of 3°C to 8°C for the
Arctic region by the end of the 21st century. Climate warming will cause
the widespread melting of permafrost, leading to emissions of very large quantities of greenhouse gases from organic tundra soil. Transformations from tundra to boreal forest are also predicted to decrease albedo (i.e., increase the fraction of light absorbed by the land surface) and change aerosol emissions. These changes in tundra systems are projected to further aggravate regional and global climate warming. Due to lags in the earth system, global warming is predicted to persist for several centuries even if greenhouse gas emissions decline substantially, making this biome
shift inevitable and irreversible over the 21st century.
IMPACTS ON BIODIVERSITY AND ECOSYSTEM SERVICES
Experiments, observations and models clearly show that all plausible climate scenarios will lead to continued and widespread increases in dominance of deciduous shrubs in tundra communities and decreases in abundance of herbaceous, bryophyte and lichen species. Most models project that boreal forest will heavily invade tundra over large areas by the end of the century, as has occurred during warm periods in the recent
past (e.g., 6000 years BP). The risk of 21st century extinctions is modest
given the large, contiguous ranges of many tundra species. Permafrost melting and changes in game availability have already heavily impacted some indigenous populations and these impacts are likely to become widespread and severe over the coming decades.
UNDERSTANDING OF MECHANISMS
High — Processes are generally well understood and modelled, with some notable exceptions such as climate feedbacks from cloud formation and migration rates of boreal forest species.
CERTAINTY IN PROJECTIONS
High — Models, experiments and observations are qualitatively coherent concerning the direction of change. Uncertainty is related to rates and extent of permafrost melting and boreal forest expansion.
KEY ACTIONS
Because of long lags in the earth system we have probably already passed a tipping point for long-term, widespread permafrost degradation and invasion of tundra by boreal forest, but aggressive climate mitigation could slow these processes. Adaptive management to conserve tundra systems is not feasible outside of very small areas. At local scales, grazing by large herbivorous could be managed to reduce the rate of tree encroachment. Relocation of indigenous populations is currently a viable adaptation strategy for preserving traditional livelihoods, but long-term adaptation will require cultural adjustments.
* The original text for this tipping point was prepared by Juan Fernandez (Université Paris-Sud XI, [email protected]) and Paul Leadley (Université Paris-Sud XI, [email protected]) and is available in Appendix 1. Further reading: Bigelow et al. 2003, Folley 2005, Wahren et al. 2005, Lucht et al. 2006, McGuire et al. 2009.
BOX 3 MEDITERRANEAN FOREST*
TIPPING POINT MECHANISMS
Land use scenarios foresee a decrease in cropland due to rural abandonment, and an increase of naturally regenerated vegetation and forest plantations in the Mediterranean region. In addition, climate models project increasing temperatures and decreasing precipitation for the region, leading to more frequent periods of drought and high fire risk as the vegetation becomes more flammable. An increase in fire disturbance due to climate and land use change is projected to lead to the expansion of early successional communities, such as shrublands. Shrublands, in turn, promote the recurrence of fire due to their high flammability.
IMPACTS ON BIODIVERSITY AND ECOSYSTEM SERVICES
Shrublands are species poor compared to natural forests and extensively managed farmland, so this tipping point is projected to lead to a significant reduction in species diversity. Many areas of the Mediterranean region are also currently characterised by a high heterogeneity in land use, leading to high landscape level species diversity, which will be reduced if fire brings about more uniform vegetation cover. Fire associated with expansion of early successional communities will also result in higher costs of fire control and negative impacts on infrastructure and health, as well as reductions in a broad range of regulating ecosystem services such as watershed protection and carbon storage.
UNDERSTANDING OF MECHANISMS
High — This tipping point is already occurring in many areas and the ecological feedback mechanisms in this tipping point are well documented and modelled.
CERTAINTY IN SCENARIOS
Moderate to low — A large majority of climate models predict hotter and drier climates and most land use scenarios project substantial land
abandonment for the Mediterranean region. However, changes in forest management are difficult to foresee and will play a determinant role in controlling this tipping point.
KEY ACTIONS
It is important to accelerate natural succession towards native broadleaved forest by adopting appropriate forest management practices. A shift to new forest management paradigms focusing on multifunctional forests is needed to provide multiple ecosystem services and to create forests that are more resistant to fire disturbance than current fire prone plantations. At the same time, it is important to persist in raising public awareness regarding fire prevention and the value of forests in providing a broad range of ecosystem services. At the global scale, climate change mitigation is also important.
* The original text for this tipping point was prepared by Vânia Proença (University of Lisbon, [email protected]) and Henrique M. Pereira (University of Lisbon, [email protected]) and is available in Appendix 2. Further reading: Schroter et al. 2005, Vallejo et al. 2006, Palahi et al. 2008, Pausas et al. 2008.
H C O I P
H C O I P
before: Billy Lindblom,
Flickr
.com
after
:
-Ben+Sam,
Flickr
.com
before & after
: Henrique Miguel P
drivers. We discuss below some of the common les-sons that can be drawn from the analysis of these tipping points.
UNCERTAINTIES ARE HIGH FOR MOST TERRESTRIAL TIPPING POINTS, BUT THE POTENTIAL CONSEQUENCES OF INACTION
ARE GREAT — Of the terrestrial tipping points we
exam-ined, only the Arctic Tundra tipping point is widely accepted as highly likely to occur and to affect very large areas. This high confidence is based on the strong coherence of evidence provided by experi-ments, observations and models. There is little doubt that the Coastal sea level rise tipping point will occur as there is very good evidence that sea level is rising and will continue to do so. However, the extent of the areas affected and the degree of impacts on biodiver-sity and ecosystem services will depend on several factors with high uncertainty (e.g., sea level rise, sed-imentation rates, land use, etc). Projections of future
sea level rise have recently been revised upwards34,
leaving little hope that the extent of the areas heav-ily impacted will be small. The invasive species tip-ping point is ongoing and nearly linear trends in nat-uralized invasives on islands over the last 100–150 years suggest that there is not much hope in stop-ping invasions in the near future, resulting in large
impacts on global species extinctions. The Mediter-ranean tipping point will almost certainly occur in the future in the absence of good land use manage-ment, because it has already occurred in the past in some areas with negative impacts on biodiversity and local ecosystem services. However, the extent of areas affected by these tipping points in the future is difficult to forecast because of the importance of land management decisions in controlling them. The West Africa tipping point for land degradation has already been passed on several occasions with dramatic consequences for human well-being. There are, however, very large uncertainties concerning the future of this tipping point because of diametri-cally opposed climate model projections of rainfall and because the evolution of governance is excep-tionally difficult to foresee for this region. There is relatively high uncertainty concerning the Amazon tipping point, but if the widespread dieback of the Amazonian forest occurred over the course of the next several decades it would have overwhelming large negative impacts on biodiversity, regional rain-fall and global climate. One of the most uncertain is the Miombo tipping point, but the high potential for extremely large impacts on species and habitat loss in the near future make this region of great concern.
BOX 4 AMAZONIAN FOREST*
TIPPING POINT MECHANISMS
Two interacting tipping points could result in widespread dieback of humid tropical forest in the Amazon. 1) Forest conversion to agricultural land and burning alter regional rainfall and increase drought. Forest fragmentation and drought are projected to increase the susceptibility of forests to fire and dieback, leading to a vicious cycle in which fire and dieback become widespread. 2) Some climate models project substantial reductions in rainfall for the Amazon. Reduced rainfall combined with rising temperatures result in forest dieback and reduced transfer of water to the atmosphere in some vegetation models, setting off feedbacks that lead to a drier climate in which humid tropical forest is permanently replaced by shrub and grass dominated vegetation. A recent study of the combined impacts of these two processes suggests that parts of the Amazon may already be close to a forest dieback tipping point.
IMPACTS ON BIODIVERSITY AND ECOSYSTEM SERVICES
The Amazon forest, especially at its western edge, is one of the most species rich areas of the world. Widespread dieback of humid tropical forest would lead to much higher reductions in species abundance and extinctions of plants and animals than foreseen in previous global biodiversity assessments. Moreover, widespread fires and forest dieback could lead to massive degradation of sustaining and regulating ecosystem services, such as losses of carbon stored in vegetation and soils that would
be large enough to significantly influence atmospheric CO2 concentrations
and global climate.
UNDERSTANDING OF MECHANISMS
Moderate — Many of the biophysical mechanisms are reasonably well understood, but the response of forests to drought and fire less so. Some observations and experiments lead credence to predictions of dieback, but others suggest that humid tropic forest is less sensitive to drought than
some models predict. The response of forests to rising CO2 is a critical
determinant of projected dieback, but is not well understood.
CERTAINTY IN PROJECTIONS
Moderate to Low — There is substantial uncertainty in the land use tipping point mechanism, but several modeling studies suggest there is a significant risk of dieback when deforestation exceeds 20% – 40% of original forest area. For the global climate change mechanism, there are large differences between climate and vegetation models concerning future precipitation regimes and impacts on forests.
KEY ACTIONS
A precautionary approach would suggest that deforestation should not exceed 20% of original forest area, fire for clearing should be minimized and global climate warming should be kept below 2°C in order to avoid this tipping point. This will require concerted efforts to implement sustainable agricultural practices, establish large protected areas, reduce of national and global pressures for increased meat and feed production, etc. Application of REDD+ initiatives could lead to a win-win situation for biodiversity and climate if appropriately implemented. As current trends will likely take cumulative deforestation to 20% of the Brazilian Amazon at or near 2020, a programme of significant forest restoration would be a prudent measure to build in a margin of safety.
* The original text for this tipping point was prepared by Carlos Nobre (Instituto Nacional de Pesquisas Espaciais, [email protected]), Paul Leadley (Université Paris-Sud XI, [email protected]) and Juan Fernandez (Université Paris-Sud XI, [email protected]) and is available in Appendix 3. Further reading: Betts et al. 2008, Malhi et al. 2008, Nepstad et al. 2008, Nobre and Borma 2009. World Bank. 2010.
H C O I P
before & after
MOST OF THE TERRESTRIAL TIPPING-POINTS RESULT FROM COMPLEX MECHANISMS AND INTERACTIONS THAT ARE NOT
ACCOUNTED FOR IN MODELS — Sala et al. (2005)
iden-tified interactions between a broad range of glob-al change drivers as one of the most important unknowns in modeling future biodiversity chang-es. However, models treat only a small range of global change drivers and rely on methods that, at best, only partially account for interactions between drivers. Of the tipping points that we have identi-fied, only the Tundra tipping point is reasonably well accounted for in models, because it depends almost entirely on interactions between global cli-mate change, broad vegetation shifts and physical and greenhouse gas feedbacks to global climate, which are processes incorporated in many mod-els (Figure 8 and Figure 9). One of the Amazon tip-ping point mechanims, is rarely accounted for in global models (but see Figure 9, Triffid), because most models do not account for dynamic feedbacks between vegetation and regional climate. Fire and its interactions with land management are key driv-ers of several of the tipping points (see the Amazon, Mediterranean, Miombo, and West Africa tipping points). For example, several global and regional
models include fire35, but accounting for its
inter-action with land management remains a difficult
task. Invasive species are rarely accounted for in biodiversity scenarios even though they have large impacts on biodiversity in many terrestrial
ecosys-tems36 and are one of the main drivers of biodiversity
loss on islands. Governance, or lack thereof, plays a critical role in all of the tipping points. Sensible reg-ulation of construction in coastal areas would lim-it some of the impact of sea level rise on biodiver-sity; regional land use planning could help strike a balance between the need for provisioning servic-es on one hand and biodiversity conservation on the other hand, etc. This type of local and region-al governance is exceptionregion-ally difficult to include in global models, but is often the key to avoiding many of the tipping points. These and multiple oth-er examples in our tipping points analyses show that we are far from having a predictive understand-ing of most tippunderstand-ing points. This does not mean that we are unable to foresee these tipping points with some confidence: it does, however, mean that we often cannot provide decision makers with quanti-tative thresholds beyond which the system is like-ly to switc