International Journal of Innovative Technology and Exploring Engineering (IJITEE) ISSN: 2278-3075, Volume-8 Issue-12, October 2019
Enhanced Weight Based Convolutional Neural
Network (EWCNN) and Fuzzy Clustering For
Semantically Rich Multi-Label Social Emotion
Classification
Selvapriya.M, MariaPriscilla.G
ABSTRACT: In Recent Years, Social Emotion In Recent Years Acquires Natural Language Processing Researchers’ Attention, Because Of Analyzing User-Generated Emotional Documents On The Web. But, These Emotions Has Noisy Instance Mixed And It Is Great Dispute To Acquire The Textual Meaning Of Short Messages. Definition: In General, Large-Scale Datasets Will Have Many Noisy Data, Which Can’t Be Used Readily And Also It Is Costly, Because Of Ambiguity Of Various Informal Expressions In User-Generated Comments. It Is Very Tedious One To Recognize The Similar User Documents From The Entire Social Media Text Message. Furthermore, Online Comments Are Characteristically Categorized By A Sparse Feature Space, Which Makes The Respective Emotion Classification Task A Complex One. Methodology: Three Major Contributions Were Done In This Work In Order To Rectify These Problems, They Are: Development Of A Novel Mutation Bat Optimization Based Sparse Encoding (MBO-SC) Which Transforming The Sparse Low-Level Features Into Dense High-Level Features, Was The 1st Contribution, Next Is, An Enhanced Weight Based Convolutional Neural Network (EWCNN) To Target-Specific Layer. It Influences The Semantically EWCNN Classifier To Include Semantic Domain Knowledge Into The Neural Network To Bootstrap Its Inference Power And Interpretability. Fuzzy Clustering Algorithm Is Proposed To Minimize The Similarity Among Two Documents. Uses: It Is Quite Constructive In Recommending Products, Collecting Public Opinions, And Predicting Election Results. Proposed Work Is Distinguished With The Existing Methods, With The Metrics Such As: Precision, Recall, Sensitivity, Specificity, F-Measure And Accuracy. From The Experimental Result It Is Confirmed That The Quality Of Learned Semantic Vectors And The Performance Of Social Emotion Classification Can Be Enhanced By Proposed Models.
INDEX TERMS: Data Mining, Social Media Data, Clustering, Classification, Transfer Learning, Sparse Coding, Social Emotion Classification, Enhanced Weight Based Convolutional Neural Network (EWCNN), Mutation Bat Optimization Based Sparse Encoding (MBO-SC) And Fuzzy Clustering.
I. INTRODUCTION
People‘s feelings and thoughts, were measured by the key factor called emotions. Online social media, like Twitter and Face book, have changed the language of communication. At present, people can communicate facts, opinions, emotions, and emotion intensities on various kinds of topics in short texts.
Revised Manuscript Received on October 05, 2019.
Mrs. Selvapriya.M, Assistant professor in Hindusthan College of Arts & Science,Coimbatore
Dr.G Maria Priscilla,Professor and Head
Department of Computer Science at Sri Ramakrishna College of Arts & Science, Coimbatore.
In the natural language processing research field, examining the emotions have got much attention from the researchers. Further, it has various applications in commerce, public health, social welfare, etc. For example: it helps in public health [1,2], public opinion detection about political tendencies [3], brand management [4], and stock market monitoring [5]. Emotion analysis is the task of determining the attitude towards a target or topic. The attitude can be the divergence (positive or negative) or an emotional state like joy, anger, or sadness [6].
Estimating the aggregation of emotional responses shared by different users; such a computational task has been introduced as one of the bench-mark tasks since the ―SemEval‖ conference was held in 2007, was the target of social emotion classification. But, earlier analysis on social emotion classification repeatedly adopted a wordlevel classification technique which doesn‘t fulfil to effectively distinguish different emotional senses carrying by the same word. The emotion-topic model [7] and three supervised topic models, such as the multi-label supervised topic model, the sentiment latent topic model, and the affective topic model [8, 9] were established to classify social emotions with reference to ―topics‖ which represents a semantically coherent ―concept‖, in order to mention those weaknesses. Further, the same word in different topics may convey different attitudes.
Semantically Rich Multi-Label Social Emotion Classification
were there in the conventional approaches to emotiondetection. Provided with the recent success of deep learning models, different neural network models and advanced attention mechanisms have been proposed for this task and have accomplished highly competitive results on several benchmark datasets [14-15].
The previous approach tends to learn the sentence representation to pay more attention to general sentiment words like good but less attention to the other sentiment-ambiguous words such as shock that are also integral to emotion classification, when enforcing these classification approaches to proposed scenario. Both the sentiment and the emotion-specific words were acquired by the latter approach. Enhancing the performance of multi-label emotion classification with the help of sentiment classification was the main focus of our proposed work. In order to classify the sentence representation into two different feature spaces, which are expected to correspondingly capture the general sentiment words and the other important emotion-specific words via a dual mechanism, the author proposed the new machine learning algorithm. Transforming sparse low-level features to dense high-level features by Mutation Bat Optimization based Sparse Encoding (MBO-SC), their effectiveness on emotion classification requires further investigation, was the basic contribution of this work. Reducing the similarity between two documents was done by Fuzzy Clustering algorithm. Unsupervised teaching models was leveraged to include the semantic domain knowledge into the neural network to bootstrap its inference power and interpretability, was performed by the novel model of semantically rich EWCNN.
II. LITERATURE REVIEW
Joint Binary Neural Network (JBNN) was proposed by He et al [14] in order to state these drawbacks: the depiction of the text is fed to a set of logistic functions rather than a softmax function, and the multiple binary classifications are carried out synchronously in one neural network framework. Furthermore, the relations among labels are captured through training on Joint Binary Cross Entropy (JBCE) loss. To fulfil the meet multi-label emotion classification, the author further proposed to include the prior label relations into the JBCE loss. From the experimental result it is confirmed that the JBNN model performs considerably better when compared with the state-of-the-art multi-label emotion classification methods, in both classification performance and computational efficiency.
An attention-based classifier was proposed by Kim et al [15], for estimating the multiple emotions of a given sentence. Human‘s two-step procedure of sentence understanding was imitated by this model and it further effectively symbolizes and classifies sentences. The model‗s performance was further enhanced by emoji-to-meaning preprocessing and extra lexicon utilization. Further it was trained and computed the model with data given by SemEval-2018 task 1-5, each sentence of which has several labels among 11 given emotions. Attention-based classifier
accomplishes 5th/1st rank in English/Spanish
correspondingly. This method doesn‘t consider a latent relation of emotions in the dataset.
With the help of using Plutchik‘s wheel of emotions model and a rule-based approach for emotion detection in text makes it a good framework for emotion classification on social media and this was argued by Tromp and Pechenizkiy [16]. A detailed description was given on how to determine the rule-based patterns for Plutchik‘s wheel emotion detection, how to learn them from the annotated social media and how to enforce them for classifying emotions in the previously unseen texts. The described framework is promising and that it advances the current state-of-the-art in emotion detection, which was confirmed from the experimental result. Proposed work executes better when compared with other languages from other groups, for instance: Slavic languages or Asian languages. It is also plan to explore methods to recognize the patterns in an automated fashion instead through a manual labelling process.
The representation of tweets using a novel set of feature was given by Jabreel et al [17], which, in turn, incorporates the bag of negated words and the information given by seven lexicons. According to the Support Vector Machine, the polarity of tweets was determined by a classifier. On the standard tweet sets with the help of the SemEval 2015 competition, this system has been computed, so the obtaining results that, in most cases, beats those of the state-of-the-art sentiment analysis systems. Further it gives less attention to the other sentiment-ambiguous words like shock.
Topic-Level Maximum Entropy (TME) model for social emotion classification over short text was given by Rao et al [18]. This model establishes the topic-level features by modelling latent topics, multiple emotion labels, and valence scored by several readers jointly. By mapping the features to the concept space, we can rectify the over fitting problem in the maximum entropy principle. The effectiveness of TME on social emotion classification over sparse words was evaluated by this experiment which is performed on the real-world short documents. But data sparse problem can‘t be rectified by this approach.
The classification of social emotions on varied-scale data sets was concerned by Li et al [19]. Unlike the traditional models which weight training documents equally, the idea of emotional entropy was proposed to compute the weight and deal with the issue of noisy documents. We make use of the topic assignment for distinguishing the different emotional senses of the same word. An experimental evaluation through various data sets computes the effectiveness of the proposed social emotion classification model. A generalized index of document importance was developed by enhancing the emotional entropy.
International Journal of Innovative Technology and Exploring Engineering (IJITEE) ISSN: 2278-3075, Volume-8 Issue-12, October 2019
Also a Bayesian-based model was proposed to learn document-level semantic features. Experiments on two real-world datasets represent that the quality of learned semantic vectors and the performance of social emotion classification can be enhanced by models. The training of PCNN takes much time on large datasets.
A development of a novel deep learning-based system was proposed by Jabreel and Moreno [21], which mentions the multiple emotion classification problems in Twitter. Proposed a novel method to change it to a binary classification problem and develop a deep learning approach to rectify the transformed problem. Proposed system beats the state-of-the-art systems, accomplishing an accuracy score of 0.59 on the challenging SemEval2018 Task 1:E-cmulti-label emotion classification problem. Deep learning-based system doesn‘t model the relationships among the phrases and the labels.
III. PROPOSED METHODOLOGY
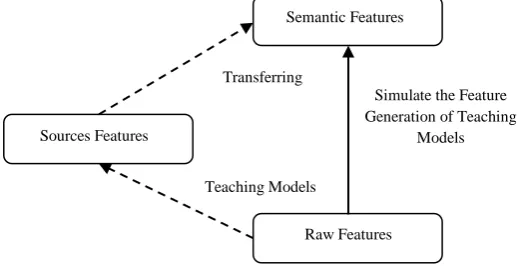
[image:3.595.88.246.519.757.2]The performance of multi-label emotion classification was enhanced through sentiment classification and this was the main target of this proposed work. Furthermore, sparse feature space was characterized by online comments, which establishes the respective emotion classification task very difficult. Otherwise, a novel Mutation Bat Optimization based Sparse Encoding (MBO-SC) which transforming the sparse low-level features into dense high-level features, was the 1st contribution, next is, an Enhanced Weight based Convolutional Neural Network (EWCNN) to target-specific layer. It influences the semantically EWCNN classifier to include semantic domain knowledge into the neural network to bootstrap its inference power and interpretability. And it classifies the sentence representation into two different feature spaces, which are expected to respectively capture the general sentiment words and the other important emotion-specific words via a dual mechanism. Final Fuzzy Clustering algorithm is proposed to minimize the similarity among two documents. The overall representation of the proposed work is shown in the figure 1.
Figure 1. Flow Diagram Of The
PROPOSED WORK 3.1.Biterm Topic Model (BTM)
The Biterm Topic Model (BTM) [22], a probabilistic generative model, which acquires the generation of word co-occurrence patterns in short messages and it, further, extends the conventional word boundary by including the virtual text window of comprising n words. Specifically, if the window size is assumed two, two words (i.e., a biterm, which is an unordered word pair co-occurring in a document) is treated as an individual syntactical unit for predicting the generation probability, and it shares the same topic drawn from the entire corpus. The co-occurrence of words was captured by BTM explicitly, for improving the topic learning, and it improves the problem of sparsity at the document level.
3.2.Word2vec
Google gives the Word2vec as an open source tool, which indicates the words as vectors and extracts the associations between words in a textual corpus and it is so called as word embeddings [23]. With the help of unsupervised learning, it generates meaningful word embedding representation and further it will be trained to extract the meaningful word embedding representation. Specifically, every word will be mapped to a high dimensional word embedding vector, and word embedding vectors with similar semantic meanings appear in a cluster. Otherwise, it is termed as the word embedding vectors which indicates the semantic relations between words which can be leveraged to improve the text classification tasks [24].
3.3.Sparse coding
Semantically Rich Multi-Label Social Emotion Classification
Figure 2. Lsm- Transfer Learning Initiated By Teaching Models The KL divergence between the distribution of the semantic
features were established for a regularized transfer learning of the LSM, with the help of the teaching model and the approximated distribution learnt by the LSM must be minimized (Eq. (1)), and further, the sparsity of the hidden units of the LSM should be regulated. A LSM mimic‘s feature generation by acquiring the source features were created by unsupervised teaching techniques. LSM learns a mapping function 𝑓(𝑣𝑑|𝑤, 𝑏)with the intension
that𝑓 𝑣𝑑 𝑤, 𝑏 techniques 𝜑𝑑, here w,b indicates the
network‘s weight terms and b represents the network parameters, and 𝜑𝑑denote the source features of a document d, which were established by a teaching model. A Softmax function helps to beat the LSM, with the target of generating normalized variables. Specifically, for establishing the transfer learning function, Kullback-Leibler Divergence (KLD) was enforced in this manner:
L 𝜑, 𝑓 = 𝜑 log𝜑
𝑓+ 1 − 𝜑 log
(1−𝜑)
(1−𝑓) (1)
Here 𝜑is the source features generated by an unsupervised teaching technique, and f is the approximate distribution
𝑓(𝑣𝑑|𝑤, 𝑏)learned by the LSM. KL divergence is a
(non-symmetric) measure of the variance between the two probability distributions [22]. It is regularly a non-negative value, which is zero when the two distributions are alike. Based on Equation (1), the transfer learning function was reported as the KL divergence among the distribution of the source features which has been created by the teaching model as well as the approximate distribution of these features learned by the LSM. The distributions of source features generated by the teaching model are assumed as constants, and just the last term that function as the network parameters is related to optimization while we focus on calculating the estimated expectation. Hence, maximizing the log-likelihood transmits to minimizing the KL divergence in addition to its gradient in this manner:
𝜕𝐿(𝜑, 𝑓)
𝜕𝑤𝑖𝑗
= −(𝜑𝑗− 𝑓𝑗 𝑣 𝑤, 𝑏 . 𝑣𝑖
(2)
𝜕𝐿(𝜑, 𝑓)
𝜕𝑏𝑖𝑗
= −(𝜑𝑗− 𝑓𝑗 𝑣 𝑤, 𝑏
(3)
In order to enhance the entire performance of the hybrid neural network because not all semantic features (e.g., topics) produced by a teaching model is appropriate in terms of the target task (e.g., social emotion classification); so, we make use of the sparse encoding for LSM. Hence, some of
the transferred features should be filtered out through proposed sparse encoding method.
The sources features of a specific dimensionality have been generated for developing the appropriate dimensionality with the help of a teaching model were enforced to proceed with the target classification task (e.g., social emotion classification). By systematically trying out various dimensionality values of source features, and monitoring the respective performance of the classification task according to the training set, which can develop the appropriate dimensionality of the source features.
Mutation Bat Optimization (MBO)
Bat Algorithm [27-28] functions according to the echolocation capability of micro bats which has been guided by their foraging behaviour. In BA, the position of a bat was indicated with the help of the number of features in the documents of Semeval dataset {𝑑1𝑗, 𝑑2𝑗, . . . , 𝑑𝑛𝑗} be a set of documents which has been utilized for sparse coding issue in the multi-label emotion classification. The position of the web documents from SemEval dataset the ith bat can be formulated as 𝑥 = 𝑥1𝑗, … 𝑥𝑛𝑗 . The fitness function
𝑓𝑖𝑡𝑖respective to the classification accuracy of the multi-label emotion classification with the point of the bat locates [29]. In this work fitness function is nothing but: exactly classified documents from one class to another document with same class.
a) Initiation of bats
Bats don‘t know the location of web documents initially. So, they will create a randomly distributed population P of N solutions, where ‗i‘ represent the number of documents in the Semeval dataset where i=1,..n. Every sparse coding result can be generated within the search space as follows:
feij = femin + rand 0,1 femax − femin (4)
Where i = 1, … n andj = 1, … D, fmax & fmin indicate the upper and lower bounds of the dimensionality reduced features in documents i and jth correspondingly and
rand 0,1 is a uniformly distributed value with the range
[0,1].
b) Generation of New Solutions
The new dimensionality reduced features solution was changed by bats and it works according to the documents of the current positions of the bat and the best reduced sparse coding features by the
performance of classification
Semantic Features
Raw Features Sources Features
Transferring
Teaching Models
Simulate the Feature Generation of Teaching
International Journal of Innovative Technology and Exploring Engineering (IJITEE) ISSN: 2278-3075, Volume-8 Issue-12, October 2019
task based on the training set.
By adjusting the flying directions the bats will move with the help of their own and other swarm members‘ best classification accuracy, for recognizing the dimensionality reduced feature. Here, for every position𝑓𝑒𝑖, a new key was devised as follows:
𝑓𝑟𝑒𝑖 = 𝑓𝑟𝑒𝑚𝑖𝑛 + 𝛽 𝑓𝑟𝑒𝑚𝑎𝑥 − 𝑓𝑟𝑒𝑚𝑖𝑛 (5)
𝑣𝑒𝑖𝑡 = 𝑣𝑒𝑖𝑡−1+ 𝑓𝑒𝑖𝑡− 𝑓𝑒∗ 𝑓𝑟𝑖 (6)
𝑓𝑒𝑖𝑡 = 𝑓𝑒𝑖𝑡−1+ 𝑣𝑒𝑖𝑡 (7)
where ‗i’ indicates each users in the cloud computing environment, 𝑖 = 1, … 𝑁, and t indicates the tth iteration. 𝑓𝑒𝑖𝑡and 𝑣𝑒𝑖𝑡are the position and velocity components of the ith document in the Semeval dataset at the tth iteration. 𝑓𝑟𝑒𝑖 represented the pulse frequency that
affects the velocity of the ith document,
𝑓𝑟𝑒𝑚𝑎𝑥and 𝑓𝑟𝑒𝑚𝑖𝑛indicates the maximum and minimum of
𝑓𝑟𝑒𝑖 . 𝛽 is a random number between [0,1][27] .
The accuracy of the multi-label emotion classification will be enhanced when 𝛽 is computed via the use of the mutation parameter. From the random value, two or three more choices of the values were combined together, further the mutated value of random number which provides the highest classification is assumed as the sparse reduced feature results. From its initial state, mutations alters one or more random values in a 𝛽. The solution modifies entirely from the previous best random distribution result for sparse reduction in SemEval Dataset for emotion and sentiment classification. 𝑓𝑒∗is the best position found from the whole SemEval Dataset for sparse reduction in SC.
c) Local Search
The local search is invoked by bats‘ random walk, once after the new reduced dimensionality features were chosen from MBO and sparse coding. Choose 𝑓𝑒𝑜𝑙𝑑𝑖 from the SemEval and generate a new feature 𝑓𝑒𝑛𝑒𝑤𝑖 , if the pulse emission rate 𝑒𝑟𝑖 ∈ [0,1] of the ithdocument is smaller than a random number, and they were expressed as:
𝑓𝑒𝑛𝑒𝑤𝑖 = 𝑓𝑒𝑜𝑙𝑑𝑖 + 𝜀𝐴𝑡 (8)
where 𝑓𝑒𝑜𝑙𝑑𝑖 indicates a solution which is selected in current SemEval for emotion classification and 𝜀 is a random vector drawn from a uniform distribution. 𝐴𝑡 is the average loudness of all samples at iteration t .
d) Solutions, Loudness, and Pulse Emission Rate Updating
If a random number is bigger when compared with the loudness 𝐴𝑡and 𝑓𝑖𝑡 𝑓𝑒
𝑛𝑒𝑤𝑖 < 𝑓𝑖𝑡 𝑓𝑒𝑖 , they will accept
the newly dimensionality reduced sparse coding features 𝑓𝑒𝑛𝑒𝑤𝑖 . Simultaneously, the loudness 𝐴𝑡 will be reduced while its pulse emission 𝑟𝑖is increased as follows[29]:
𝐴𝑡+1𝑖 = 𝛼𝐴𝑖𝑡 (9)
𝑟𝑖𝑡+1 = 𝑟𝑖0 1 − 𝑒−𝛾𝑡 (10)
where 𝛼and 𝛾are constants. The initial loudness 𝐴0and initial pulse emission rate 𝑟
𝑖0 are randomly generated numbers in the range of [1,2] and [0,1], correspondingly.
Algorithm 1. MBO with Sparse Coding
Input: Input documents of SemEval dataset
{𝑑1𝑗, 𝑑2𝑗, . . . , 𝑑𝑛𝑗}
Output: dimensionality reduced features 1. Set iter=1
2. Initialize the Semeval dataset position and velocity of each Semeval dataset in the documents
3. Evaluate the fitness value of the classification accuracy
4. While iter ≤ iter_max do
4.1.Find the suitable dimensionality reduced features
4.2.Generate new solutions using Eq. (5) ~Eq. (7) // As a result, a new key was devised
4.3.if rand(0,1) > ri
i) Generate a new reduced feature vector with the selected solution 𝑓𝑒∗using Eq. (8) //Local Search Process
ii) Until it reaches all Semeval dataset iii) Break
4.4.End if
4.5.if rand (0,1)<Ai and 𝑓𝑖𝑡 𝑓𝑒𝑛𝑒𝑤𝑖 < 𝑓𝑖𝑡 𝑓𝑒𝑖 Update the new reduced feature vector, loudness and pulse emission rate by Eq. (9-10) // Solutions, Loudness, and Pulse Emission Rate Updating
4.6.end if 5. end while
6. return dimensionality reduced features
3.4.Enhanced Weight based Convolutional Neural Network (EWCNN)
This phase novel model of semantically rich Enhanced Weight based Convolutional Neural Network (EWCNN) is proposed which influences the unsupervised models to include the semantic domain knowledge into the neural network to bootstrap its inference power and interpretability. Here resort to sentiment classification was assumed to transfer learning scenario, because of the limited number of annotated data for multi-label emotion classification. Let
𝐷𝑠 = 𝑥𝑚, 𝑦𝑚
𝑚 =1
𝑀 be another set of labeled sentences for sentiment classification, where y(m) is the ground-truth label indicating whether the mth sentence is positive, negative or neutral.
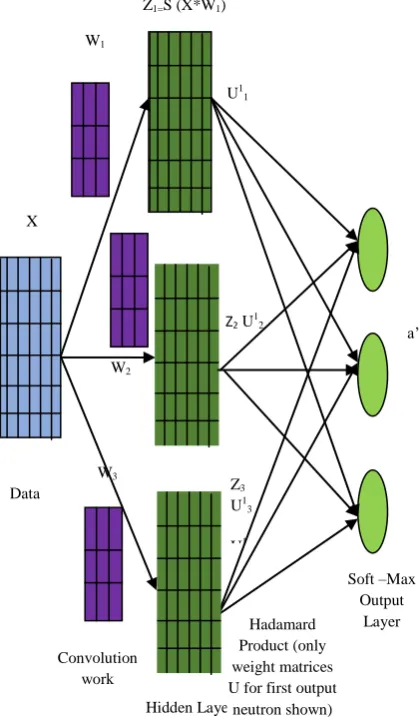
For emotion classification, Enhanced Weight based Convolutional Neural Network (EWCNN) algorithm is proposed in this work. Figure 3 reveals the architecture of a CNN with a single hidden convolutional layer and three convolutional masks. Without any constraints, the two sparse reduced feature spaces may both be liable to pay more concentration to frequently occurring and significant sentiment words like great and happy, but less to those hardly ever occurring but crucial emotion words like anxiety
and panic. Hence, to
Semantically Rich Multi-Label Social Emotion Classification
words and emotion-specific words correspondingly, proposethrough the attention weights are computed from the shared
layer as extra inputs for target-specific layer.
[image:6.595.191.401.76.435.2]Solutions, Loudness, and Pulse Emission Rate Updating Figure 3. Enhanced Weight Based Convolutional Neural Network (Ewcnn) The diagram reveals a EWCNN with just one hidden
convolutional layer [30]. The input samples X convolves with the 3 masks W1, W2, and W3. The resulting emotion classifications via the hidden neurons were executed with logistic sigmoid activations [31]. Then the EWCNN measures the element-wise Hadamard products among the hidden neuron activation matrices Z1, Z2, and Z3 with weight matrices 𝑈𝑗𝑘 where j = 1, 2, 3 and k = 1, 2, 3. The output neurons have softmax activations that determine a discrete Gibbs probability density function. Let X indicates the input two-dimensional data of size MX × NX where MX and NX are positive integers. The 2D filters W1,.. , WJ are every of size MW ×NW . Then the convolution of X with the filter Wj gives the matrix
𝐶𝑗 = 𝑋 ∗ 𝑊𝑗 (11)
where ∗ represents 2D convolution. The 2D data matrix Cj has size (MX + MW − 1) × (NX + NY − 1) with (m, n)th entry
𝐶𝑗(𝑚, 𝑛) = 𝑋 𝑎 − 𝑚, 𝑏 − 𝑛 𝑊𝑗 𝑎, 𝑏
𝑁𝑊
𝑏=1
𝑀𝑊
𝑎=1
(12)
Pad X with zeros to determines it at all points in the above double sum. Then pass the J matrices C1, . . . , CJ element-wise through logistic sigmoid functions s to give the hidden-neuron activations Zj:
𝑍𝑗 𝑚, 𝑛 = 𝑠 𝐶𝑗 𝑚, 𝑛 =
1
1 + exp(−𝐶𝑗(𝑚, 𝑛))
(13)
Suppose the network has K output neurons. A (MX +MW −1)× (NX + NY − 1) weight matrix 𝑈𝑗𝑘 multiplies the jth hidden neuron matrix Zj element-wise. The softmax or Gibbs activation at k of the kth output neuron is the ratio
𝑎𝑘𝑡 =
exp 𝑒𝑇𝑍
𝑗⊙ 𝑈𝑗𝑘𝑒
𝐽 𝑗 =1
exp 𝑒𝑇𝑍
𝑗⊙ 𝑈𝑗
𝑘1
𝑒
𝐽 𝑗 =1 𝐾
𝑘1=1
(14)
Where ⊙ represents the element-wise Hadamard product among two matrices,
e is a vector of all 1s of
Z1=S (X*W1)
W1
X
W2
W3
U11
Z2 U1 2
a‘
Z3 U1 3
U1 3 Data
Convolution work
Hidden Layer
Hadamard Product (only weight matrices U for first output
neutron shown)
Soft –Max Output
International Journal of Innovative Technology and Exploring Engineering (IJITEE) ISSN: 2278-3075, Volume-8 Issue-12, October 2019
length (MX + MW − 1)(NX + NW − 1). The JK matrices 𝑈𝑗𝑘 (j = 1, . . . , J and k = 1, . . . , K) are the weights of the connections among the hidden neurons and the output neurons.
Another similarity loss has been brought-in to clearly implement the variations among the two attention weights of the semantic and emotion is measured through the use of the mean value between the documents. The mean values among the dataset were measured to discriminate the exact variations among the sentiment samples. Need to reduce the similarity between emotion samples, for classifying the sentiment samples efficiently.
3.5.Fuzzy clustering
Here, the dataset is indicated by Da, where Da={da1, da2, da3, …… dan}, specify n points in 2-dimensional space of the sentiment dataset. Centroids of clusters are denoted by 𝑐𝑒𝑘and c is the total number of clusters present in the dataset, k helps to represent the cluster. Hence, value of k is in the range [1,c]. It functions on the assumption that numbers of clusters ‗c‘ are known for the given dataset and reduces the objective function (𝐽𝐹𝐶𝑀), given as:
𝐽𝐹𝐶𝑀 = 𝜇𝑖𝑘𝑚𝑑𝑖𝑠𝑖𝑘2
𝑛
𝑖=1 𝑐
𝑘=1
(15)
Where 𝜇𝑖𝑘is the membership of datapoint ‗dai‘ in cluster ‗k‘ and 𝑑𝑖𝑠𝑖𝑘 = 𝑑𝑎𝑖 − 𝑐𝑒𝑘 is the Euclidean distance between ‗dai‘ and cluster center 𝑐𝑒𝑘and membership 𝜇𝑖𝑘fulfills the following relationship:
𝜇𝑖𝑘 = 1
𝑐
𝑘=1
, 𝑖 = 1, … 𝑛
(16)
and ‗m‘ is a constant value known as the fuzzifier (or fuzziness index) as it manages the fuzziness of the resulting clusters. In our execution m is considered as two. Membership of every point is updated with the help of the following equation:
𝜇𝑖𝑘 =
1
𝑑𝑖 𝑠𝑘𝑖 𝑑𝑖 𝑠𝑗𝑖
2 𝑚 −1 𝑐
𝑗 =1
, ∀ 𝑘, 𝑖 (17)
here k is an integer in range [1,c] and i is an integer in range [1,n] and
𝑐𝑒𝑘=
(𝜇𝑖𝑘𝑚𝑑𝑎𝑖)
𝑛 𝑖=1
(𝜇𝑖𝑘𝑚)
𝑛 𝑖=1
(18)
Two different feature spaces, which are expected to respectively capture the general sentiment words and the other significant emotion-specific words through a clustering and classification metrics.
The overall Step by Step Procedure of EWCNN is given as follows:
Step 1: Initialize the input SemEval dataset for the further classification process
Step 2: Follow the BTM and word2vec for pre-processing step to produce the high dimensional data and for further text classification task
Step 3: LSM method is applied on high dimensional data by sparse coding to develop the appropriate dimensionality of the source features
Step 4: Further to reduce the feature dimension the MBO with Sparse Coding is applied as the feature selection model
Step 5: The sentiment classification is finally done using the proposed EWCNN with class label of the sentence as positive, negative or neutral.
IV. RESULTS AND DISCUSSION
Datasets and experimental settings were explained here and then experimental results involve the comparative analysis among experimental method and other baseline methods. For English, we need to enforce a widely used Twitter dataset from SemEval 2016 Task 4A [32] as source sentiment classification task. Task A comprises of 3 sentiment classes — positive, neutral and negative. For target emotion classification task, we utilize the Twitter dataset recently released by SemEval 2018 Task 1C [33] which contain 11 emotions. The word embedding size d is set to be 300 for E1. Classify the tweet as 'neutral or no emotion' or as one, or more, of eleven given emotions that best represent the mental state of the tweeter:
anger (also includes annoyance and rage) can be inferred
anticipation (also includes interest and vigilance) can be inferred
disgust (also includes disinterest, dislike and loathing) can be inferred
fear (also includes apprehension, anxiety, concern, and terror) can be inferred
joy (also includes serenity and ecstasy) can be inferred
love (also includes affection) can be inferred optimism (also includes hopefulness and
confidence) can be inferred
pessimism (also includes cynicism and lack of confidence) can be inferred
sadness (also includes pensiveness and grief) can be inferred
suprise (also includes distraction and
amazement) can be inferred
trust (also includes acceptance, liking, and admiration) can be inferred
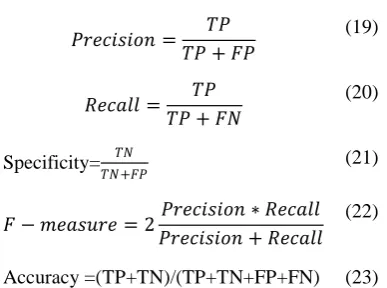
Here, we utilize SemEval-18 Task 1C and metrics like accuracy, precision, recall, sensitivity, specificity and f-measure. Precision is the percentage of the classifier success among entire tweets were classified like belong to a class, recall is the percentage of the classifier success among entire tweets belong to a class , and F-measure is an harmonic among precision and recall
Semantically Rich Multi-Label Social Emotion Classification
called the true negative rate) computes the proportion ofactual negatives that are correctly recognized as Negative.
𝑃𝑟𝑒𝑐𝑖𝑠𝑖𝑜𝑛 = 𝑇𝑃
𝑇𝑃 + 𝐹𝑃
(19)
𝑅𝑒𝑐𝑎𝑙𝑙 = 𝑇𝑃
𝑇𝑃 + 𝐹𝑁
(20)
Specificity= 𝑇𝑁
𝑇𝑁+𝐹𝑃 (21)
𝐹 − 𝑚𝑒𝑎𝑠𝑢𝑟𝑒 = 2𝑃𝑟𝑒𝑐𝑖𝑠𝑖𝑜𝑛 ∗ 𝑅𝑒𝑐𝑎𝑙𝑙
𝑃𝑟𝑒𝑐𝑖𝑠𝑖𝑜𝑛 + 𝑅𝑒𝑐𝑎𝑙𝑙
(22)
Accuracy =(TP+TN)/(TP+TN+FP+FN) (23)
[image:8.595.317.533.61.231.2]The final measure is accuracy that points to how well a provided classifier works in classifying the document. The results of the proposed EWCNN classifier are measured with Hybrid Neural Networks (HNN) [35], Semantic Emotion Topic Model (SETM) [34] , CNN and 1-NN. Table 1 shows the overall performance comparison results of the methods with respect to various metrics.
TABLE 1. METRICS RESULTS COMPARISON VS. MULTI-LABEL
EMOTION CLASSIFICATION METHODS
Metrics Methods
1-NN SETM HNN CNN EWCNN
Precision (%)
84.21 84.24 84.56 85.23 86.2806
Recall (%)
77.29 79.28 79.68 89.24 95.3712
F-measure (%)
87.09 87.71 87.27 89.33 90.1873
Specificity (%)
81.35 86.56 86.82 90.43 94.9697
Accuracy (%)
80.9 82.4 82.5 84.7 94.9
(a) Precision results comparison vs. methods
[image:8.595.73.267.112.256.2](b) Recall results comparison vs. methods figure 4. Precision And Recall Results Comparison Of
Multi-Label Emotion Classification Methods Figure 4 reveals the performance comparison results of the proposed EWCNN classifier with four classifiers like CNN, HNN, SETM and 1-NN. The results were distinguished with respect to precision and recall metrics are shown in the figure 4(a) and figure 4(b). The results shows that the proposed EWCNN classifier gives higher precision results of 86.2806%, when compared with the other methods such as 84.21%, 84.24%, 84.56%, 85.23% for 1-NN, SETM , HNN, and CNN methods respectively. Since the proposed work sentiment and emotion classification is performed independently through classification and clustering methods.
[image:8.595.47.275.353.755.2]Figure 5. Specificity Comparison Of Multi-Label Emotion Classification Methods
Figure 5 discloses the performance comparison results of the sensitivity comparison metrics to five classification
methods. The proposed EWCNN classifier was
distinguished with four classifiers like CNN, HNN, SETM and 1-NN. The proposed EWCNN classifier provides higher results of 94.96%, whereas other classifiers such as like CNN, HNN, SETM and 1-NN gives only 90.43%, 86.82%, 86.56% and 81.35% respectively. Since the proposed work, higher dimensional vector is rectified by SC with optimization method.
1 2
0 10 20 30 40 50 60 70 80 90 100
Classifiers
P
re
c
is
io
n
(%
)
1-NN
SETM
HNN
CNN
EWCNN
1 2
0 10 20 30 40 50 60 70 80 90 100
Classifiers
R
ec
al
l(%
)
1-NN SETM HNN CNN EWCNN
1 2
0 10 20 30 40 50 60 70 80 90 100
Classifiers
S
pe
ci
fic
ity
(%
)
[image:8.595.321.534.374.525.2]International Journal of Innovative Technology and Exploring Engineering (IJITEE) ISSN: 2278-3075, Volume-8 Issue-12, October 2019
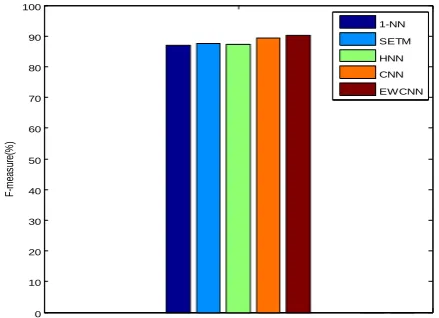
Figure 6. F-Measure Comparison Of Multi-Label Emotion Classification Methods
[image:9.595.62.275.351.499.2]In the figure 6, the F-measure comparison results of the five classification methods are shown clearly. Those methods are CNN, HNN, SETM, 1-NN and proposed EWCNN classifier. The results discloses that the proposed EWCNN classifier provides higher f-measure results of 90.18%, whereas other existing methods such as CNN, HNN, SETM, 1-NN gives of 89.33%, 87.27%, 87.71% and 87.09% respectively. Since the proposed work, higher dimensional vector is rectified by SC with optimization method.
Figure 7. Accuracy Comparison Of Multi-Label Emotion Classification Methods
In the figure 7, the accuracy results comparison of the five classification methods. The results discloses that the proposed EWCNN classifier provides higher accuracy results of 94.90%, whereas other existing methods such as CNN, HNN, SETM, and 1-NN gives of 84.70%, 82.50%, 82.40% and 80.90% respectively. Since the proposed work, higher dimensional vector is rectified by SC with optimization method.
V. CONCLUSION AND FUTURE WORK
In order to influence the sentiment classification, the author proposed the Enhanced Weight based Convolutional Neural Network (EWCNN) and Fuzzy Clustering algorithm for enhancing the performance of multi-label emotion classification. A novel Mutation Bat Optimization based Sparse Encoding (MBO-SC) is proposed for feature selection and its outcome provided as input to EWCNN classifier to precede the target classification task. Specifically, the computational models of Latent Semantic Machines (LSMs) were sponsored to include the semantic features into the proposed EWCNN classifier to enhance the
classification performance and improve the interpretability of these networks. Thus the proposed methodology produces semantically rich features which can capture various emotion contexts in better way, and hence attributes to enhance the performance of social emotion classification with high accuracy rate of 94.90%. The experiments results reveal that the proposed EWCNN classifiers are effective, and significantly beat to other state-of-the-art systems in multi-label social emotion classification, according to the social media datasets. As from the results, it is well known that the proposed method works better for the emotion classification than the CNN, HNN, SETM, and 1-NN schemes. Future work plans to program the new algorithm for computing the semantic gap among the source features produced by a teaching model and the characteristics of a target task before sparse encoding was enforced to transfer learning.
REFERENCES
1. Chen, Y.; Zhou, Y.; Zhu, S.; Xu, H. Detecting Offensive Language in Social Media to Protect Adolescent Online Safety. In Proceedings of the 2012 International Conference on Privacy, Security, Risk and Trust (PASSAT), and 2012 International Conference on Social Computing (SocialCom), Amsterdam, The Netherlands, 3–5 September 2012; pp. 71–80.
2. Cherry, C.; Mohammad, S.M.; Bruijn, B. Binary Classifiers and Latent Sequence Models for Emotion Detection in Suicide Notes. Biomed. Inform. Insights 2012, 5, BII-S893.
3. Mohammad, S.M.; Zhu, X.; Kiritchenko, S.; Martin, J. Sentiment, Emotion, Purpose, and Style in Electoral Tweets. Inf. Process. Manag. 2015, 51, 480–499.
4. Jabreel, M.; Moreno, A.; Huertas, A. Do Local Residents and Visitors Express the Same Sentiments on Destinations Through Social Media? In Information and Communication Technologies in Tourism; Springer: New York, NY, USA, 2017; pp. 655–668.
5. Yun, H.Y.; Lin, P.H.; Lin, R. Emotional Product Design and Perceived Brand Emotion. Int. J. Adv. Psychol. IJAP 2014, 3, 59–66.
6. Mohammad, S.M. Sentiment Analysis: Detecting Valence, Emotions, and Other Affectual States from Text. In Emotion Measurement; Meiselman, H.L., Ed.; Woodhead Publishing: Cambridge, UK, 2016; pp. 201–237, ISBN 9780081005088.
7. Bao, S., Xu, S., Zhang, L., Yan, R., Su, Z., Han, D. and Yu, Y., 2011. Mining social emotions from affective text. IEEE transactions on knowledge and data engineering, 24(9), pp.1658-1670.
8. Rao, Y., Li, Q., Mao, X. and Wenyin, L., 2014. Sentiment topic models for social emotion mining. Information Sciences, 266, pp.90-100. 9. Rao, Y., Li, Q., Wenyin, L., Wu, Q. and Quan, X., 2014. Affective
topic model for social emotion detection. Neural Networks, 58, pp.29-37.
10. Rao, Y., Lei, J., Wenyin, L., Li, Q. and Chen, M., 2014. Building emotional dictionary for sentiment analysis of online news. World Wide Web, 17(4), pp.723-742.
11. Wang, Y. and Pal, A., 2015, Detecting emotions in social media: A constrained optimization approach. In Twenty-Fourth International Joint Conference on Artificial Intelligence, pp.996-1002.
12. Li, L., Wang, H., Sun, X., Chang, B., Zhao, S. and Sha, L., 2015, Multi-label text categorization with joint learning predictions-as-features method. In Proceedings of the 2015 Conference on Empirical Methods in Natural Language Processing , pp. 835-839.
13. Quan, X., Wang, Q., Zhang, Y., Si, L. and Wenyin, L., 2015. Latent discriminative models for social emotion detection with emotional dependency. ACM Transactions on Information Systems (TOIS), 34(1), pp.1-19.
14. He, H. and Xia, R., 2018, Joint binary neural network for multi-label learning with applications to emotion classification. In CCF International Conference on Natural Language Processing and Chinese Computing , pp. 250-259.
15. Kim, Y., Lee, H. and Jung, K., 2018. AttnConvnet at SemEval-2018 Task 1: attention-based convolutional neural networks for multi-label emotion classification. arXiv preprint arXiv:1804.00831, pp.1-5.
1 2
0 10 20 30 40 50 60 70 80 90 100
Classifiers
F-m
ea
su
re
(%
)
1-NN SETM HNN CNN EWCNN
1 2
0 10 20 30 40 50 60 70 80 90 100
Classifiers
A
cc
ur
ac
y(
%
)
Semantically Rich Multi-Label Social Emotion Classification
16. Tromp, E. and Pechenizkiy, M., 2015. Pattern-based emotion classification on social media. In Advances in Social Media Analysis (pp. 1-20). Springer, Cham.
17. Jabreel, M.; Moreno, A. SentiRich: Sentiment Analysis of Tweets Based on a Rich Set of Features. In Artificial Intelligence Research and Development; Nebot, Á., Binefa, X., López de Mántaras, R., Eds.; IOS Press: Amsterdam, The Netherlands, 2016; Volume 288, pp. 137–146. 18. Rao, Y., Xie, H., Li, J., Jin, F., Wang, F.L. and Li, Q., 2016. Social
emotion classification of short text via topic-level maximum entropy model. Information & Management, 53(8), pp.978-986.
19. Li, X., Rao, Y., Chen, Y., Liu, X. and Huang, H., 2016, Social emotion classification via reader perspective weighted model. In Thirtieth AAAI Conference on Artificial Intelligence, PP.4230-4231.
20. Li, X., Rao, Y., Xie, H., Liu, X., Wong, T.L. and Wang, F.L., 2017. Social emotion classification based on noise-aware training. Data & Knowledge Engineering.
21. Jabreel, M. and Moreno, A., 2019. A Deep Learning-Based Approach for Multi-Label Emotion Classification in Tweets. Applied Sciences, 9(6), p.1123.
22. Cheng, X., Yan, X., Lan, Y. and Guo, J., 2014. BTM: Topic modeling over short texts. IEEE Transactions on Knowledge and Data Engineering, 26(12), pp.2928-2941.
23. Pennington, J., Socher, R. and Manning, C., 2014, Glove: Global vectors for word representation. In Proceedings of the 2014 conference on empirical methods in natural language processing (EMNLP) (pp. 1532-1543).
24. Xing, C., Wang, D., Zhang, X. and Liu, C., 2014, Document classification with distributions of word vectors. Asia-Pacific Signal and Information Processing Association Annual Summit and Conference (APSIPA), pp. 1-5.
25. Lee, H., Battle, A., Raina, R. and Ng, A.Y., 2007. Efficient sparse coding algorithms. In Advances in neural information processing systems , pp. 801-808.
26. Lee, H., Ekanadham, C. and Ng, A.Y., 2008. Sparse deep belief net model for visual area V2. In Advances in neural information processing systems , pp. 873-880.
27. Yang, X.S., 2010. A new metaheuristic bat-inspired algorithm. Nature inspired cooperative strategies for optimization (NICSO 2010), pp.65-74.
28. Yang, X.S. and Hossein Gandomi, A., 2012. Bat algorithm: a novel approach for global engineering optimization. Engineering Computations, 29(5), pp.464-483.
29. Gandomi, A.H., Yang, X.S., Alavi, A.H. and Talatahari, S., 2013. Bat algorithm for constrained optimization tasks. Neural Computing and Applications, 22(6), pp.1239-1255.
30. Cireşan, D. C., Meier, U., Masci, J., Gambardella, L. M., & Schmidhuber, J. (2011). Flexible, high performance convolutional neural networks for image classification. In Proceedings of the twenty-second international joint conference on artificial intelligence. Vol. 2 ,pp. 1237–1242.
31.
Szarvas, M., Yoshizawa, A., Yamamoto, M., & Ogata, J. (2005). Pedestrian detection with convolutional neural networks. In Proceedings of the IEEE intelligent vehicles symposium ,pp. 224–229.Mrs. Selvapriya.M, has finished BCA,M.C.A,MPhil from Hindusthan College of Arts & Science, Coimbatore and working as Assistant professor in Hindusthan College of Arts & Science,Coimbatore for Eleven years Currently pursuing regular parttime Research Scholar in Department of Computer Science at Sri Ramakrishna College of Arts & Science, Coimbatore,Tamil Nadu, India .