Abstract The article about pH meter based on Raspberry Pi 3 has been created. This instrument serves as a measure of acid base levels of solution capable of displaying a GUI ( Graphic User Interface ) based interface programmed in the Raspberry Pi 3 System On Chip with the Python programming language. The purpose of this research is to innovate Raspberry Pi 3 based pH measuring device, to create interfaces and store pH measurement data based on Raspberry Pi 3 and Python programming language, find out the results of heuristic analysis on pH meter measuring instrument innovations, and determine the accuracy of the pH meter based on Raspberry Pi 3. The method used to pH sensor chararacterization in making this measuring instrument is heuristic method.The characterization sensor result show that the accuracy value of the pH sensor is 99,97%, the precision value of the pH sensor is 99,99%, the sensitivity value of pH sensor is 6,45 mV/pH, the correlation value of the pH meter is 99,89%. Based on the result of the analysis that has been carried out, it can be conclude the innovation in pH measuring device that are made have a good accuracy and can measure well.
Keywords : ph meter, measurement, raspberry pi.
I. INTRODUCTION
A
long with the rapid development of technology in various fields of science will certainly bring significant changes from any aspect [1] – [3]. Likewise, the technological development of the field of metrology is no less developed than other disciplines. PH meter that is used to determine the acid base content contained in a liquid. pH meters are widely used in measuring the acidity of water, both drinking and non-consuming water [4] – [6]. Measuring the pH of a liquid is done to ensure that the liquid is safe for consumption and to ensure the acidity of the liquid. PH measurements are generally still done manually using a specific pH meter. If measurements are repeated or repeatability with certain measurement time intervals will certainly reduce the efficiency in making measurements [7] – [12].Based on the above problems, the authors make a pH meter based on Raspberry Pi 3 [14] – [17] and Graphic User Interface (GUI) which is expected to solve this problem. Measuring tool that is made later will display the results of pH measurements on LCD monitors that have been connected with Raspberry Pi 3 [18] – [20]. The measurement run when the amount of data to be taken and the time interval is entered
Revised Manuscript Received on November 05, 2019. * Correspondence Author
Iswanto*, Department of Electrical Engineering, Universitas
Muhammadiyah Yogyakarta, Yogyakarta, Indonesia. Email: [email protected]
Prisma Megantoro, Department of Electrical Engineering and
Information Technology, Universitas Gadjah Mada, Yogyakarta, Indonesia. Email: [email protected]
Elinda Prima Fitryana Dewi, Department of Electrical Engineering and
Informatics, Universitas Gadjah Mada, Yogyakarta, Indonesia. Email: [email protected]
into the GUI. The measurement results can later be saved also to the SD card in the .xls file format [21].
II. METHOD
The research method in this article is divided into two, namely the method used in making tools and the method of analyzing data measuring the pH measurement tools [22] – [25].
[image:1.595.307.550.398.449.2]The manufacturing of pH sensor hardware starts with preparing the tools and materials needed in the manufacture of measuring instruments and then testing each component to be used, then making tool designs, PCB designs, and making the working system of the measuring devices to be made. In making this tool the sensor used is the pH sensor [25] – [28]. The method used for the analysis of the measurement data test results in this study is the heuristic analysis. The analytical method is carried out to find the linear regression value, accuracy, precision, sensitivity, correlation, and linearity of the measuring instrument [29] – [31].
Fig. 1. Device block diagram.
The following is an explanation of the Block diagram of the Rasberry-Based Ph measurement system that will be implemented. The pH sensor is used to measure the level of acid base solution to be measured.
ADS1115 functions as an analog to digital converter (ADC), this component is used to change analog signal to digital, so it can be processed by the processor.
Raspberry Pi functions as a processor, which in this device functions to process the signal processing from ADS1115. Raspberry Pi also functions as a GUI so that the Ph reading can be displayed on LCD monitor.
A. Hardware design
The hardware design of the pH sensor starts with testing each component to be used, then makes a tool design, designs, and makes a working system of the measuring instrument to be made. In making this tool the sensor used is the pH sensor. While the test media used are buffer with concentration pH 4,01;6,86; 7,00; 9,18,10,01.
PH Meter Based Raspberry Pi and User
Fig. 2. Overall device visual, sensor not included. In designing pH measuring devices, the pH sensor is connected to the circuit contained in the PCB. Then the pH sensor is connected to ADS1115 which functions as digitizing the output signal from the sensor that is converting analog signals into digital signals. The ADS1115 and sensor are then connected to the Raspberry Pi using a jumper cable in accordance with the path on the PCB that has been made. ADS1115 is very necessary because Raspberry Pi does not have components for signal digitization.
Fig. 3. Device schematic design. Design of electrical schematic shown on Figure 3
B. Software design
The design of software on the system is very necessary so that the system on the device can run well. The design of software on this measuring instrument uses Python language. Making a Python program for sensor testing functions as an analog signal converter on a pH sensor into a digital signal which will later be processed using the Python program on the Raspberry Pi. The results of the pH measurement by the sensor will then be displayed on the LCD monitor screen and
saved to the SD card in file format .xls.
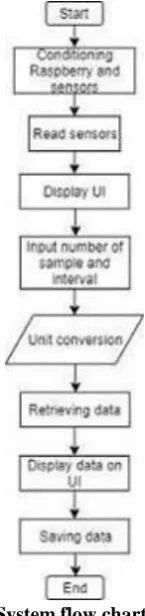
[image:2.595.389.462.198.508.2]Based on the diagram in Figure 4, the working system of this pH measuring device starts from the conditioning of the Raspberry Pi and a series of pH sensors that are assembled inside the PCB. This conditioning is done to ensure that all components used in the measuring instrument can function properly. After making sure all components can function properly, then ensure the GPIO system can run well by running on the Python program. If there is still an error in the system, then do the re-conditioning on each component. GPIO that has been installed correctly can display the UI on the monitor screen.
Fig. 4. System flow chart program.
After the UI is displayed on the monitor screen, then the input process of measuring the amount of measurement data and the measurement time interval that has been determined. Then the pH is read out by pressing the START button. Execution of the pH reading by the sensor will be repeated as many as the number of samples entered. In this process ADS1115 digitizes the signal which is then converted by the program using the heuristic conversion formula to obtain the pH value of the solution in actual units. The measurement results displayed on the UI are decimal numbers and graphs. When the program execution is complete, the measured pH data as much as the specified amount of data is then stored by pressing the SAVE button. The pH data is then stored on the Raspberry Pi’s SD Card in .xls format.
III. IMPLEMENTATION
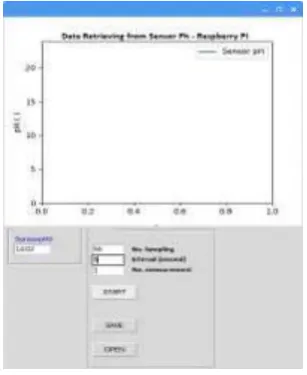
Making a pH meter using Python on the Raspberry Pi aims to display the results of pH measurements in the form of a GUI. The results of the Python UI program in making the pH meter innovation tool are shown
[image:2.595.78.269.386.651.2]Fig. 5. UI display on device operational.
Writing Python software programs for UI display uses several features such as frames for displaying graphics, buttons. START to start data collection, the SAVE button is used to store pH measurement data in the .xls format into the SD Card, and the OPEN button to open the measurement data in the .xls format that has been saved. For a sensor reading frame that displays the pH reading results of the measured solution. In addition there are also several columns such as the "amount of data" entry column that is used to enter the number of measurements taken to be taken. The "data interval" column is used to enter the measurement data interval number. In this test the authors measured 55 data with a measurement interval of 5 seconds. Furthermore, the column "data collection to -" which serves as a display of measurement numbers in progress. The standard pH reading is done manually using a standard pH meter then analyzing using .xls.
Fig. 6. Data displayed on Python Shell. A. Circuit test
The circuit test is carried out by means of testing the component voltage value at each connection. Based on the results of testing a series of innovative pH meter measuring devices concluded that each component is well connected. The measured pH sensor input voltage value is 4.92 V. The measured sensor output voltage value is 2.43 V. The measurement results of the input voltage are then entered into the pH conversion formula.
B. Static character of sensor
This test is conducted to determine the static of the Ph sensor. Static characters tested are; regression equations, accuracy, precision, sensitivity, correlation, linearity.
The sensor linear regression equation is used to convert the sensor output value in the form of actual units, namely pH. Testing is done by taking pH measurement data that still can beet value with a standard tool that is a pH meter. Data obtained from the measurement results in the form of bit values. From the results of the analysis that has been carried out obtained a linear regression equation from the pH sensor that is:
y = 0,0009x - 7,5192 (1) with R2 = 0.9965.
The accuracy value of the pH sensor is obtained in the same way as the test to determine linear regression. In this test sensor readings have been obtained with a pH unit which is then searched for error values at each test point. The results of the analysis carried out the error value obtained is 0.031% so that the accuracy value owned by the pH measuring instrument made is 99.97%.
Testing the pH value to determine the precision value is done by repeating the test data at least 3 times from each pH buffer used in the test. From the results of the analysis that has been done, the precision value possessed by the pH sensor in making measurements is 99.99%. This means that the pH sensor used has good repeatability.
Sensor sensitivity value is measured to determine the value of the sensor's reading power. The sensitivity sought is in the form of the voltage in mV that is read for a 1pH increase (mVpH). Data collection is done by reading the output voltage and pH that is read on the sensor in each measured pH buffer solution. The measurement data is then analyzed so that the sensitivity value obtained from the pH sensor used is 6.45 mV / pH.
[image:3.595.314.509.564.711.2]Correlation calculations are performed to show the relationship between the pH measured by the pH sensor (input) and the sensor output voltage value. From the calculation of correlation that has been done, it is obtained that the correlation value owned by the pH sensor is 99.89%.
From the results of the analysis of correlation values that have been done it can be seen that the pH value of the test sensor output has a good correlation with standard pH measuring devices. Good correlation is an indicator of a tool capable of providing output that is close to the standard value. Linearity states the relationship between input and output where the units of the two are already in actual units, namely pH. Input is the pH value that is read by a standard pH meter and the output is the pH that is the pH read by the pH sensor. Linearity analysis aims to find out how linear the sensor readings are against the standard device. Linearity testing can provide information about the measurement point farthest by the test sensor against the linear line.
C. Analysis of Uncertainty
[image:4.595.306.550.49.198.2]Uncertainty analysis of the pH sensor is carried out after the sensor characterization. Data retrieval for the uncertainty test is carried out 5 readings.
Fig. 8. Graph of Ph sensor uncertainty.
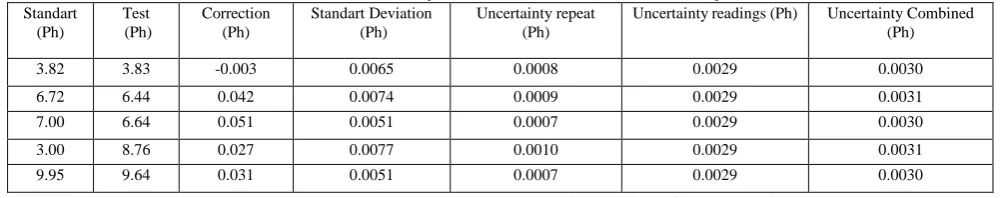
Table- I. Analysis result of Ph sensor uncertainty. Standart
(Ph)
Test (Ph)
Correction (Ph)
Standart Deviation (Ph)
Uncertainty repeat (Ph)
Uncertainty readings (Ph) Uncertainty Combined (Ph)
3.82 3.83 -0.003 0.0065 0.0008 0.0029 0.0030
6.72 6.44 0.042 0.0074 0.0009 0.0029 0.0031
7.00 6.64 0.051 0.0051 0.0007 0.0029 0.0030
3.00 8.76 0.027 0.0077 0.0010 0.0029 0.0031
9.95 9.64 0.031 0.0051 0.0007 0.0029 0.0030
The following graph is the uncertainty presented in Figure Based on the graph in Figure 9, the data analysis in Table 1 shows that the sensor readings have a good level of precision from the 4.01 buffer test value, 6.86 buffer test, 7.00 buffer test, 9.18 buffer test, and buffer 10 test. , 01. The repeatability uncertainty value decreases at the test buffer buffer with a pH concentration of 7.00 this is due to the standard deviation at the buffer testing point with a concentration of 7.00 and at a concentration of 10.01 decreases. Large standard deviations indicate that the test data points on a data overlay have values far from the data average. The results of the analysis at the buffer testing point with a concentration of pH 4.01 for the repeatability uncertainty value is 0.00088, for the combined uncertainty value that is 0.0030. The results of the analysis at the buffer testing point with a pH concentration of 6.86 for a repeatability uncertainty value of 0.00099, for a combined uncertainty value of 0.0031. The results of the analysis at the buffer testing point with a pH concentration of 7.00 for the repeatability uncertainty value is 0.00069, for the combined uncertainty value is 0.0030.
IV. CONCLUSION
Based on the results of research that has been done using the heuristic method in making the innovation of a Raspberry Pi based pH meter made by the author it can be concluded that:
1)The results of the analysis using the heuristic method that has been done show that the innovation of pH measuring instruments made has an accuracy value of 99.97%. The precision value possessed by the innovation of pH meter measuring instruments is 99.99%. The sensor sensitivity value is 6.45 mV / pH. The correlation value possessed by
the innovation of pH meters is 99.89%.
2)The results of the analysis at the buffer testing point with a concentration of Ph 4.01 for a repeatability uncertainty value of 0.00088, for a combined uncertainty value of 0.0030. The results of the analysis at the buffer testing point with a pH concentration of 6.86 for a repeatability uncertainty value of 0.00099, for a combined uncertainty value of 0.0031. The results of the analysis at the buffer testing point with a pH concentration of 7.00 for a repeatability uncertainty value of 0.00069, for a combined uncertainty value of 0.0030. The results of the analysis at the buffer testing point with a pH concentration of 9.89 for a repeatability uncertainty value of 0.0010, for a combined uncertainty value of 0.0031. The results of the analysis at the buffer testing point with a concentration of pH 10.01 for the repeatability uncertainty value is 0.00069, for the combined uncertainty value is 0.0030.
REFERENCES
1. Anjasmara, A. N.2016.Verifikasi larutan Buffer Kadaluarsa untuk Kalibrasi pH meter. Tugas Akhir. Universitas Gadjah Mada
2. Drijarkara,A.P, dan Zaid, G.2008. Metrologi:Sebuah Pengantar. Pusat Penelitian Kalibrasi, Instrumentasi dan Metrologi. LIPI. Serpong 3. Harismawan, A.F, Kharisma, A.P, dan Afirianto, T. 2018. Analisis
Perbandingan Performa Web Service Menggunakan Bahasa Pemrograman Python, PHP, dan Perl pada Client berbasis android. Jurnal Pengembangan Teknologi Informasi dan Ilmu Komputer Vol. 2, No. 1, hlm. 237 - 245.
4. KAN.2003. Komisi Akreditasi Nasional: Pedoman Evaluasi dan Pelaporan Ketidakpastian Pengukuran. Jakarta.
[image:4.595.43.546.280.379.2]6. Kurniawan, Deni,, 2008, Regresi Linier, R Developement Core Team, Austria. Maulana, Y.2006.Metrologi Industri.Skripsi. Universitas Negeri Malang.
7. Morris, Alan , 2001, Measurement and Instrumentation Principles, (Third Edition), Butterworth-Helnemann, India.
8. Murti,S.2017. Pembuatan Dan Analisis Alat Ukur Arus - Tegangan Listrik Dc Beserta Data Logger Berbasis Arduino Uno Pada Sistem Kontrol Turbin Angin PLTH Pandansimo. Tugas Akhir. Universitas Gadjah Mada.
9. Nurrishahal,Y.S.,2015.Alat Ukur pH dengan Kontroler Atmega16. Tugas Akhir. Universitas Gadjah Mada.
10. Pecsok, R. I.1951.An Experiment for the pH meter. University of California, Los Angels, California. Journal of Chemical Education 11. Perkasa, T.R, Widyantara, H, Susanto,P. 2014. Rancang Bangun
Pendeteksi Gerak menggunakan Metode Image Subtaction pada Single Board Computer (SBC). Journal of Control and network Systems Vol. 3, No. 2, hlm 90 - 97.
12. Raghavendra, N, V,, dan L, Khrisnamurthy. 2013. Engineering Metrology and Measurement. Oxford University Press. India. 13. Ramadhan., W.A.2016. Purwarupa Monitoring pH Air pada PDAM
Berbasis Arduino Uno R3. Tugas Akhir. Universitas Gadjah Mada. 14. Respati.1986. Dasar – Dasar Ilmu Kimia untuk Universitas. Aksara
Baru. Jakarta.
15. Sastrohamidjojo,H.2005. Kimia Dasar.Gadjah Mada University Press. Yogyakarta.
16. Senzas, D.V.2018. Pembuatan Kalibrator Suhu dengan Memanfaatkan Daur Ulang OHP ( Over Head Projector ) Berbasis Raspberry PI 3. Tugas Akhir. Universitas Gadjah Mada.
17. Serway,R. A, dan Jewett J. W., Jr., 2010, Physics for Scientists and Engineers with Modern Physics eight edition,BROOKS/COLE CENGAGE Learning, United State of Amerika.
18. Shidiq,M dan Panca M Rahardjo.2008.Pengukur Suhu dan pH Air Tambak Terintegrasi dengan Data Logger. Jurnal EECCIS Vol. II, No. 1. 19. Suryanto.2007.Karakterisasi Elektroda Referensi. Prosisding Pertemuan
Ilmiah Nasional Rekayasa Perangkat Nuklir. Tanggerang. 20. Sutresna,N.2006.Kimia Dasar.Grafindo: Bandung.
21. Tahir, I.2008. Arti Penting Kalibrasi Pada Proses Pengukuran Analitik : Aplikasi pada Penggunaan pH meter dan Spektrofoto meter UV – Vis. Paper Seri Manajemen Laboratorium
22. Iswanto, S. Suripto, F. Mujahid, K. T. Putra, N. P. Apriyanto, and Y. Apriani, “Energy Harvesting on Footsteps Using Piezoelectric based on Circuit LCT3588 and Boost up Converter,” Int. J. Electr. Comput. Eng., vol. 8, no. 6, 2018.
23. Iswanto, A. Maarif, O. Wahyunggoro, and A. I. Cahyadi, “Artificial Potential Field Algorithm Implementation for Quadrotor Path Planning,” Int. J. Adv. Comput. Sci. Appl., vol. 10, no. 8, pp. 575–585, 2019.
24. A. N. N. Chamim, M. E. Fawzi, I. Iswanto, R. O. Wiyagi, and R. Syahputra, “Control of Wheeled Robots with Bluetooth-Based Smartphones,” Int. J. Recent Technol. Eng., vol. 8, no. 2, pp. 6244–6247, Jul. 2019.
25. Iswanto, J. Syaftriadi, A. Nur, N. Chamim, R. O. Wiyagi, and R. Syahputra, “LED and Servo Motor Control Via Bluetooth Based on Android Applications,” Int. J. Recent Technol. Eng., vol. 8, no. 2, pp. 6227–6231, Jul. 2019.
26. K. Purwanto, Iswanto, T. K. Hariadi, and M. Y. Muhtar, “Microcontroller-based RFID, GSM and GPS for motorcycle security system,” Int. J. Adv. Comput. Sci. Appl., vol. 10, no. 3, 2019. 27. D. Hardiyanto, I. Iswanto, D. A. Sartika, and M. Rojali, “Pedestrian
Crossing Safety System at Traffic Lights based on Decision Tree Algorithm,” Int. J. Adv. Comput. Sci. Appl., vol. 10, no. 8, pp. 375–379, 2019.
28. I. Iswanto, K. Purwanto, W. Hastuti, A. Prabowo, and M. Y. Mustar, “Smart Smoking Area based on Fuzzy Decision Tree Algorithm,” Int. J. Adv. Comput. Sci. Appl., vol. 10, no. 6, pp. 500–504, 2019.
29. A. Maarif, A. I. Cahyadi, S. Herdjunanto, Iswanto, and Y. Yamamoto, “Tracking control of higher order reference signal using integrators and state feedback,” IAENG Int. J. Comput. Sci., vol. 46, no. 2, 2019. 30. Iswanto, A. Nurjanah, I. Prasojo, F. Anindiyahadi, and N. M. Raharja,
“Application of Nurse Calling Device at Sewon 1 Health Cente,” Int. J. Innov. Technol. Explor. Eng., vol. 8, no. 11, pp. 2721–2723, Sep. 2019. 31. I. Iswanto, W. S. Agustiningsih, F. Mujaahid, R. Rohmansyah, and A. Budiman, “Accumulator Charging Control with Piezoelectric Based on Fuzzy Algorithm Scheduling,” TELKOMNIKA (Telecommunication Comput. Electron. Control., vol. 16, no. 2, p. 635, Apr. 2018.
AUTHORSPROFILE
Iswanto was born in Sleman, Yogyakarta, Indonesia,
in 1981. He received the B.S degree and M.Eng degree from Universitas Gadjah Mada, Yogyakarta, Indonesia in 2007 and 2009. Now, he is on Phd Program at Universitas Gadjah Mada. He has been a Lecturer and Researcher in the Electrical Engineering Department at Universitas Muhammadiyah Yogyakarta since 2010. His current research is focused on formation control, path planning and Control UAV.
Prisma Megantoro was born in Sukoharjo, Central
Java, Indonesia, in 1991. He received the B.S degree and M.Eng degree from Universitas Gadjah Mada, Yogyakarta, Indonesia in 2014 and 2018. His current research is focused on solar photovoltaic technology, embedded system, and internet of things.
Elinda Prima Fitryana Dewi was born in Blora,