International Journal of Innovative Technology and Exploring Engineering (IJITEE) ISSN: 2278-3075, Volume-8 Issue-8, June, 2019
Abstract:Internet usage on a smartphone in India is increasing with the exponential rate because of affordable prices of smartphone and availability of unlimited data plans from mobile service providers. Simultaneously social media, YouTube, and other apps had kept people engaged in the smartphone. The smartphone improved standard of living by doing many tasks in a very short time. Mobile Banking, Newspaper, study apps, dictionary, answer to any question from Google, learning from YouTube, fitness apps, safety apps, Google maps, photo, video shooting helps every individual to become smarter. This research is focused on gender differences in the usage of the smartphone. Descriptive research methodology applied. Primary data collected from 336 college students studying in Engineering, Commerce, and Management from India through a structured questionnaire. It has been found that there is a significant relationship between gender and cost of a smartphone, data consumption and different purpose of use of a smartphone. Female students are spending more time on online shopping than male students. The findings of the research will help to understand college student’s behavior towards data consumption, which helps to formulate the strategies for the marketers, college teachers, government, parents, NGO, etc
Index Terms: College students, Gender differences, Smartphone, usage patterns
I. INTRODUCTION
The smartphone has become an inseparable part of today’s world. In recent years, policymakers in India have given top priority to the information and communication industry and have taken a number of favorable steps for development. The internet came to India in the year 1990 through some leading Internet Service Providers (ISPs). In the last two decades, the way we live and the way we work has changed due to the developments in the communication and information industries (Unsal, Ruzgar & Ruzgar,2008). The fast development of telecom infrastructure in India leads to easy access to the internet. The internet helps students as well as teachers for the study purposes, all literature regarding the use of the Internet to the year 2005 shows the benefits of using the internet in the study. Later on, the internet slowly becomes an addiction to some college students. Internet addiction, as an impulse control disorder that does not involve the use of an intoxicating drug and is very similar to pathological gambling (B. Young, 2006).Now Smartphone
Revised Manuscript Received on June 05, 2019
Malkar Vinod, Professor, Dept. of MBA, Sanjivani College of Engineering, Kopargaon, Affiliated to Savitribai Phule Pune University, Pune, India.
Bhayani Mital, Associate Professor Dept. of MBA, Sanjivani College of Engineering, Kopargaon, Affiliated to Savitribai Phule Pune University, Pune, India.
Bobade Priyanka, Assistant Professor, MBA Department , D.Y.Patil
and the 4G Internet have become an almost essential part of daily life since their rapid growth and popularity in today’s world. A nationwide survey conducted in 2010 shows that mobile phones are the most necessary medium of communication. There is the conflicting priority of young people, parents, and teachers in relation to the mobile phone device, with teachers more concerned about issues such as discipline and disturbance in the classroom and parents worried about means of contacting their children at every point in time. The entry of smartphone, the evolution of social media like Facebook, Instagram, LinkedIn, Twitter, WhatsApp, and affordable data plans, smartphone leads to excess data use which creates problems in the last five years. A famous quote of Chanakya (371 - 283 B.C) - "Everything in excess acts like a poison". Now excess use of internet causes multiple problems (Loan, 2011). The problems are found in both male and female. Now a day’s parents started providing all facility to their daughters equally with son, which is one of the reasons the percentage of girls in higher education is increasing every year. Parents are providing them hostel, smartphone all necessary things equal to sons. Male and female students differ in spending their time on the Internet. Female students spend more time on researching and gathering information for their study, and male students spend more time online playing games (Horvat, Oreski, Markic, 2014). The set of the most popular online activities is similar for both sexes, including checking e-mails, surfing or browsing the Web, and looking for news. The most significant gender difference in Internet usage patterns lies in men’s greater interest in the entertainment function of the medium (Anna Bujała,2012). There is a strong positive relationship between using the internet for educational practices such as active and collaborative learning and student-faculty interaction. (Laird and Kuh 2004). Students of business and commerce lead in using the internet for information, students of computer science use it predominantly for communication purposes and students of social sciences and humanities use it for education purposes compared to others. Information overload is the most common problem faced by students of all faculties while searching the relevant information (Loan 2011). The excessive internet usage adversely affects one’s physical health, family life and academic performance of the students. Academic problems caused by internet addiction include a decrease in study habits, drop in marks, poor attendance and poor participation in extracurricular activities. (Akhter 2013). The students spend 3 to 5 hours daily on the internet.
Gender Differences in Usage of Smartphone
Among College Students
The fact that 40% of students use the internet for nonacademic work when looked along with the time spent daily on (Limaye, G. F. 2015). Absence of gender gap in internet usage is probably due to both genders having high exposure to technology through their educational experience. (Rajasekhar P, Veena CN, Kumar S. 2018)
II. OBJECTIVESOFTHESTUDY
a)To study mobile data consumption behavior among college students.
b)To study the purpose of data consumption.
c)To study the relationship between gender with the cost of smartphone and data consumption
III. HYPOTHESES
a)There is a significant relationship between gender and the cost of a smartphone
b)There is a significant relationship between gender and mobile data consumption
c)There is a significant relationship between gender and use of smartphone for a different purpose.
d)There is a significant relationship between the age of students and data consumption
e)There is a significant relationship between the cost of smartphone and data consumption
IV. METHODOLOGY
The Primary data collected with a structured questionnaire from 336 college students of the course Engineering, BBA, MBA, B.Com from various colleges of India and data analyzed through SPSS. The data was collected in the Feb-March 2019.
V. RESULTSANDDISCUSSION
Results and Discussion
Table No. 1 Gender Frequ
ency
Perce nt
Vali d Perc
ent
Cu mul ativ e Per cen t
Val id
1. Mal e
180 53.6 53.6 53.6
2. Fem ale
156 46.4 46.4 100.
0
Total 336 100.0 100.0
(Source: Survey)
Out of 336 respondents, 180 respondents are male and 156 are female
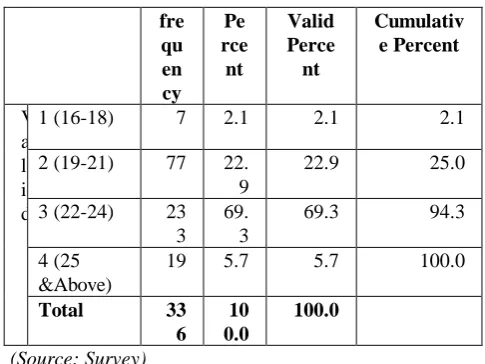
Table No.2 Age group of Respondents
fre qu en cy
Pe rce nt
Valid Perce
nt
Cumulativ e Percent
V a l i d
1 (16-18) 7 2.1 2.1 2.1
2 (19-21) 77 22.
9
22.9 25.0
3 (22-24) 23
3 69.
3
69.3 94.3
4 (25 &Above)
19 5.7 5.7 100.0
Total 33
6 10 0.0
100.0 (Source: Survey)
92% of respondents are in the age group of 19 to 24 years, in that 69% in the age group of 22-24
Table No. 3: Course Of Study fre
q
Perc ent
Valid Perce
nt
Cumulat ive Percent
V a l i d
1(Eng ineeri ng)
11 9
35.4 35.4 35.4
2 (B.Co m/BB A)
83 24.7 24.7 60.1
3 (MBA)
13 4
39.9 39.9 100.0
Total 33
6
100.0 100.0 (Source: Survey)
[image:2.595.305.548.47.229.2]119 (35.4%) respondents are from Engineering, 134 (39.9%) respondents are from MBA and 83 (24.7%) are from BBA and B.Com)
Table No. 4 Monthly Family Income Freq
uenc y
Per cent
Valid Perc
ent
Cumul ative Percen
t
V a l i d
1 (Below 15K)
17 5.1 5.1 5.1
2 (15-25K)
63 18.8 18.8 23.8
3 (25-50K)
181 53.9 53.9 77.7
4 (Above 50K)
75 22.3 22.3 100.0
Total 336 100.
0
100.0 (Source: Survey)
International Journal of Innovative Technology and Exploring Engineering (IJITEE) ISSN: 2278-3075, Volume-8 Issue-8, June, 2019
Table No. 5 User of Smartphones Fre
que ncy
Perc ent
Valid Perc
ent
Cum ulati ve Perc
ent
V al id
0 No 6 1.8 1.8 1.8
1 Yes
330 98.2 98.2 100.0
Tota l
336 100.0 100.0
(Source: Survey)
[image:3.595.53.283.62.221.2]98.2% of respondents are using a smartphone
Table No. 6.Cost of Smartphone Fre
que ncy
Per cent
Valid Perc
ent
Cum ulativ
e Perce
nt
V a l i d
1 (Below 5K)
8 2.4 2.4 2.4
2 (5-10k )
108 32.1 32.7 35.2
3 (10-15 k)
159 47.3 48.2 83.3
4 (15 Above)
55 16.4 16.7 100.0
Total 330 98.2 100.0 (Source: Survey)
47% of students are using smartphone costing in the range Rs.10000.00 to Rs. 15000.00
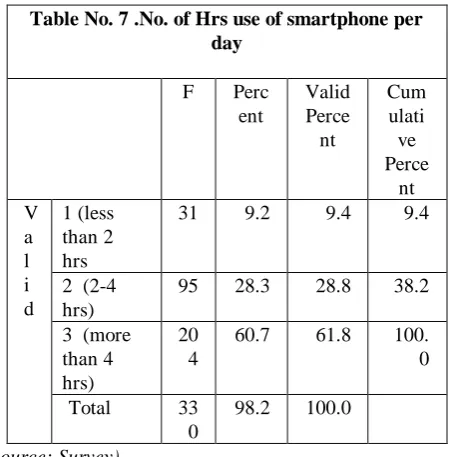
Table No. 7 .No. of Hrs use of smartphone per day
F Perc
ent
Valid Perce
nt
Cum ulati ve Perce
nt V
a l i d
1 (less than 2 hrs
31 9.2 9.4 9.4
2 (2-4 hrs)
95 28.3 28.8 38.2
3 (more than 4 hrs)
20 4
60.7 61.8 100.
0
Total 33
0
98.2 100.0
(Source: Survey)
[image:3.595.54.284.249.473.2]61% of students spending more than 4 hrs per day on a smartphone
Table No. 8 analysis of “Do you believe that YOUR use of the smartphone negatively affects
your grades”
Freq uenc y
Perc ent
Valid Percent
Cumulati ve Percent V
al id
M ay be
135 40.2 40.2 40.2
N o
105 31.3 31.3 71.4
Y es
96 28.6 28.6 100.0
To tal
336 100.
0
100.0
(Source: Survey)
28% of students agreed that their use of smartphone negatively affects the grades, while 40% of students are not sure about the use of smartphone negatively affects the grades
Hypothesis: a
There is a significant relationship between gender and the cost of a smartphone
Table No. 9 Gender and Cost of smartphone
Cost of a Smartphone Tot
al 1
(Bel ow 5K)
2 (5 K -1 0 K )
3 (1 0k -1 5k )
4 (Ab ove 15K )
G e n d e r
1 (M ale )
Count 6 45 81 46 17
8 Expect
ed Count
4.3 58
.3 85
.8
29.7 17
8.0
2 (Fe ma le)
Count 2 63 78 9 15
2 Expect
ed Count
3.7 49
.7 73
.2
25.3 15
2.0
Total Count 8 10
8 15
9
55 33
0 Expect
ed Count
8.0 10
8. 0
15 9. 0
55.0 33
0.0
(Source: Survey) Table No. 10 Chi-Square Tests
Valu e
df Asymptotic
[image:3.595.227.543.371.830.2] [image:3.595.55.284.516.744.2]Pearson Chi-Square
28.0 73a
3 .000
Likelihood Ratio 30.3 38
3 .000
Linear-by-Linear Association
15.2 76
1 .000
N of Valid Cases 330
a. 2 cells (25.0%) have expected count less than 5. The minimum expected count is 3.68.
26% Male using smartphone having cost more than Rs.15000.00 while only 6% female using smartphone price more than Rs. 15000.00,
41% of Female students use a smartphone in the range of Rs.5000-10000, while only 25% of Male uses smartphone having priced in this range.
With the above data, the alternative hypothesis “There is a significant relationship between Gender and cost of the smartphone” is accepted and null hypothesis There is no relationship between gender and cost of the hypothesis is rejected”
Hypothesis b:
[image:4.595.305.546.49.186.2]There is a significant relationship between gender and mobile data consumption
Table No. 11 Gender and Data Consumption in a day Cross-tabulation
4. Data consume in a day Total 1
Upto 500 MB
2 500M B -01G B
3 1 GB-1. 5 GB
4 Above 1.5 GB G
e n d e r
1 M a l e
Count 6 59 69 44 178 Expected
Count
8.6 60.4 73.4 35.6 178.0 % within
Gender 3.4 %
33.1% 38.8% 24.7% 100.0% % within.
Data consume in a day
37.5 %
52.7% 50.7% 66.7% 53.9%
% of Total 1.8 %
17.9% 20.9% 13.3% 53.9% 2
F e m a l e
Count 10 53 67 22 152 Expected
Count
7.4 51.6 62.6 30.4 152.0 % within
Gender 6.6 %
34.9% 44.1% 14.5% 100.0% % within
4. Data consume in a day
62.5 %
47.3% 49.3% 33.3% 46.1%
% of Total 3.0 %
16.1% 20.3% 6.7% 46.1% To
tal
Count 16 112 136 66 330 Expected
Count
16.0 112.0 136.0 66.0 330.0 % within
Gender 4.8 %
33.9% 41.2% 20.0% 100.0% % within
4. Data consume in a day
100. 0%
100.0 %
100.0 %
100.0 %
100.0%
% of Total 4.8 %
33.9% 41.2% 20.0% 100.0%
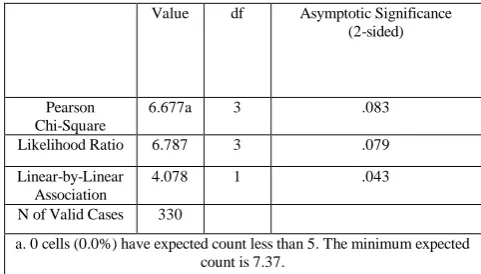
Table No. 12 Chi-Square Tests
Value df Asymptotic Significance (2-sided)
Pearson Chi-Square
6.677a 3 .083 Likelihood Ratio 6.787 3 .079 Linear-by-Linear
Association
4.078 1 .043 N of Valid Cases 330
a. 0 cells (0.0%) have expected count less than 5. The minimum expected count is 7.37.
With above data, the male students consume more data than female students so the alternative hypothesis “There is a significant relationship between Gender and data consumption” is accepted and null hypothesis There is no relationship between gender and data consumption of hypothesis is rejected”
Hypothesis c:
There is a significant relationship between gender and use of smartphone for a different purpose.
Table No. 13 Gender and Use of smartphone Cross-tabulation
Use of smartphone To
tal 1
Mu sic
2
Ne ws
3 Ga mi ng
4 (Sh opp ing
5 Socia l Medi a
6 Bro wsi ng)
G e n d e r
1 M al e
Co un t
14 12 30 7 78 37 17
8
Ex pe cte d Co un t
22. 7
15 .1
23 .7
16. 2
67.4 32.9 17
8. 0
% wi thi n Ge nd er
7.9 %
6. 7 %
16 .9 %
3.9 %
43.8 %
20.8 %
10 0. 0 %
% wi thi n Us e of sm art ph on e
33. 3%
42 .9 %
68 .2 %
23. 3%
62.4 %
60.7 %
[image:4.595.47.292.49.163.2]International Journal of Innovative Technology and Exploring Engineering (IJITEE) ISSN: 2278-3075, Volume-8 Issue-8, June, 2019
% of To tal
4.2 %
3. 6 %
9. 1 %
2.1 %
23.6 %
11.2 %
53 .9 %
2 F e m al e
Co un t
28 16 14 23 47 24 15
2
Ex pe cte d Co un t
19. 3
12 .9
20 .3
13. 8
57.6 28.1 15
2. 0
% wi thi n Ge nd er
18. 4%
10 .5 %
9. 2 %
15. 1%
30.9 %
15.8 %
10 0. 0 %
% wi thi n Us e of sm art ph on e
66. 7%
57 .1 %
31 .8 %
76. 7%
37.6 %
39.3 %
46 .1 %
% of To tal
8.5 %
4. 8 %
4. 2 %
7.0 %
14.2 %
7.3 %
46 .1 %
Total Co
un t
42 28 44 30 125 61 33
0
Ex pe cte d Co un t
42. 0
28 .0
44 .0
30. 0
125. 0
61.0 33 0. 0
% wi thi n Ge nd er
12. 7%
8. 5 %
13 .3 %
9.1 %
37.9 %
18.5 %
10 0. 0 %
% of To tal
12. 7%
8. 5 %
13 .3 %
9.1 %
37.9 %
18.5 %
10 0. 0 %
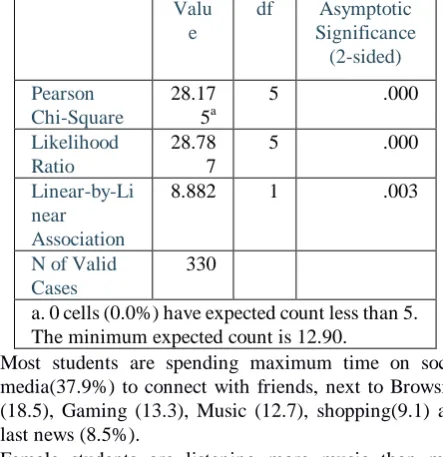
Valu e
df Asymptotic
Significance (2-sided)
Pearson Chi-Square
28.17 5a
5 .000
Likelihood Ratio
28.78 7
5 .000
Linear-by-Li near Association
8.882 1 .003
N of Valid Cases
330
a. 0 cells (0.0%) have expected count less than 5. The minimum expected count is 12.90.
Most students are spending maximum time on social media(37.9%) to connect with friends, next to Browsing (18.5), Gaming (13.3), Music (12.7), shopping(9.1) and last news (8.5%).
Female students are listening more music than male students on the smartphone.
Male students playing more games than female students on smartphone
Male students spending more time on social media than female students
Female students are spending more time on online shopping than male students
The above table shows that there is a significant positive correlation between family income and the cost of the smartphone (.328) and data consumption (.231) per day. Also, there is a positive correlation between age group and data consumption per day (.231)
There is a significant positive correlation between the cost of smartphone and data consumption (.272)
VI. CONCLUSION
[image:5.595.314.536.53.282.2]REFERENCES
1. Akhter, N. (2013). Relationship between Internet Addiction and Academic Performance among University Undergraduates. Journal of Science and Technology Education Research. 8(19), pp. 1793-1796. DOI: 10.5897/ERR2013.1539
2. Anna Bujała, Gender differences in internet usage, Acta Universitatis Lodziensis Folia Sociologica 43, 2012
3. Bavakutty and Salih. Internet Services in Calicut University. In Proceedings of the 6
th
national convention on academic libraries in the Internet era. India: Ahmedabad. 1999: 37-44.
4. Jelena Horvat, Dijana Oreski, Danijela Markic. Gender Differences in Internet Usage among Postgraduate Students, Proceedings of the ITI 2011
33rd Int. Conf. On Information Technology Interfaces, June 27-30,
2011, Cavtat, Croatia
5. Kuh, G. & Hu, S., 2001. The effects of student-faculty interaction in the 1990s. Review of Higher Education, 24(3), pp. 309-332.
6. Laird and Kuh. Students Experiences with Information Technology and their Relationship to other aspects of Students Engagement. In Annual Meeting of the Association for Institutional Research.2004.
7. Loan, F. A. (Vol. 58, June 2011). Internet use by college students across disciplines: a study. Annals of Library and Information Studies, 118-127.
8. Rajasekhar P, Veena CN, Kumar S. Gender differences in internet preferences and usage pattern among medical students. Natl J Physiol Pharm Pharmacol 2018;8(5):683-686.
9. Rewati Limaye, G. F. (Apr-Jun 2015). Use of the Internet Among Undergraduate. International Journal of Electronics & Communication Technology, 26-28.
10. Srivastava L. 2005. Mobile Phones And Evolution of Social Behavior. Behavior and Information Technology 24: 111-129.
11. UNSAL, F.; RUZGAR, N.S.; RUZGAR, B. (2008). An Empirical Study of Internet Usage, Online Shopping, and Online Banking Behaviour of
Turkish University Students. International Trade and Finance
Association Working Papers: 22. The Berkeley Electronic Press. 12. YOUNG, B. (2006). A study on the effect of Internet use and social
capital on academic performance. Journal of Development and Society, 35(1): 107-123.
AUTHORSPROFILE
Dr. Vinod R. Malkar had done B.E. (Mechanical), MBA in Marketing and Ph.D. in Management from Savitribai Phule Pune University. He is having 14 years of teaching and research experience in the area of Marketing and organization Management. He had published/ presented more than 25 research papers in various National, International journal and conferences and done projects for corporate in the area of CSR and Marketing. .
Dr. Mital Bhayani,( Ph.D. in finance, MBA Finance from SPPU, SET and NET in Management, B.Sc.)Have 9 years of experience in teaching and research. Have 12 research papers on her credit published and presented in various international and national journals, conferences and seminar.