Abstract: Various efforts to improve the welfare of the community have become the priority of government programs currently, especially in providing food by encouraging the development of the irrigation sector. The decline in water resources both in terms of quantity and quality also make a triggers the problem of water distribution when there is an imbalance between demand and supply. The desire among farmers to obtain water immediately may cause problems in how to distribute water fairly and equally. Sempor Irrigation System (5.888 ha) also deal with water distribution problems especially during the dry season. The purpose of this research is to determine the water distribution system based on water optimization therefore the irrigation performance can be measured more precisely. Meanwhile, the methodology is uses descriptive research method on fields’ irrigation research. The results of this study will be obtained a irrigation water use services model.
Keywords: irrigation system, water optimization, water use services
I. INTRODUCTION
Water and land are the urgent factors for sustainable agricultural development of a nation [1][2][3] like Indonesia that is as agricultural country. However, water availability is sometimes deficit or surplus [4] for some agricultural area. The surplus water can be used for maximizing the agricultural yield productivity so it will produce the maximum benefit. One of the methods that can be used is the optimization technique [5]. Generally, the model of optimization is a process of the best alternative option among an amount of available solution alternatives [6][7].
Indonesia is one of the largest agricultural countries in the world with a population reaching more than 200 billion in 2019 [8].
Revised Manuscript Received on September 03, 2019
* Correspondence Author
Hanugerah Purwadi*, Doctoral Program on Department of Water Resources, Faculty of Engineering, University of Brawijaya, Malang,
INDONESIA. Email: [email protected]
Lily Montarcih Limantara, Department of Water Resources, Faculty of Engineering, University of Brawijaya, Malang, INDONESIA. Email:
Ery Suhartanto, Department of Water Resources, Faculty of Engineering, University of Brawijaya, Malang, INDONESIA. Email:
Rispiningtati, Department of Water Resources, Faculty of Engineering,
University of Brawijaya, Malang, INDONESIA. Email:
Various efforts to improve the welfare of the community have become the priority of government programs, especially in providing food by encouraging the development of the irrigation sector as weel as in urban areas and rural areas. Optimal management of available surface and subsurface water sources, related to quantity and quality, is highly needed given the increasing demands, limited resources and influenced by soil salinity [9].
The impact of changes in hydrological behaviour and changes in the physiography (land use) of the land causes the changes in the pattern of water availability that is physically felt with the emergence of floods and drought that is increasingly extreme. The decline in water resources both in terms of quantity and quality also adds to the problem when there is an imbalance between demand and supply. Water scarcity is no longer just a national issue, but later in the twenty-first century will become a major global issue [10]. This tendency also affects the pattern of irrigation water availability so that more detailed management and research is needed so that the available water can be utilized optimally so that the water needs in irrigated land can be fulfilled in accordance with predetermined planting patterns.
The phenomenon of land conversion, especially in Java (as a national rice barn) is quite alarming for the sustainability of meeting food needs both on a local scale to meet the needs of these areas and on a national scale as the main buffer for national-level food needs. The affected areas are mostly productive irrigation land including technical irrigation areas, semi-technical irrigation areas and simple irrigation areas. The timeless paddy field program becomes less effective when irrigated paddy fields are occupied by a variety of interests.
To anticipate this problem the government has established a policy on irrigated land development, which is expected to increase land and water security so that the index of cropping and land productivity can increase. Empirically, agricultural lands that are most vulnerable to land conversion are irrigated rice fields. Conversion of paddy fields to non-paddy fields in Java is 4.2% per year or ± 148 thousand ha / year and this is precisely the case in many centres of food production centres [11].
In an irrigation system the problem regarding the pattern of water distribution becomes very important when the available debit is smaller than the debit needed in the framework of meeting water needs, especially during the dry season. The impact of the imbalance causes the yield to be less than the planned target. The yield of paddy fields (harvest) is influenced not only by the large number of levels of meeting water needs, but also by the way water is provided [12][13]. Therefore, the use of water
needs to be regulated and managed with the principle of justice so that its distribution
Irrigation Water Use Services Model Based on
the Water Optimization
meets the principles of on time, space, quantity and quality. According to Hansen et.al. [14], how to provide irrigation water in rice fields can be done in 5 (five) ways, namely: (1) flooding; (2) by flowing through large or small furrows; (3) by utilizing subsurface water through sub irrigation; (4) by sprinkling; and (5) through a trickle system. Of the five ways in general for rice plants carried out by flooding or using a furrows system by utilizing irrigation networks that had been planned since the beginning of development. The pattern of irrigation water supply can be done by flowing continuously (stagnant constant head) or by intermittent (intermittent flow). The selection of the water delivery pattern adjusts to the conditions of the availability of existing water sources.
The known water distribution system is carried out with a group: Director General of Irrigation Department of Public Works-KP 01 [15] states that the system of water distribution by group or technical rotation serves to reduce the time of peak irrigation water needs. The advantage of this system is that it guarantees even distribution of water obtained in irrigated lands in one planting season, but this system also provides more complex implementation consequences, namely: (1) exploitation becomes more complicated and requires patience from the user; (2) the time period for giving water to the first and second plants is longer, so that the time is shorter for the second crop; (3) the percentage of water loss due to exploitation is slightly higher; and (4) the potential for
social conflict among water users is higher between locations close to those far from the point of collection.
Various efforts have been made to increase agricultural production and reduce crop failures, such as intensification of agriculture, selection of appropriate technologies, planning of new irrigation networks, and improving irrigation water management by improving the efficiency of their use. Many technical and non-technical factors have not yet been completely identified and solutions have been found. One of the problems that often occurs in the field is the loss of water in the irrigation system, both in large-scale irrigation areas (> 1,000 ha) and small-scale (<1,000 ha), water losses occur due to percolation and surface runoff [14][16][17].
II. MATERIALS AND METHODS A. Location of Study
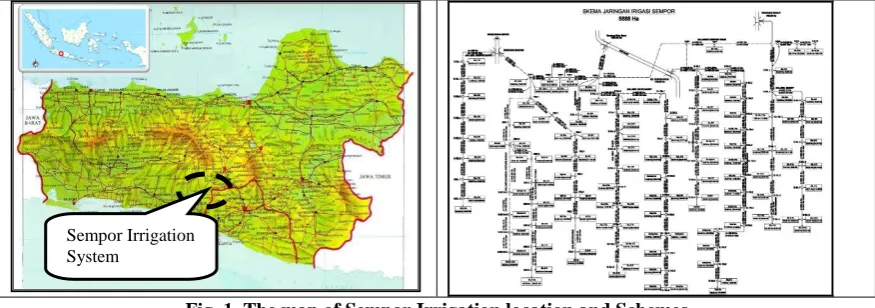
[image:2.595.79.517.395.549.2]The location of study is conducted in Sempor Irrigation System which located at southern java in Kebumen Regency. The system utilizes the availability of water from Sempor Resevoir through Bojong Weir as a regulator weir. According to existing operational procedures, the Sempor Irrigation System also obtained the water supplies from other weirs such as the Rowokawuk Weir, Watubarut Weir and Sindut Weir. The total services area in Sempor Irrigation System reaches 5,888 ha. The map of Sempor Irrigation locations and schemes is presented in the following Fig. 1.
Fig. 1. The map of Sempor Irrigation location and Schemes Source : BBWS SO Office
B. The Method of Analysis
The method of analysis this study utilises a linear programing with the purpose of getting the most optimum value between the water requirement and water availability. The principle of water supply and demand model is comparing two variables as the water is required for farming and the ability to provide water to stakeholders. The output of this method is to obtain a number from the calculation result of the ratio between the volume of water requirements for plants in an irrigation area and the volume of water that can be provided by an irrigation network.
C. Water Requirement or Demand C.1. Water Demand for Paddy Field
The amount of water needed by the plant in a paddy field terrace is represented in this equation as follow:
NFR = ETc + P + WLR – Re (1) where
NFR = water demand in the farm (mm/day), ETc = water demand of plantation (mm/day), WLR = water layer replacement (mm/day), P = percolation (mm/day),
Re = effective rainfall
C.2. Crop Water Demand
Crop water demand is the amount of water needed to replace the loss of water as a result of evapotranspiration. The amount of water plant demand (consumptive use) is counted based on this formula:
Where: Sempor Irrigation
= plant evapotranspiration (mm/day),
= plant reference evapotranspiration (mm/day),
= plant coefficient
Water demand during land preparation is calculated by V.D Goor-Zijlstra formula, as follow:
Where :
= irrigation water demand (mm/day),
= (mm/day), water
demand to replace the loss of the result =
= the duration of land preparation (day),
= the water needed for saturation is added by 50 mm D. Water Availability
D.1. Dependable Flow (Q 80%)
Dependable flow is the amount of available discharge to occupy water needs by calculates the risk of failure which possible occurs. To evaluate the dependable flow discharge is used a flow characteristic method with a dependable graph. From the graph, 80% of the discharge values are calculated for in each weir by considering the ability of the supply-discharge from the Sempor Channel. Therefore it can be known what the discharge capacity is supplied in each irrigation area. In determining the calculation of the dependable flow with an 80% probability, the Weibull Method is used, the equation can be seen as follow
Where:
= probability (%) = data sequence number = amount of data D.2. Effective Rainfall
The height of rainfall (mm) is used to determine the time of starting the first planting and to estimate the irrigation water needs in the field and to calculate the amount of effective rainfall. It is usually used the monthly rainfall data. Therefore, the effective rainfall constant / coefficient are calculated from the formula as below:
(1). The equation of daily effective rainfall for paddy plantation:
(2). The equation of daily effective rainfall for palawija (soybean) :
D.3. K-Factor
The K-factor is a comparison between water requirements and water availability. The guidelines for determining parameters refer to the Criteria for Public Works Plans (KP-01). Analysis of calculations using the data such as rainfall, climatology (wind velocity, temperature, air humidity), water discharge availability, reports on plant conditions, and crop production.
Where:
= available outflow debit
= outflow debit needed
E. Water Optimization
Optimization model is the preparation of a system that accordance with the real situation, which ater could be converted into a mathematical model by separating the main elements furthermore a solution in accordance with the goals or objectives of decision can be achieved [18]
The mathematical model used to describe a linear programming problem using the following equation [19]: Purpose Function:
Z = C1X1 + C2X2 + C3X3 + ... + CnXn (8) Constraint Function:
1) a11X1 + a12X2 + a13X3 + ... + a1nXn <b1 (9) 2) a21X1 + a22X2 + a23X3 + ... + a2nXn <b2 (10) m) am1X1 + am2X2 + am3X3 + ... + amnXn <bm (11) and
X1 e ”0, X2 e” 0, ..., Xn e ”0 (12)
III. RESULTS AND DISCUSSION A. Hydrology Data
Analysis result of data has obtained 10 years of influential daily rainfall data in the Sempor irrigation area. These data are summarized into monthly data which required obtaining effective rainfall for use in hydrological calculations. The rainfall data was obtained from 6 rain gauge stations that spreading in Sempor Catchment Area such as: Karanganyar Rainfall Station, Adimulyo Rainfall Station, Rowokawuk Rainfall Station, Gombong Rainfall Station, Kuwarasan Rainfall Station and Sempor Rainfall Station, as presented in Fig. 2 as below. From the figure 2 indicates that rainfall began to fall spread throughout Sempor Irrigation Area evenly at the beginning of October to reach its peak from January to May.
.
Fig. 2. Monthly Rainfall of Sempor Catchment Area Source: Analysis Result
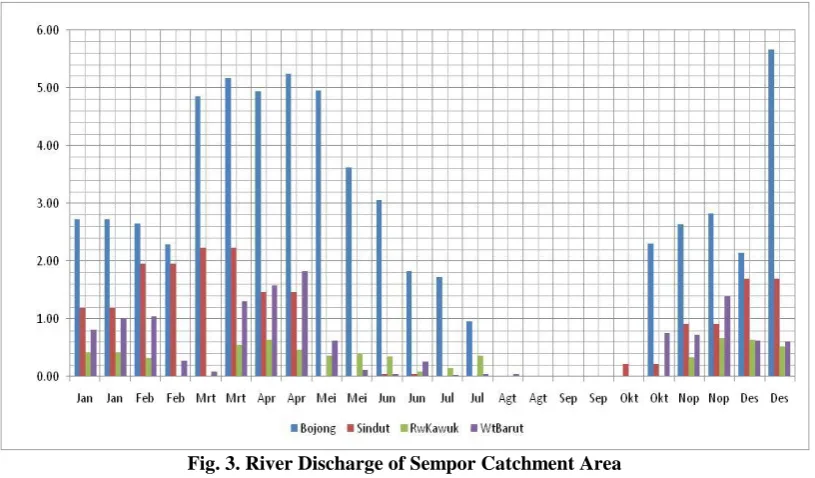
Even though the results of the rainfall data analysis show that in the month of October rain began to fall evenly, it has not been able to produce a sufficient river discharge to pioneer all irrigation land in Sempor. In Fig. 3 illustrates the half-monthly average discharge recorded at Bojong weir,
Watubarut weir, Rowokawuk weir and Sindut weir. The graph shows that the discharge on the river began in mid-October. This happens because more rainwater that falls to the earth is infiltrated into the ground rather than becoming a surface flow.
Fig. 3. River Discharge of Sempor Catchment Area Source: Analysis Result
B. Water Availability and Water Requirement Condition In order to fulfil the water needs in irrigation area especially during the dry season, the guidelines for operating patterns are needed. Water supply from the Sempor reservoir used to irrigate the Sempor Irrigation Area is needed when the weirs suffer from water shortages. There are two categories of
water shortage problems in Sempor Irrigation Area, such as: 1) real conditions where no water is available at the weir and 2) water is available in the field but is not sufficient to meet crop water needs according to
[image:4.595.95.503.452.691.2]water optimization is calculated based on the conditions of growing season.
B.1. Existing Condition
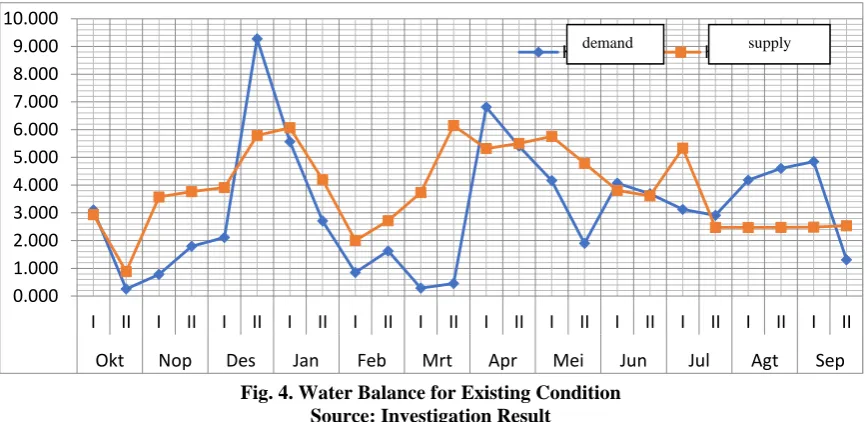
In accordance with existing conditions in the Sempor Irrigation Area there is water deficit in the several months, such as December, April, August and September. During those months the need for water was increased to be used for land preparation and for wetting the soil furthermore salinity
was maintained. Meanwhile on the other side the availability of water was relatively constant. The deficit condition is exacerbated by the behaviour of farmers who are not use water efficiently. Farmers are over used or wasteful in the use of water in their land consequently water wasted into the drainage channels automatically. The existing condition can see as in the Fig. 4 and Table- I.
0.000 1.000 2.000 3.000 4.000 5.000 6.000 7.000 8.000 9.000 10.000
I II I II I II I II I II I II I II I II I II I II I II I II
Okt Nop Des Jan Feb Mrt Apr Mei Jun Jul Agt Sep
[image:5.595.82.515.156.367.2]Kebutuhan Ketersediaan
Fig. 4. Water Balance for Existing Condition Source: Investigation Result
Table- I. Irrigation Performance Factor in the existing Sempor irrigation area
Sub Irrigation Area
Total area
Irrigated Area
Volume of Water Requirement
Volume of Water Availibility
Irrigation Perfomance
Factor
Ha ha m3 m3 %
Bojong Irr. Area 2,599 1,223 34,836,012 16,389,065 47.05
Watubarut Irr. Area 1,627 551 21,807,692 7,386,206 33.87
Sindut Irr. Area 916 341 12,277,717 4,569,188 37.22
Rowokawuk Irr. Area 746 208 9,999,102 2,784,319 27.85
Total 5,888 2,322 78,920,523 31,128,778 36.49
B.2. Water Optimization
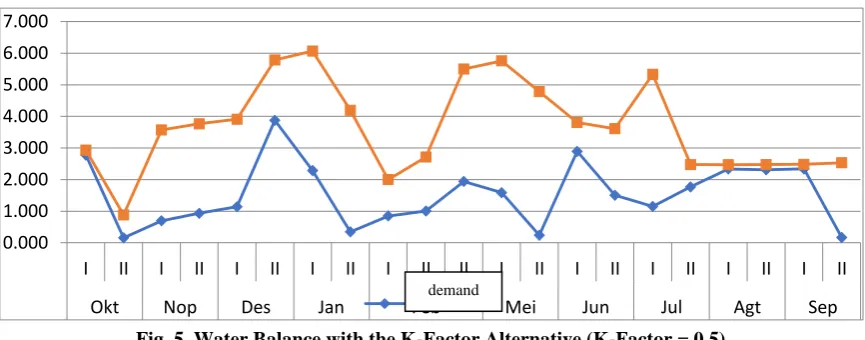
From the calculation of water optimization, the following results as follows: 1) The simulation using a K-factor = 0.5 (Fig. 5) shows that the irrigation performance factor is 97% (Table- II). This means that almost the farmland in the Sempor Irrigation System receives water evenly; 2) Simulations using K-factor = 0.7 (figure 6), the results of the irrigation perfomance factor are 75.81% (table 3). Most of the irrigate farmland area is allocated in the upstream in the sub irrigation Bojong. Meanwhile sub irrigation Watubarut obtaining water by 68.77%. It shows that the availability of
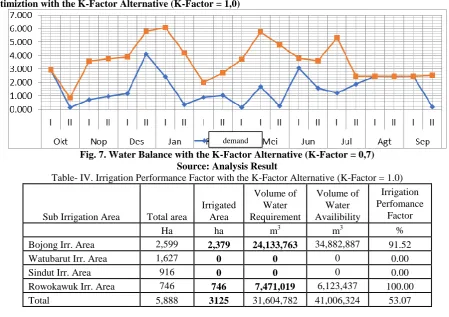
water began to decrease because it was already used in the sub irrigation above. For the smallest area of farmland which is sub irrigation rowokawuk can still be irrigated by 100%. However, in the Sindut irrigation sub-area, there was no water available therefore the irrigated land could not be utilized; and 3) Simulation using the K-factor = 1.0 (Fig. 7) obtained the results of the irrigation performance factor of 53% (Table- IV). The water is only sufficient to irrigate the smallest irrigated land, namely rowokawuk sub irrigation, while the other two sub irrigation systems do not obtain water
1. Optimization with the K-Factor Alternative (K-Factor = 0.5)
0.000 1.000 2.000 3.000 4.000 5.000 6.000 7.000
I II I II I II I II I II II I II I II I II I II I II
[image:6.595.82.515.62.232.2]Okt Nop Des Jan KebutuhanFeb Mei Jun Jul Agt Sep
[image:6.595.82.527.258.810.2]Fig. 5. Water Balance with the K-Factor Alternative (K-Factor = 0.5) Source: Analysis Result
Table- II. Irrigation Performance Factor with the K-Factor Alternative (K-Factor = 0.5)
Sub Irrigation Area
Total area
Irrigated Area
Volume of Water Requirement
Volume of Water Availibility
Irrigation Perfomance
Factor
Ha ha m3 m3 %
Bojong Irr. Area 2,599 2,599 20,562,428 27,792,509 100.00
Watubarut Irr. Area 1,627 1,627 12,872,285 12,525,496 97.31
Sindut Irr. Area 916 916 7,651,394 9,458,173 100.00
Rowokawuk Irr. Area 746 746 5,902,105 4,721,637 80.00
Total 5,888 5888 46,988,212 54,497,815 94.33
2. Optimiztion with the K-Factor Alternative (K-Factor = 0,7)
0.000 1.000 2.000 3.000 4.000 5.000 6.000 7.000
I II I II I II I II I II I II I II I II I II I II I II I II
Okt Nop Des Jan Feb Mrt Apr Mei Jun Jul Agt Sep
Kebutuhan Ketersediaan
Fig. 6. Water Balance with the K-Factor Alternative (K-Factor = 0.7) Source: Analysis Result
Table- III. Irrigation Performance Factor with the K-Factor Alternative (K-Factor = 0.7)
Sub Irrigation Area
Total area
Irrigated Area
Volume of Water Requirement
Volume of Water Availibility
Irrigation Performance
Factor
Ha ha m3 m3 %
Bojong Irr. Area 2,599 2,599 26,028,389 30,581,856 100.00
Watubarut Irr. Area 1,627 1,119 11,650,280 12,404,470 68.77
Sindut Irr. Area 916 0 0 0 0.00
Rowokawuk Irr. Area 746 746 7,471,019 5,195,516 100.00
Total 5,888 4464 45,149,688 48,181,841 75.81
demand
3. Optimiztion with the K-Factor Alternative (K-Factor = 1,0)
Fig. 7. Water Balance with the K-Factor Alternative (K-Factor = 0,7) Source: Analysis Result
Table- IV. Irrigation Performance Factor with the K-Factor Alternative (K-Factor = 1.0)
Sub Irrigation Area Total area
Irrigated Area
Volume of Water Requirement
Volume of Water Availibility
Irrigation Perfomance
Factor
Ha ha m3 m3 %
Bojong Irr. Area 2,599 2,379 24,133,763 34,882,887 91.52
Watubarut Irr. Area 1,627 0 0 0 0.00
Sindut Irr. Area 916 0 0 0 0.00
Rowokawuk Irr. Area 746 746 7,471,019 6,123,437 100.00
Total 5,888 3125 31,604,782 41,006,324 53.07
4. CONCLUSION
During the dry season, the pattern of operations for weirs is very necessary for the purposes of water distribution in a fairly, equitable and timely. The pattern of water supply with factor-K = 0.70 and factor-K = 1.0 indicates that the volume of water is insufficient to face cropping needs and if it has been applied irrigation performance is less than 100%. While giving irrigated water more than specified can result water shortages in the following months, therefore the intensity of planting cropping cannot reach 300% in one year. Water optimization is needed if there is a decreasing water availability while the demand for water for plantations increasing or is relatively constant.
REFERENCES
1. S. Osama, M. Elkholy, and R.M. Kansoh, “Optimization of the
cropping pattern in Egypt”, Alexandria Engineering Journal, 2017: 3-8, www.sciencedirect.com
2. L.M. Limantara, M. Bisri, and F. Risq, “Optimization of water usage at irrigation area of Pakis-Malang regency-Indonesia by using linear programming”, International Journal of Engineering & Technology, 7(4), 2018, pp. 6432-6436
3. P.T. Juwono, L.M. Limantara, and F. Rosiadi, “Optimization of
irrigation cropping pattern by using linear programming: Case study on irrigation area of Parsanga, Madura Island, Indonesia”, Journal of Water and Land Development. No. 39, 2018, p. 51–60. DOI: 10.2478/jwld-2018-0058.
4. L.M. Limantara, Suhardjono, Rispiningtati, S.F. Jadfan, and N.
Secillia, “Water economic value of fresh water system in the Tanggunggunung village Indonesia”, International Journal of Geomate, Vol. 15, Issue 50, 2018, pp. 113-120
5. M.T. Sattari, K. Saleyman, and O. Fazli, “Application of deterministic mathematical method in optimizing The small irrigation reservoir capacity”. Journal of Akdeniz Universitesi Ziraat Fakoltesi Dergisi (2000), 19(2): page 261-267
6. B. Pavoni, A. Voinov. and N. Zhavora, “Basin (Watershed) approach
as a methodological basis for regional decision making and
management in the EX USSR”, Published on line in
http://helios.unive.it/%7Eintas/gaboart.htm1. March 12, 2001. 7. W. Soetopo, “Model-Model simulasi stokastik untuk sistem sumber
daya sir (Stochastic simulation model for water resources)”, CV Citra Malang, 2012.
8. Badan Pusat Statistik, “Buku Kependudukan”, 2019
9. Y. Erdem, and A. Yüksel, “Yield response of watermelon to irrigation
shortage”, Scientia Hort., 98, 2003, 365383.
10. D. Seckler, “The New Era of Water Resources Management:
From“Dry”to“Wet” WaterSavings. International Irrigation
Management Institute (IIMI), Colombo, 1996.
11. M. Muqorrobin, W. Utaminigsih, and D. Agustina, “Fenomena alih fungsi lahan irigasi terhadap produksi padi di Pulau Jawa” Prosiding
Kolokium Puslitbang Sumber Daya Air 2013, Bandung: Pusat
Penelitian dan Pengembangan Sumber Daya Air, Badan Penelitian dan Pengembangan, Kementerian Pekerjaan Umum, 2013.
12. H. Penman, “Natural evaporation from open water, bare soil and grass”, P. Roy. Soc. A Math. Phy, 193, 1948:120-146.
13. T. Erdem, Y. Erdem, H. Orta, and H. Okursoy, “Water-Yield
Relationships of Potato under Different Irrigation Methods and Regimens”, Journal of Science and Agriculture, 2006. 226-231. 14. V. Hansen, W. Israelen, and G. Stringham, “Irrigation Principles and
Practices”, 1979
15. Direktorat Sumber Daya Air. “Standar Perencanaan Irigasi, Kriteria
Perencanaan (KP 01); Bagian Perencanaan Jaringan Irigasi”, Jakarta: Kementerian Pekerjaan Umum, 2013.
16. J. Doorenbos and W. Pruitt, “Guidelines For Predicting Crop Water Requirements”, 1977.
17. A> Sapei, “Kajian Penurunan Laju Perkolasi Lahan Sawah Baru Dengan Lapisan Kedap Buatan (Artificial Impervious Layer)”, Prosiding Seminar Nasional Teknik Pertanian, (pp. 1-39), 2000.
18. L.M. Limantara and W. Soetopo, “Manajemen sumberdaya air”, CV
Lubuk Agung, Bandung, 2011.
19. Balai Besar Wilayah Sungai Serayu Opak, “Sempor Irrigation
AUTHORSPROFILE
Hanugerah Purwadi, Dostoral Program on Department of Water Resources, Faculty of Engineering, University of Brawijaya, Malang, INDONESIA. Email:
Lily Montarcih Limantara. Lecturer on the Department of Water Resources, Faculty of Engineering, University of
Brawijaya, malang, INDONESIA. Email:
Ery Suhartanto. Lecturer on the Department of Water Resources, Faculty of Engineering, University of Brawijaya, malang, INDONESIA. Email:
Rispiningtati. Lecturer on the Department of Water Resources, Faculty of Engineering, University of Brawijaya, malang, INDONESIA. Email: