Abstract— Now a days spindles caused by drowsiness and it has become a very serious issue to accidents. A constant and long driving makes the human brain to a transient state between sleepy and awake. In this BCI plays a major role, where the captured signals from brain neurons are transferred to a computer device. In this paper, I considered the data which are collected from single Electroencephalography (EEG) using Brain Computer Interface (BCI) from the electrodes C3-A1 and C4-A1.Generally these sleepy spindles are present in the theta waves, whose are slower and high amplitude when compared to Alpha and Beta waves and the frequency in ranges from 4 – 8 Hz. The aim of this paper to analyse the accuracy of different machine learning algorithms to identify the spindles.
Index Terms: Electroencephalography (EEG), Brain Computer Interface (BCI), Wavelet Transform, Fast Fourier Transform (FFT), Support Vector Machines (SVM), Neural Networks (NN), Random Forest (RF), Gaussian Naïve Bayes (GNB), K-nearest neighbour (K-NN)
I. INTRODUCTION
Spindles are caused while the human is in sleeping or in drowsiness .This state of behaviour is identified by the physical activities of the human like rapid eye blinking or full eye closing. This will make big accidents in driving. So, our proposed work is we are analysing the mental activity of human brain by using Electroencephalography (EEG) signals based on Brain Computer Interface (BCI) technology. Here I am analysing performances of different classification technique on the EEG signal. The signal is extracted from single channel EEG from C3-A1 and C4-A1 electrodes.
II. LITERATURE SURVEY
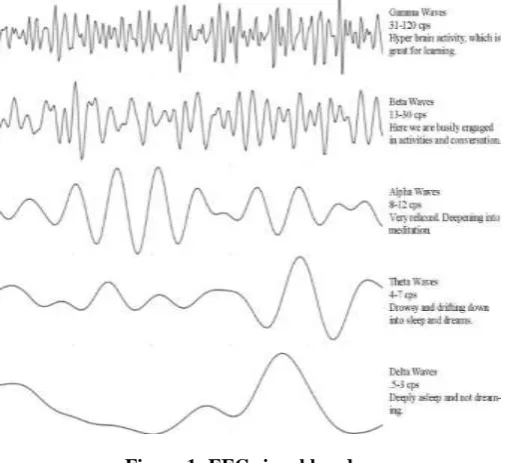
Drowsiness can be detected from other technologies like image processing. But our proposed way of detection is very efficient because here we directly extracted the brain signals to examine the driver state of the emotion. Here the main challenge is how to identify the driver drowsiness state of emotion. EEG has various frequency bands called theta, delta,balpha, beta and gamma. Figure: 1 shows a few examples of the brain waves frequencies and corresponding human brain state of emotion.
In [12]M.Murali, Varun Pathak, Manish Sen proposed using of Level splitter section(LSS) to analyses the level of
Revised Manuscript Received on July 18, 2019.
HemaLatha Goli, Research Scholar, Dept. of CSE, Acharya Nagarjuna University & Assistant Professor ,KKR & KSR Institute of Technology & Sciences, Guntur, A.P, India.(E-mail:[email protected])
state of emotion of the driver and gives alert and keep the vehicle in self-controlled functioning mode until awaken state .
In [13] A. Garces Correa and E. Laciar Leber proposed a method by combining best features extracted from power Spectral Density (PSD) and Wavelet Transform (WT). He used NN for classifying the extracted features.
[image:1.595.305.558.466.697.2]In 2009 A. Garcés Correa, P Diez , E Laciar proposed the work that the results obtained by considering the parameter metrics like Median, the 1st quartile frequency, the Max frequency, the power values from Alpha and Theta bands and he got drowsiness detection with 73.6% of accuracy. Adding new features (ZC and IEEG) and classifying the data with NNs the results improved to 84.1 %. In [18] Pai-Yuan Tsai; Weichih Hu; Kuo, T.B.J.; Liang-Yu Shyu proposed a model of detection accuracy 90.9 % when the subjects were drowsy which is higher than the accuracy 79.1% when the subjects were alert. Here my proposal produce accuracy 98.45% of detecting drowsiness by extracting brain signals from C3-A1 and C4-A1 using BCI. ANN – MLP (Multi-Layer Perceptron) with 2 layers of 100 neuron each and 10 epochs for forward pass and backward pass.
Figure 1: EEG signal bands
Performance Research on different Machine
Learning Algorithms for Detection of Sleepy
Spindles from EEG signals
III. THEORETICAL CONSIDERATIONS In this section, we discuss some of the related theoretical concepts.
A. EEG Signals
EEG is a non-invasive method to record electrical signals of the brain from the scalp. EEG records the signals which are continuous electrical activity from the brain surface by arranging the electrodes on the scalp or outer surface of the head [1]. Much of the time, the brain waves are irregular, and no specific pattern can be discerned in the EEG. The EEG signals are commonly decomposed into five EEG signal bands based on the frequencies: delta, theta, alpha and beta. Figure: 1 shows a few examples of the brain waves. Beta waves represents arousal state of human brain. These are relatively low amplitude and high frequency of all the brain waves. Their frequency ranges from 12 to 40 Hz’s (cycles per second) and usually has a low voltage between 5 and 30 μV. A person who is in fully engaged mind is in Beta state i.e. talking, debating, speech..etc. Alpha wave represents non-arousal state. These are slower and high at amplitude when compared to beta waves. Their amplitude ranges from 8 to 12 Hz (cycles per second) with 30–50 μV amplitude. A person is awaken and taking rest after done with any work/task is in Alpha state .Examples – A person takes a break form a speech/lecture, A person walks in the ground is also in alpha state . Theta waves are slower and high at amplitude compared to alpha and beta waves. Their frequency ranges from 4 to 8 Hz (cycles per second and 20 μ V amplitude. A person who takes time off from any work and begins today sleep or in drowsy is in Theta state. A person in sleep/dream sleep with little bit conscious or idle state like driving in freeways or repetition nature of driving compared to city road driving with traffic. Delta waves are the final state of the human. Delta waves are high amplitude and very slow when compared to alpha and theta waves. Their frequency ranges below 4Hz (cycles per second). The frequency never goes to zero, means the brain is dead. A person who is in deep sleep /dreamless sleep is in delta state.
B. BCI
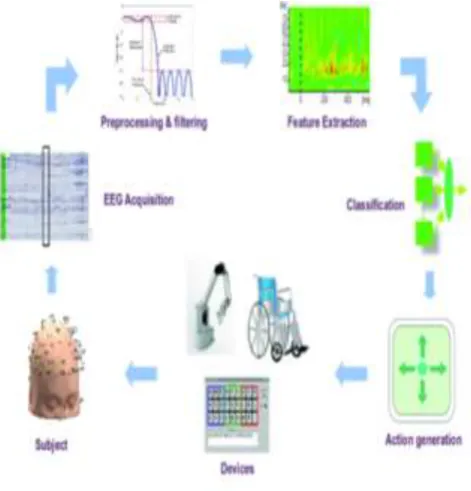
[image:2.595.309.545.50.296.2]BCI is an AI system that can recognize patterns from the brain signals. BCI system working has 5 consecutive stages.1) Signal acquisition – Capture brain activity and may also perform noise reduction and artefact processing.2) Pre-processing or filtering – It prepares the signal in a suitable form for further processing. 3) Feature Extraction – It identifies the discriminate features as vector from the processed signals. 4) Classification- It classifies the brain signals by taking Feature vectors into account. 5) Control interface – Finally it translate the classified signals into commands for the connected devices.
Figure 2: BCI block Diagram
C. Pre-processing
In general real world databases are highly susceptible to noise, missing and inconsistent data due to huge size and also include artefacts, nothing but unwanted patterns which are caused by some unintentional actions like eye moments, muscle movements, jaw movements & also due to electrical field changes. The main objective of preprocessing EEG signal is identifying and removal of artefacts. Here we identify these artefacts from EEG signal based on their frequencies only. Generally artefacts have high frequencies. Especially to remove muscle related artefacts by using frequency selection filters like band-pass, band-stop, low-pass and high-low-pass filters [4].
D. Feature extraction
Based on the size of the dataset there are large number of features are available, but among these some of the features only required for our data analysis. These subset of features were selected from the large no. of available features are done by the feature extraction techniques.
Time–frequency features
Time–frequency analysis is very efficient tool, which allows decomposing the EEG signal into both frequency and time directions [5]. It provides a way to analyze non-stationary signals like sleep EEG signals. It allows analyzing the EEG signal frequency with time. This is very useful while analyzing the sleepy signals because it includes sudden changes in amplitude and frequency characteristics.
Some time – frequency methods which are commonly used to analyze sleepy signals are:
1. The wavelet transform
4. Empirical mode decomposition (EMD)
E. Classification
The output set of features of feature extraction is considered while designing a model. Here classification techniques are considered for designing a model. After extracting the features then grouped as vector and assigning a class label based on the similarities. Any classification technique output can be a class label only.
i. Neural network (NN) classification - Multilayer perceptron (MLP)
MLP is also a supervised classification techniques and also mathematical models which works based on the working principle of the neurons in the brain. It is very efficient classifier to modeling complex nonlinear systems [6].
ANN consists of following components [7][8][9] 1. Input
2. Hidden layers with arbitrary count 3. An o/p layer
4. A set of weights & biases between each hidden layer with symbols w & b
5. A choice of activation functions for each hidden layer.
When counting the No. Of layers you have to exclude the Input layer. Each training process is iteration of the following steps:
1. Calculating the predicted output - feed forward 2. Updating weights & bias – back propagation. In Multilayer Perceptron, perceptron is the basic building block and a single layer feed forward neural network.
Figure 3: Fully connected neural network Where w1,w2,… wn are the random weights and is the
activation function to measure the calculated output and compared with the actual value by using cost/loss function.
Based on the cost function value, back propagation is done to reduce the loss by adjusting the random weights.
ii. KNN
The K-nearest neighbor algorithm is one of the simplest
with all the other training tuples. The n attributes are used to describe all the training tuples. In n-dimensional space each point represents each tuple. In this way all the training tuples are stored in an n-dimensional pattern space. When a unknown tuple is given, the k-nearest neighbor classifier searches for K closest training tuple to the unknown tuple. Closeness is measured in terms of distance metric such as Euclidean distance.
The formula to measure distance between two tuples as p=(p1,p2,….,pn) and q=(q1,q2……,qn) is
After measuring the distance between test tuple with all the training tuples, it finalize the most common class among all its K-nearest neighbors. Suppose when K=1, the classifier assigns the class of the training tuple that is closest to it in the pattern space.
iii. Random Forest
Random forest is also a supervised classification methodology which combines the multiple algorithms of same type to form a powerful prediction model i.e. multiple decision trees. It works by generating multiple decision trees and fit a model by giving each training object to every tree and assigns the class label, which more no. of trees
produce as a result.
iv. GaussianNB
Naive Bayes classifiers are the statistical classifiers. They predict the class label based on the probability of the given tuple that belongs to a particular class. Naïve Bayes classifier works base on the principle of Bayes’ theorem with the conditional independence assumption and the formula to predict the class is
Where Y is the class label and X1, X2,…Xn are the
independent features.
Using the naive conditional independence assumption that P (Xi|Y, X1, X2,…..Xi-1,Xi+1,…Xn) = P(Xi|Y)
The class conditional probability is calculated through
IV. RESULTS
Generally sleepy spindles are present in the Theta waves, whose are slower and high amplitude when compared to Alpha and Beta waves and the frequency in ranges from 4 – 8 Hz.
A. Data
I considered the data which are collected from single Electroencephalography (EEG) using Brain Computer Interface (BCI) from the electrodes C3-A1, O1-A1, C4-A1 and O2-A1. Data set contains 251038 instances and 10 attributes.
Figure 4: International 10-20 system based Electrode arrangement over scalp. a) As seen from left side. b) As
seen from top
[image:4.595.320.548.55.266.2]The EEG signal data set with the sampling frequency 250Hz. Fig.4. illustrates the arrangement of electrodes arrangement on basis of 10 -20 international system.
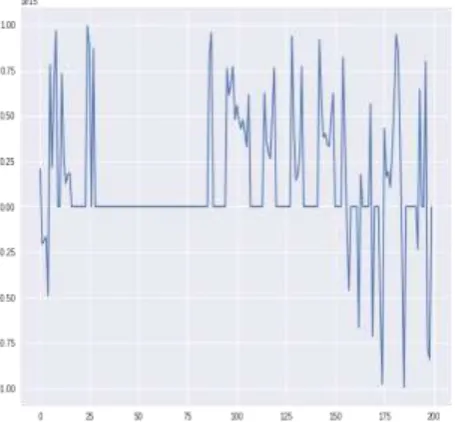
Figure 5: Theta signals from EEG C3-A1 electrode
Figure 6: Sleepy spindles from EEG C3-A1 electrode B. Performance evaluation
[image:4.595.55.294.198.385.2]Accuracy, precision and sensitivity or recall are the statistical measures to evaluate the performance of any binary classifier. All possible outcomes of a classifier is represented in the form of Confusion matrix as shown is a Fig.6
Figure 7: Confusion Matrix
Accuracy is the proportion of the positive results in the dataset.
Precision measures the ability of the classifier not to lable as positive if sample that is negative .
[image:4.595.318.533.389.549.2] [image:4.595.60.300.475.699.2]NN-MLP result:
If I consider 2 layers MLP with 100 neurons in each and 10 epochs while fitting the model then the result in accuracy is: 98.46 %
K-NN result:
Confusion matrix is [62102 0] [ 62 596]
Statistical measures are:
Precision recall 0 1.00 1.00 1 1.00 0.91 Accuracy: 99.9%
Random forest result:
Confusion matrix is [62102 0] [ 345 313]
Statistical measures are:
Precision recall 0 0.99 1.00 1 1.00 0.48 Accuracy: 99.45%
Gaussian NB result:
Confusion matrix is [62102 0] [ 345 313]
Statistical measures are:
precision recall 0 0.99 1.00 1 1.00 0.48 Accuracy:99.45%
All the analyzed classifiers performance is shown in Table1.
Classifier Accuracy
NN-MLP 98.46 %
K-NN 99.90%
RF 99.45%
NB 99.45%
Table 1: Performance analysis
V. CONCLUSION AND FUTURE SCOPE In this we utilize electroencephalography (EEG) signals using Brain computer Interface (BCI). Generally these sleepy spindles are present in the theta waves, whose are slower and high amplitude when compared to Alpha and Beta waves and the frequency in ranges from 4 – 8 Hz. Here we analyses the performances of different supervised classification methodologies. Among all these classifiers K-Nearest Neighbor (K-NN) classifier gives highest accuracy 99.90% when compared to Neural Networks, Random Forest, Gaussian Naïve Bayes classifiers. In future we directly identify the spindles from the theta waves instead of combining theta and spindles separately and also try to use
REFERENCES
1. J. P. Varghese, “Analysis of EEG Signals For EEG-based
Brain-Computer Interface,” School of Innovation, Design and Technology, Malardalen University, Vasteras, Sweden,2009
2. P. Anderer, S. Roberts, A. Schlogl, G. Gruber, G.
Klosch, W. Herrmann, P. Rappelsberger, O. Filz, M.J. Barbanoj, G. Dorffner, B. Saletu, Artefact processing in computerized analysis of sleep EEG – a review, Neuropsychobiology 40 (1999) 150–157.
3. E. Walls-Esquivel, M.F. Vecchierini, C. Heberle, F.
Wallois, Electroencephalography (EEG) recording
techniques and artefact detection in early premature babies, Clin. Neurophysiol. 37 (2007) 299–309.
4. D.P. Brunner, R.C. Vasko, C.S. Detka, J.P. Monahan,
C.F. Reynolds, D.J. Kupfer, Muscle artefacts in the sleep EEG: automated detection and effect on all-night EEG power spectra, J. Sleep Res. 5 (1996) 155–164.
5. L. Cohen, Time–Frequency Analysis, Prentice-Hall, New
Jersey, 1995.
6. D. Balakrishnan, S. Puthusserypady, Multilayer
perceptron’s for the classification of brain computer interface data, in: Bioengineering Conference, 2005. Proceedings of the IEEE 31st Annual Northeast, 2005, pp. 118–119.
7. C.M. Bishop, Neural Networks for Pattern Recognition,
Oxford University Press, Inc., 1995.
8. [8]S.Haykin, Neural Networks: A Comprehensive
Foundation, Prentice Hall PTR, 1994.
9. T.M. Mitchell, Machine learning and data mining,
Commun. ACM 42 (1999) 30–36
10. S.P. Cho, H.S. Choi, H.K. Lee, K.J. Lee, Detection of
EEG arousals in patients with respiratory sleep disorder, in: S.I. Kim, T.S. Suh (Eds.), World Congress on Medical Physics and Biomedical Engineering 2006, vol. 14, Pts 1–6, SpringerVerlag, Berlin, 2007, pp. 1131– 1134.
11. T. J. Sullivan, S. R. Deiss, J. Tzyy-Ping and G.
Cauwenberghs, “A Brain-Machine Interface Using Dry-Contact, Low-Noise EEG Sensors,” IEEE International Symposium on Circuits and Systems, Seattle, 18-21 May 2008, pp. 1986-1989. [Citation Time(s):1]
12. M.Murali, Varun Pathak, Manish Sen, “Driver
Drowsiness Detection Using Brain Computer Interface”, Volume 118 No. 20 2018, 945-949, ISSN: 1314-3395.
13. A. Garces Correa and E. Laciar Leber, “An automatic
detector of drowsiness based on spectral analysis and wavelet decomposition of eeg records,” in Engineering in Medicine and Biology Society (EMBC), 2010 Annual International Conference of the IEEE. IEEE, 2010, pp. 1405–1408.
14. G. Correa, L. Orosco, and E. Laciar, “Automatic
detection of drowsiness in eeg records based on multimodal analysis,” Medical engineering & physics, vol. 36, no. 2, pp. 244–249, 2014.
15. S. Yu, P. Li, H. Lin, E. Rohani, G. Choi, B. Shao, and Q.
Wang, “Support vector machine based detection of drowsiness using minimum eeg features,” in Social
Computing (SocialCom), 2013 International
Conferenceon. IEEE, 2013, pp. 827–835.
16. AzimEskandarian, Ali Mortazavi, ”Evaluation of a Smart
Detection”, in IEEE Intelligent Vehicles Symposium Istanbul, Turkey, June 13-15, 2007.
17. Antoine Picot, Sylvie Char bonnier and Alice Caplier,
“On-Line Automatic Detection of DriverDrowsiness Using a Single electroencephalographic Channel”, in 30th Annual International IEEE EMBSConference Vancouver, British Columbia, Canada, August20-24, 2008.
18. Pai-Yuan Tsai; Weichih Hu; Kuo, T.B.J.; Liang-Yu