A mathematical framework to
determine the temporal sequence
of somatic genetic events in cancer
The Harvard community has made this
article openly available.
Please share
how
this access benefits you. Your story matters
Citation
Attolini, Camille Stephan-Otto, Yu-Kang Cheng, Rameen Beroukhim,
Gad Getz, Omar Abdel-Wahab, Ross L. Levine, Ingo K. Mellinghoff,
and Franziska Michor. 2010. “A Mathematical Framework to
Determine the Temporal Sequence of Somatic Genetic Events in
Cancer.” Proceedings of the National Academy of Sciences 107 (41):
17604–9. https://doi.org/10.1073/pnas.1009117107.
Citable link
http://nrs.harvard.edu/urn-3:HUL.InstRepos:41426760
Terms of Use
This article was downloaded from Harvard University’s DASH
repository, and is made available under the terms and conditions
applicable to Other Posted Material, as set forth at
http://
A mathematical framework to determine
the temporal sequence of somatic
genetic events in cancer
Camille Stephan-Otto Attolinia,1, Yu-Kang Chenga,b,1, Rameen Beroukhimc,d,e,f, Gad Getzc, Omar Abdel-Wahabg,h,
Ross L. Levineg,h, Ingo K. Mellinghoffg,i, and Franziska Michora,2
aComputational Biology Center, Memorial Sloan–Kettering Cancer Center, New York, NY 10065;bTri-Institutional Training Program in Computational Biology and Medicine, Weill Cornell Medical College, New York, NY 10065;cCancer Program, Broad Institute, 7 Cambridge Center, Cambridge, MA 02142; dDepartments of Cancer Biology and Medical Oncology, Dana-Farber Cancer Institute, 44 Binney Street, Boston, MA 02115;eDepartment of Medicine,
Brigham and Women’s Hospital, 75 Francis Street, Boston, MA 02115;fDepartment of Medicine, Harvard Medical School, Boston, MA 02115; gHuman Oncology and Pathogenesis Program,hDepartment of Hematology, andiDepartment of Neurology, Memorial Sloan–Kettering Cancer Center, New York, NY 10065
Edited* by Richard T. Durrett, Cornell University, Ithaca, NY, and approved August 5, 2010 (received for review June 29, 2010)
Human cancer is caused by the accumulation of genetic alterations in cells. Of special importance are changes that occur early during malignant transformation because they may result in oncogene addiction and represent promising targets for therapeutic interven-tion. Here we describe a computational approach, called Retracing the Evolutionary Steps in Cancer (RESIC), to deduce the temporal sequence of genetic events during tumorigenesis from cross-sectional genomic data of tumors at their fully transformed stage. When applied to a dataset of 70 advanced colorectal cancers, our
algorithm accurately predicts the sequence ofAPC,KRAS, andTP53
mutations previously defined by analyzing tumors at different stages of colon cancer formation. We further validate the method with glioblastoma and leukemia sample data and then apply it to complex integrated genomics databases, finding that high-level
EGFRamplification appears to be a late event in primary
glioblas-tomas. RESIC represents the first evolutionary mathematical approach to identify the temporal sequence of mutations driving tumorigenesis and may be useful to guide the validation of candi-date genes emerging from cancer genome surveys.
mathematical modeling∣stochastic framework∣optimization algorithm
R
ecent technological advances have empowered researchers to examine the cancer genome at unprecedented throughput and resolution (1–3). Computational algorithms designed to filter random genetic events have begun to uncover mutational patterns that are typical for a particular cancer type and highly consistent between sample sets (1, 2, 4, 5). Further functional validation of these recurrent genetic events in nontransformed primary cells and mouse models of human cancer is hampered by the lack of knowledge of the sequence in which these altera-tions occur during human tumorigenesis. This temporal order can guide the generation of the correct genomic context in animal models of human cancer and can prioritize the validation of potential drug targets because those changes that occur early during malignant transformation may result in rewiring of the signaling circuitry or confer a state of addiction to the new signal. Here we describe a unique computational approach, called Re-tracing the Evolutionary Steps in Cancer (RESIC), to determine the sequence of genetic events using cross-sectional genomic data from a large number of tumors at their fully transformed stage (Fig. 1).Model
RESIC is based on the principles of population genetics—the mathematical study of the dynamics of genetic variation within populations (6). Consider a population ofNcells at risk of accu-mulating the genetic changes leading to cancer (Fig. 2A). Cells proliferate according to a stochastic process (7): At each time step, a cell is chosen proportional to fitness to produce a possibly
mutated daughter cell. Subsequently another cell is chosen at random to die and is replaced by the newly produced cell to maintain homeostasis. A mutated cell can take over the popula-tion (i.e., reach fixapopula-tion) or go extinct due to stochastic fluctua-tions (Fig. 2A, Inset). Depending on the order of appearance of particular mutations, the population of cells follows different evolutionary paths toward the fully mutated state (Fig. 2A). We developed a mathematical model describing the evolutionary dynamics of this system (see SI Text).
We assume that cancers originate from a single population of cells per person and study the evolutionary dynamics of indivi-duals accumulating the mutations leading to cancer (Fig. 2B). We consider the dynamics of patients in steady state: There is a constant influx into the unmutated state, representing diagnosis of disease, and a constant outflux from the fully mutated state, accounting for deaths of patients or their cure. At steady state, the population is distributed across all possible states; this stea-dy-state distribution can be compared to the numbers of clinical samples with the corresponding genotypes, where the total num-ber of patients in a dataset is equal to the sum of patients in all states. This mapping is used to optimize a subset of parameters in the mathematical model (i.e., the fitness values of cell types) by minimizing the difference between the prediction and the ob-served frequencies in the dataset (seeSI Text). Other parameters, such as cellular population size, mutation rate and influx rate, are estimated from experimental results (8, 9) and tested for robust-ness over several orders of magnitude (seeSI Text). The output of RESIC is given as percent of the flux through the network via each particular path.
Results
The established sequence of genetic events arising during the multistep process of colorectal carcinogenesis (10) provides a un-ique example to test the ability of RESIC to recover this sequence from a cross-sectional dataset. We gathered genomic data from 70 advanced colorectal tumors (1, 2) (Table S1) and used RESIC to predict the temporal relationship between alterations in the APC,KRAS, andTP53genes. RESIC predicts that the most likely
Author contributions: R.B., G.G., I.K.M., and F.M. designed research; C.S.-O.A., Y.-K.C., and F.M. performed research; C.S.-O.A., Y.-K.C., O.A.-W., R.L.L., I.K.M., and F.M. contributed new reagents/analytic tools; C.S.-O.A., Y.-K.C., and F.M. analyzed data; and C.S.-O.A., Y.-K.C., R.B., R.L.L., I.K.M., and F.M. wrote the paper.
The authors declare no conflict of interest.
*This Direct Submission article had a prearranged editor.
1C.S.-O.A. and Y.-K.C. contributed equally to this work.
2To whom correspondence should be addressed. E-mail: [email protected].
This article contains supporting information online at www.pnas.org/lookup/suppl/
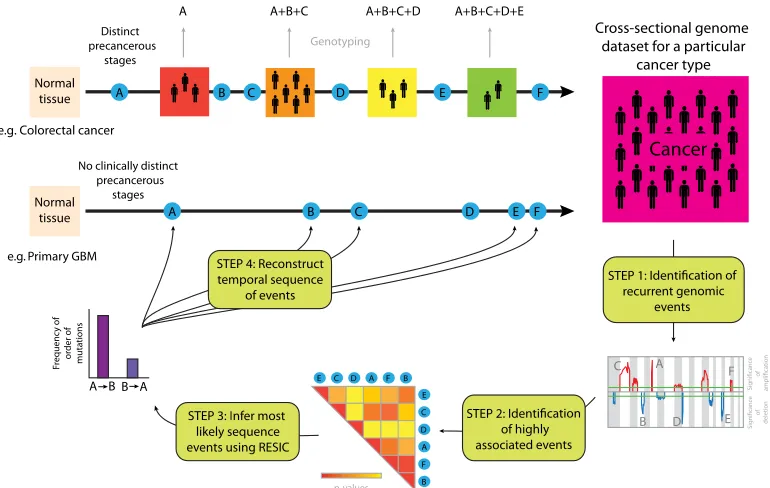
Fig. 1. Schematic diagram of RESIC. For cancer types with clinicopathologically defined stages (e.g., colorectal cancer), the temporal sequence in which genetic alterations arise during tumorigenesis can be identified by genotyping samples from patients at different stages of disease progression. For cancer types that are diagnosed de novo without detectable precursor lesions (e.g., primary GBM), the order of alterations cannot be identified with a similar approach. We present an evolutionary computational algorithm (RESIC) to identify the temporal sequence of events arising during tumorigenesis utilizing genomic data from a large number of samples (one per patient) of a particular histological type. In step 1, we use an algorithm such as GISTIC (4) to identify recurrent genetic aberrations in the genomics dataset. In step 2, these aberrations are ranked according to their pairwise association (statistically significant correlation, e.g., Fisher’s exact test). In step 3, the most likely sequence of these associated events is identified using RESIC. The results generated by RESIC are used to reconstruct the order in which alterations arise during development of a particular cancer type (step 4). Our methodology is applicable to large-scale datasets and can be used to identify the temporal sequence of many genetic alterations.
A
B
Fig. 2. Evolutionary dynamics of genetic alterations leading to cancer. (A) Transition between mutational states and schematic representation of different evolutionary trajectories toward cancer. Initially, the population consists ofNcells with genotypeiand fitness (i.e., growth rate)ri(detail). During each time step, a cell is chosen at random proportional to fitness to divide, and its daughter cell replaces another randomly chosen cell. During each cell division, a mutation arises with probabilityu. The mutated daughter has genotypejand fitnessrj. Ifrj> ri, the mutated daughter cell is advantageous as compared to the mother cell; ifrj<ri, it is disadvantageous, and ifrj¼ri, it is selectively neutral. The probability that a mutated cell takes over the population is given by its fixation probability,ρðri;rjÞ ¼ ½1−1∕ðrj∕riÞ∕½1−1∕ðrj∕riÞN. Ifrj¼ri, thenρðri;rjÞ ¼1∕N. The transition rate between statesiandjis given byNuρðri;rjÞin
small populations. A population of wild-type cells may accumulate mutations in different orders; an example path from the unmutated population to a state with three mutations is highlighted in green. (B) Population dynamics. The dynamics of patients accumulating mutations is represented in this network where nodes (i.e., mutational states) are populated according to the transition rates from one mutational state to the next. In the example shown here, cells can accumulate two mutations. The number of patients harboring cells with no mutations are denoted byX0, whereas those harboring mutations are denoted by
X1,X2, andX3. There is a constant influx of cases into the initial node. Cells in these patients accumulate mutations and populate the mutational states. The outflow from the fully mutated state eventually drives the system into steady state. An optimization algorithm is used to identify the transition rates for which the number of patients in each node at steady state coincides with the observations in a cross-sectional genomics dataset. The optimized parameter values of the evolutionary process serve to identify the most likely trajectory through the network.
Attolini et al. PNAS ∣ October 12, 2010 ∣ vol. 107 ∣ no. 41 ∣ 17605
BIOPHY
SICS
AND
COMPUT
A
TIONAL
[image:3.585.45.544.399.596.2]sequence of events is homozygous inactivation ofAPCoccurring before alterations ofKRAS(Fig. 3AandTable S2). Similarly, we found that bothAPCalleles are likely mutated beforeTP53is homozygously inactivated, and that at least oneKRAS allele is likely mutated before inactivation ofTP53(Fig. 3A). Although the small number of samples prevents us from investigating the complete network ofAPC,KRAS, andTP53mutations in a single computational analysis, the results of the separate smaller analyses can be combined into a sequence of events (see also Figs. S1 andS2) that coincides with the multistep model of colorectal can-cer (10, 11). The results are very robust with regard to sampling stochasticity and variations of the population size, mutation rates, and influx values (Figs. S3–S6andTable S3).
The temporal relationship between TP53 inactivation and mutations in theRASpathway may not be the same in all cancer types. For example, genetic inactivation of neurofibromin-1 (NF1), a negative regulator of RAS activity (12), induces senes-cence of human astrocytes in the absence ofTP53mutations (13); furthermore, mice develop high-grade gliomas only if TP53is inactivated prior to or simultaneously withNF1(14). To investi-gate the temporal relationship betweenNF1andTP53 inactiva-tion in human primary glioblastoma (GBM), we applied RESIC to a genomic dataset containing sequence and copy number in-formation regarding these two genes for 91 primary human GBM samples (3) (Table S1). We found thatTP53is likely inactivated beforeNF1is lost (Fig. 3B). Because several GBMs in this par-ticular sample set were collected after treatment with radiation and/or chemotherapy—therapies that might increase mutation rates (3), we reran RESIC using only GBMs that had not received prior therapy (n¼72). We again found thatTP53is likely mu-tated first (Fig. 3B). Our predictions are thus consistent with experimental data and suggest that TP53inactivation may not only be an early genetic event inTP53-mutant secondary glioblas-tomas (15) but also inTP53-mutant primary glioblastomas.
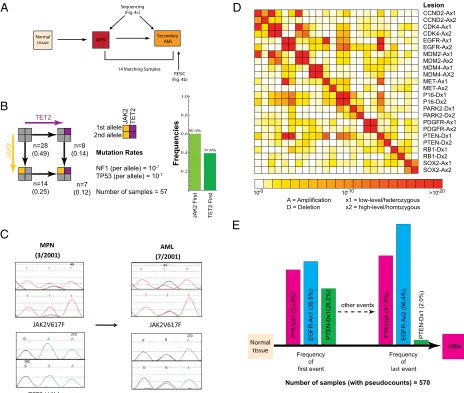
We next applied RESIC to a leukemia dataset to test whether it also accurately predicts the order of mutations arising in“liquid” tumors. We investigated the order of mutations in theJAK2and TET2genes in a set of 57 secondary acute myelogenous leukemia (AML) samples transformed from a preexisting myeloprolifera-tive neoplasm (MPN) (Fig. 4A). The classical MPNs are clonal disorders of hematopoiesis characterized by the presence of the JAK2V617Fmutation in most patients as well as an increased likelihood of transformation to AML (16). Clonality studies suggest that acquiredJAK2V617Fmutations may not represent the earliest genetic event in MPN pathogenesis and are not required for transformation to AML (17, 18). Recent studies have identified mutations in the putative tumor suppressor geneTET2in MPNs (17, 19–23), and clonal analysis suggested thatTET2mutations precede the acquisition of JAK2V617F mutations in MPN patho-genesis (19). However, these studies were done on a small number of patients. We therefore analyzed a larger set of patients with leukemic transformation from a preceding MPN, including samples from two different disease states (MPN and post-MPN AML) from 14 different patients (19, 24). When applying RESIC to the set of secondary AML samples for whichJAK2andTET2 mutational status was known, we found thatJAK2mutations likely preceded mutation inTET2 (Fig. 4B). Notably, analysis of 14 patients for which samples were available from the MPN and AML disease states showed thatTET2mutations were present in the AML, but not preceding MPN sample, in 5 patients with concomitantJAK2/TET2mutations (Fig. 4C) at the time of leuke-mic transformation. These data demonstrate, contrary to previous reports of smaller patient cohorts from a single time point, that TET2 mutations are more commonly acquired subsequent to JAK2in MPN/AML pathogenesis (24), as predicted by RESIC.
After validation of RESIC using examples for which the tem-poral order of alterations is known, we analyzed a large integrated genomics dataset of primary glioblastoma samples (n¼594)
(3, 4). These samples were used together with RESIC to identify genetic alterations occurring early during malignant transforma-tion. Such alterations may result in “rewiring”of the signaling circuitry, confer a state of “addiction” to the new signal (25), and thus represent particularly promising targets for therapeutic intervention (26). We first identified areas of statistically signifi-cant gene copy number alterations using GISTIC (4). For each locus, we distinguished gain of a single copy from high-level amplification, and hemizygous from homozygous deletions (Table S1). We then identified alterations that are significantly positively correlated (Fig. 4D), because the determination of an order of oncogenic events is meaningful only for those events that co-occur sufficiently often. AlthoughMDM2andCDK4on chromosome 12 and EGFR andMETon chromosome 7 were the most significantly correlated mutations, these associations are likely the result of large-region deletion or amplification events; because such changes cannot be attributed to independent muta-tional events, we excluded them from our analyses. Low- and high-level amplification ofEGFRand homozygous loss ofPTEN are the most significantly correlated events on separate chromo-somes (pvalues <10−30and10−24) (Fig. 4D). Because the dataset contains copy number information for 552 GBMs (excluding samples with homozygous loss ofPTENdue to their relative infre-quency) but sequence data for only 125 GBMs and because for both genes, copy number alterations and point mutations occur frequently, we first sought to investigate the robustness of the algorithm to the exclusion of sequence information. With only copy number data, we found that the two most frequent mutational paths through this network—initiating with EGFR low-level amplification and homozygousPTENloss, respectively (Fig. S1) —have very similar frequencies. Therefore, RESIC identifies no clear order of events for this mutational network. Using both copy number and point mutation data, we found that EGFR biallelic alterations likely occur beforePTENloss (Fig. S1). Hence the only difference between the two analyses is loss of significance of the dominant path, suggesting that analyzing copy number information only may be a viable option.
To perform a computational analysis on a large mutational network, we next determined that p16 homozygous deletions frequently co-occur withEGFRandPTEN alterations (pvalue <10−8) in the dataset containing copy number alterations only (Fig. 4D). When studying the mutational network of EGFR, PTEN, andp16(Figs. S2–4), RESIC predicts that the most com-mon early alterations areEGFRlow-level amplification andp16 deletion, with similar likelihood (Fig. 4E). Although there is no single most frequent path through the network (Fig. S3), the frequency of paths concluding with high-level amplification of EGFR is highest; the second most frequent final event is homozygousp16deletion (Fig. 4E). These data suggest that glial progenitor cells may tolerate full EGFR activation only after inactivation ofp16orPTEN. This result agrees with the fact that EGFRoverexpression is insufficient for tumorigenesis in mouse models of glioblastoma (27, 28), providing support for the tem-poral order of events predicted by RESIC.
Discussion
assump-A
n=13 (0.16) n=8 (0.10) n=2 (0.03) n=4 (0.05) n=5 (0.06) n=2 (0.03) n=22 (0.28) n=15 (0.19) n=8 (0.10) 1st allele 2nd allele APC KRAS APC KRAS Mutation RatesAPC (per allele) = 10-7
KRAS (per allele) = 10-7
Number of samples (with pseudocounts) = 79
n=14 (0.18) n=1 (0.01) n=8 (0.10) n=4 (0.05) n=2 (0.03) n=5 (0.06) n=16 (0.20) n=6 (0.08) n=23 (0.29) 1st allele 2nd allele APC TP53 APC TP53 Mutation Rates
APC (per allele) = 10-7
TP53 (per allele) = 10-7
Number of samples (with pseudocounts) = 79
n=14 (0.18) n=3 (0.04) n=22 (0.28) n=16 (0.20) n=4 (0.05) n=8 (0.10) n=4 (0.05) n=2 (0.03) n=6 (0.08) 1st allele 2nd allele KRAS TP53 KRAS TP53 Mutation Rates
KRAS (per allele) = 10-7 TP53 (per allele) = 10-7
Number of samples (with pseudocounts) = 79
APC
+/- First
TP53
+/- First
APC
-/- First
TP53
-/- First
KRAS First TP53 First KRAS
-/- First
TP53
-/- First
n=49/41
(0.54/0.57)
n=21/15
(0.04/0.21)
n=11/8
(0.20/0.11)
n=10/8
(0.05/0.11)
NF1 TP53
B
1st allele 2nd allele NF1 TP53 Mutation RatesNF1 = 10-7
TP53 = 10-7
NF1 First TP53 First NF1 First TP53 First
Number of total samples = 91
Number of untreated samples = 72
Total Untreated Frequencies Frequencies Frequencies APC First KRAS
+/- First
APC
-/- First
KRAS
-/- First
[image:5.585.131.454.43.584.2]Frequencies 53.4% 46.6% 77.8% 22.2% 0.2 0.4 0.6 0.8 1.0 72.4% 27.6% 61.5% 38.5% 0.2 0.4 0.6 0.8 1.0 57.6% 42.4% 30.4% 69.6% 0.2 0.4 0.6 0.8 1.0 37.7% 62.3% 37.5% 62.5% 0.2 0.4 0.6 0.8 1.0
Fig. 3. Validation of RESIC utilizing colorectal cancer and glioblastoma data. We tested the predictions of RESIC in colorectal cancer and glioblastoma because the order of some events leading to those tumor types has been identified (10, 14). In the schematics of the networks, nodes represent the numbers of patients with a particular genotype, whereas black arrows represent transitions between mutational states. (A) The order ofAPC,KRAS, andTP53in colorectal cancer. APCis shown in red,KRASin green, andTP53in blue. All mutation rates are10−7per allele per cell division. We apply a pseudocount of 1 to the entire system to prevent states with zero observations. Schematics of the networks are shown atLeft. We display the numbers and frequencies of patients in each mutational node in the network and show the most frequent paths through the network in the histograms atRight. Detailed results are listed inTable S2. (First Row) The APC–KRASnetwork. RESIC predicts that biallelic inactivation ofAPClikely occurs before anyKRASalteration. (Second Row) TheAPC–TP53network. RESIC predicts that biallelic inactivation ofAPClikely occurs beforeTP53inactivation. (Third Row) TheKRAS–TP53network. RESIC predicts that an alteration ofKRAS likely occurs first. (B) The order ofNF1andTP53in glioblastoma.NF1is shown in orange. We study the mutational network of heterozygous alterations only since allNF1and mostTP53mutations in the dataset are heterozygous (Table S1). A schematic of the network is shown atLeft. Detailed results are listed in Table S2. We show the number of samples with each genotype observed in the complete set of 91 The Cancer Genome Atlas samples (black) and in the restricted set of 72 untreated samples (blue) (3). For both the unrestricted and the restricted sets, RESIC predicts that aTP53point mutation likely occurs beforeNF1is altered (Right).
Attolini et al. PNAS ∣ October 12, 2010 ∣ vol. 107 ∣ no. 41 ∣ 17607
tion ensures that the model is consistent with the use of cross-sectional data and is important for situations in which more than one set of mutually exclusive mutations lead to cancer; in such cases, tumor samples can be subdivided into classes of different tumor subtypes, and each subtype must be analyzed individually. (ii) The likelihood of diagnosis is uniform across all states. This assumption can be partially relaxed if more biological data are included in the model, which is equivalent to changes in the number of observed samples with each combination of mutations; variations in these numbers have negligible impact on the results (Fig. S5). (iii) The order of mutations arising during tumorigen-esis can be inferred from the order of mutations arising after diagnosis. This assumption links the results obtained from a data-base containing diagnosed cancer samples to the processes of tumorigenesis before diagnosis. Interactions between tumor cells and the microenvironment or immune system can be considered
as a modulation of mutation rates and fitness values but are excluded from the current implementation of RESIC for clarity. The results of RESIC are very robust to changes in the number of samples per genotype due to variability in sampling or the rate of diagnosis (Figs. S5andS6), the population size of cells at risk of accumulating mutations, the influx value into the unmutated state, and the mutation rate (Table S3).
The frequencies of evolutionary paths through mutational networks identified by RESIC are never 100%. This finding may suggest that there is not a unique order in which these altera-tions occur—a hypothesis proposing that the genetic model of colorectal cancer (10) describes the order of mutations of only a subset of colorectal tumors (29). Alternatively, it may be attrib-uted to the alteration of signaling pathways through alterations of mutually exclusive but functionally equivalent genes; it could also be the result of distinct mutational classes within the same
A
C
B
E
D
[image:6.585.61.525.43.436.2]last
cancer subtype. The latter issue is addressed by studying highly correlated mutations because strong correlation may reflect func-tional associations.
We have restricted our analysis to only a subset of mutations implicated in tumorigenesis because RESIC requires correlated alterations as input; the question of the sequence of alterations is meaningful only if those alterations co-occur sufficiently fre-quently. Even the largest currently available dataset, the The Cancer Genome Atlas data, combined with separate glioblastoma studies (n¼594), contains only a small number of associated lesions (Fig. 4D). These correlated lesions also reflect individual molecular subtypes of glioblastoma. Based upon our analyses, we expect that of the order of 100 samples are sufficient to analyze mutational networks containing several loci. However, RESIC can be applied to any tumor type by analyzing significantly cor-related genetic alterations in separate computational analyses (see Fig. 3). Furthermore, RESIC can be applied to individual subtypes of cancers after these subtypes have been identified uti-lizing gene expression or other data.
Based on the examples presented here, we anticipate that our algorithm will provide the research community with a tool for the identification of tumor-initiating events using the emer-ging cross-sectional cancer genome datasets and will help with
the generation of hypotheses about carcinogenesis that can be tested using modern mouse models of human cancer (30). The identification of the order of genetic alterations in specific cancer (sub)types may lead to important insight into cancer biology and should inspire studies aimed at elucidating how specific genes cooperate (or in a different order may prevent) tumorigenetic processes.
ACKNOWLEDGMENTS.The authors thank Timothy Chan, Eric Holland, Marc Ladanyi, Thomas Pfeiffer, David Solit, Barry Taylor, and the Michor lab for critical reading and comments. R.B. was supported by grants from the National Institutes of Health (NIH) (K08CA122833), the Doris Duke Charitable Foundation, and a V Foundation Scholarship. O.A.W. was supported by the American Society of Hematology Research Training Award for Fellows and by the Clinical Scholars Program at Memorial Sloan–Kettering Cancer Center (MSKCC). R.L.L. is an Early Career Award Recipient and is the Geoffrey Beene Junior Chair at Memorial Sloan–Kettering Cancer Center. I.K.M. was supported by the Department of Defense, Sontag Foundation, Doris Duke Charitable Foundation, Sidney Kimmel Foundation, Golfers Against Cancer, and Brain Tumors Funders’Collaborative, and is a Leon Levy Foundation Young Investigator. F.M. was supported by the NIH/National Cancer Institute (NCI) and the MSKCC Society and is a Leon Levy Foundation Young Investi-gator. This work is supported by the NCI initiative for Physical Sciences in Oncology (physics.cancer.gov) through Award U54CA143798.
1. Bamford S, et al. (2004) The COSMIC (Catalogue of Somatic Mutations in Cancer) database and website.Br J Cancer91:355–358.
2. Sjöblom T, et al. (2006) The consensus coding sequences of human breast and colorectal cancers.Science314:268–274.
3. TCGA (2008) Comprehensive genomic characterization defines human glioblastoma genes and core pathways.Nature455:1061–1068.
4. Beroukhim R, et al. (2007) Assessing the significance of chromosomal aberrations in cancer: Methodology and application to glioma. Proc Natl Acad Sci USA 104:20007–20012.
5. Taylor BS, et al. (2008) Functional copy-number alterations in cancer.PLoS ONE 3:e3179.
6. Hartl DL, Clark AG (2007)Principles of Population Genetics(Sinauer Associates, Sunderland, MA), 4th Ed p xv.
7. Moran PAP (1962)The Statistical Processes of Evolutionary Theory(Clarendon Press, Oxford, UK) p 200.
8. Lengauer C, Kinzler KW, Vogelstein B (1998) Genetic instabilities in human cancers. Nature396:643–649.
9. Kunkel TA, Bebenek K (2000) DNA replication fidelity.Annu Rev Biochem69:497–529. 10. Fearon ER, Vogelstein B (1990) A genetic model for colorectal tumorigenesis.Cell
61:759–767.
11. Vogelstein B, Kinzler KW (2002)The Genetic Basis of Human Cancer(McGraw–Hill, New York), 2nd Ed p 821.
12. Buday L, Downward J (2008) Many faces of Ras activation.Biochim Biophys Acta 1786:178–187.
13. McGillicuddy LT (2009) Proteasomal and genetic inactivation of the NF1 tumor sup-pressor in gliomagenesis.Cancer Cell16:44–54.
14. Zhu Y, et al. (2005) Early inactivation of p53 tumor suppressor gene cooperating with NF1 loss induces malignant astrocytoma.Cancer Cell8:119–130.
15. Ohgaki H, Kleihues P (2007) Genetic pathways to primary and secondary glioblastoma. Am J Pathol170:1445–1453.
16. Levine RL, Pardanani A, Tefferi A, Gilliland DG (2007) Role of JAK2 in the pathogenesis and therapy of myeloproliferative disorders.Nat Rev Cancer7:673–683.
17. Campbell PJ, et al. (2006) Mutation of JAK2 in the myeloproliferative disorders: Timing, clonality studies, cytogenetic associations, and role in leukemic transforma-tion.Blood108:3548–3555.
18. Levine RL, et al. (2006) X-inactivation-based clonality analysis and quantitative JAK2V617F assessment reveal a strong association between clonality and JAK2V617F in PV but not ET/MMM, and identifies a subset of JAK2V617F-negative ET and MMM patients with clonal hematopoiesis.Blood107:4139–4141.
19. Delhommeau F, et al. (2009) Mutation in TET2 in myeloid cancers.N Engl J Med 360:2289–2301.
20. Tefferi A, et al. (2009) Detection of mutant TET2 in myeloid malignancies other than myeloproliferative neoplasms: CMML, MDS, MDS/MPN and AML.Leukemia 23:1343–1345.
21. Langemeijer SM, et al. (2009) Acquired mutations in TET2 are common in myelodys-plastic syndromes.Nat Genet41:838–842.
22. Abdel-Wahab O, et al. (2009) Genetic characterization of TET1, TET2, and TET3 alterations in myeloid malignancies.Blood114:144–147.
23. Theocharides A, et al. (2007) Leukemic blasts in transformed JAK2-V617F-positive myeloproliferative disorders are frequently negative for the JAK2-V617F mutation. Blood110:375–379.
24. Abdel-Wahab O, et al. (2010) Genetic analysis of transforming events that convert chronic myeloproliferative neoplasms to leukemias.Cancer Res70:447–452. 25. Weinstein IB (2002) CANCER: Addiction to oncogenes—the Achilles heal of cancer.
Science297:63–64.
26. Sharma SV, Bell DW, Settleman J, Haber DA (2007) Epidermal growth factor receptor mutations in lung cancer.Nat Rev Cancer7:169–181.
27. Bachoo RM, et al. (2002) Epidermal growth factor receptor and Ink4a/Arf: Convergent mechanisms governing terminal differentiation and transformation along the neural stem cell to astrocyte axis.Cancer Cell1:269–277.
28. Zhu H, et al. (2009) Oncogenic EGFR signaling cooperates with loss of tumor suppres-sor gene functions in gliomagenesis.Proc Natl Acad Sci USA106:2712–2716. 29. Smith G, et al. (2002) Mutations in APC, Kirsten-ras, and p53—alternative genetic
pathways to colorectal cancer.Proc Natl Acad Sci USA99:9433–9438.
30. Sharpless NE, Depinho RA (2006) The mighty mouse: Genetically engineered mouse models in cancer drug development.Nat Rev Drug Discov5:741–754.
Attolini et al. PNAS ∣ October 12, 2010 ∣ vol. 107 ∣ no. 41 ∣ 17609
BIOPHY
SICS
AND
COMPUT
A
TIONAL