http://eprints.whiterose.ac.uk/92714/ Version: Accepted Version
Article:
Cao, T., Lu, B., Xu, D. et al. (4 more authors) (2015) An efficient method for thickness prediction in multi-pass incremental sheet forming. The International Journal of Advanced Manufacturing Technology, 77 (1-4). 469 - 483. ISSN 0268-3768
https://doi.org/10.1007/s00170-014-6489-9
The final publication is available at Springer via http://dx.doi.org/10.1007/s00170-014-6489-9
[email protected] https://eprints.whiterose.ac.uk/ Reuse
Unless indicated otherwise, fulltext items are protected by copyright with all rights reserved. The copyright exception in section 29 of the Copyright, Designs and Patents Act 1988 allows the making of a single copy solely for the purpose of non-commercial research or private study within the limits of fair dealing. The publisher or other rights-holder may allow further reproduction and re-use of this version - refer to the White Rose Research Online record for this item. Where records identify the publisher as the copyright holder, users can verify any specific terms of use on the publisher’s website.
Takedown
If you consider content in White Rose Research Online to be in breach of UK law, please notify us by
An efficient method for thickness prediction in
multi-pass incremental sheet forming
Tingting Caoa, Bin Lua,b*, Dongkai Xua, Huan Zhanga, Jun Chena, Hui Longb, Jian Caoc
a
Department of Plasticity Technology, Shanghai Jiao Tong University, 1954 Huashan Road, Shanghai, 200030, P.R. China
b
Department of Mechanical Engineering, The University of Sheffield, , Sheffield, S1 3JD, UK
c
Department of Mechanical Engineering, Northwestern University, Evanston, IL 60208, USA
* Corresponding author: [email protected]
Abstract
Incremental sheet forming (ISF) is a highly versatile and flexible process for rapid
manufacturing of complex sheet metal parts. In the ISF process, efficient and accurate
prediction of part thickness variation is still a challenging task, which is especially true for the
multi-pass ISF process. The Sine law equation and the finite element method (FEM) are the
two commonly used conventional prediction methods. However, these approaches are either
with limited accuracy or very time consuming. For the multi-pass ISF process, the thickness
prediction is even more challenging since two or more forming steps are involved. Focusing
on the thickness prediction of multi-stage ISF process, this work proposes a thickness
prediction model based on the geometrical calculation of intermediate shapes of the formed
part and backward tracing of nodal points of the forming tool. By developing this method, the
thickness distribution can be calculated through the predicted nodal displacement in the ISF
process. To verify the proposed model, four different geometrical shapes, i.e. conic, parabolic
conic, non-axisymmetric and hemispherical parts, are physically formed by using a NC ISF
machine. The geometric shapes and the detailed thickness distributions of the formed parts are
carefully measured and compared with the prediction model developed. Good agreements
between the analytical predictions and the experimental results are obtained. This indicates the
effectiveness and robustness of the developed thickness prediction approach.
Keywords
1.
Introduction
Incremental sheet forming (ISF) is an advanced flexible sheet forming process. By using
this process, a 3D complex freeform part can be produced by driving a simple stylus-type tool
over a predefined tool path. As dedicated forming tool sets with specific shapes are not
necessary in this process, it can effectively shorten the lead time and reduce the production
cost[1]. Meanwhile, ISF technology also exhibits higher formability comparing to the
conventional sheet forming processes. This may be due to its localized and incremental
deformation nature, which avoids sheet necking that normally occurs in conventional sheet
forming processes such as deep drawing [2]. Furthermore, the ISF forming force is usually
low due to its localized deformation nature. This reduces the size and capacity of forming
machines needed. Considering these advantages, ISF becomes a good alternative to the
conventional sheet forming processes in manufacturing small batch or customized sheet
components, such as in the product development process of aerospace [1], biomedical [3] and
automotive sectors [4].
The original ISF technology, a single point incremental forming (SPIF) process was first
proposed by Iseki et al. [5] in association of cutting expensive stamping dies in the
manufacturing of a car body panel. Based on the SPIF technology, variants of the ISF
processes have been developed, such as the two-point incremental forming (TPIF) [6], double
side incremental forming (DSIF) [7], laser assisted incremental forming [8], electric hot
incremental forming [9] and water jet incremental sheet bulging method [10]. Due to these
developed ISF processes, components with complex shapes and hard-to-form materials can be
produced successfully, which further expands the application fields of the ISF technology.
Although the ISF technology shows better formability, components with steep wall
angles or vertical wall are still difficult to be formed in a single pass. This is due to the
localized deformation nature of ISF: the material deformation occurs only in a small area that
contacts with the forming tool and the surrounding material cannot be drawn into the
deformation zone to compensate for the local material insufficiency. To overcome this
problem, multi-pass ISF process has been developed to redistribute the material uniformly by
well designed, more uniform thickness distribution can be obtained and parts with steeper wall
angles may be produced without crack failure. Skjoedt et al. [12] obtained a circular
cylindrical cup with vertical wall angle by two different five-pass forming strategies. Malhotra
et al.[13] proposed a mixed tool path strategy to achieve a smoother component base by using
a combination of in-to-out and out-to-in tool paths for each intermediate shape. Using this
strategy, a cylindrical cup with the stepped features could be generated. These examples
demonstrate the advances of multi-pass ISF process.
In the multi-pass ISF process, the forming strategy, especially intermediate shapes, will
significantly affect the maximum achievable forming angle. However, the design of
intermediate shapes is mainly based on the designer’s experience [14]. Thickness prediction in
multi-pass ISF plays a significant role in design optimization of intermediate shapes. In this
way, how to predict the thickness distribution becomes a major challenge in multi-pass ISF
process design. However, although many efforts have been made to improve the thickness
uniformity using multi-pass ISF, there is no systematic approach for the prediction of
thickness distribution. Fast prediction of thickness distribution of ISF parts is still a
challenging task in multi-pass ISF process.
In the conventional single-pass ISF process, thickness prediction can be obtained through
the Sine law model [15]. However, this approach has very limited accuracy. Furthermore, the
Sine law may not be used for the thickness prediction in multi-pass ISF process. This was
proven in the Kitazawa and Nakanes’ work [16], in which the thickness distribution of the
hemispheric shaped component formed by two-pass incremental forming was significantly
different from the result of using Sine law. Kitazawa et al. [17] also demonstrated that the
thinning of sheets in multi-pass incremental forming could exceed the maximum thickness
reductions observed in single-pass processing.
Another possible approach for thickness prediction is the finite element method (FEM).
By employing both FEM and physical experiments, He et al. [18] compared the numerical and
experimental results for forming of an aluminum cone with 50° wall angle. Good agreement
with a maximum difference of less than 0.1mm was obtained in their work. However, the FE
the material points were assumed to be moved along the normal direction of the transient
surface point of geometrical shape. The above approaches concentrate on ISF within a single
pass, but the thickness prediction methods for multi-pass forming are rarely explored.
Concerning the current research related to multi-pass ISF process, Duflou et al. [20]
investigated the difference of material deformation between multi-pass and single pass ISF.
Filice [21] proposed an analytical model to predict the thickness distribution using the
geometry shape parameter of the final formed parts in a double-pass incremental forming of a
cylindrical cup. Other than the above works, there are only limited researches investigate
thickness prediction. The lack of understanding in the material deformation and thickness
distribution becomes a barrier in multi-pass ISF design, especially for the determination of
intermediate shapes and pass numbers.
Focusing on the prediction of thickness distribution in the multi-pass ISF process, a
geometrical approach has been proposed in this work. In the calculation, the nodal positions
on the geometric profiles are tracked for each z-level generated based on the geometry of the
tool path, the tool radius and the tool step down value. Based on the calculated nodal
displacement, the thickness distribution can be calculated according to the principle of volume
constancy. Using the developed method, four examples of forming parts with different
geometrical shapes are studied, in which the geometric profiles and thickness distributions of
the formed shapes are measured to be compared with the predicted results. This is followed by
the discussion and conclusion of the developed approach.
2.
Methodology
Concerning the material deformation in the SPIF process, although the tool moves along
the circumferential direction, there is only limited circumferential strain while the dominant
material deformation occurs in the meridional direction. In most cases, the SPIF process can
be considered under plane-strain condition in the plane perpendicular to the tool movement
direction. The plane-strain deformation was observed in many researches. He et al. [22] found
that the tangential strain in incremental forming of a cone was much smaller as compared to
small enough to be negligible in SPIF process. Fang et al. [24] measured the sheet deformation
during the SPIF experiment and found that the meridional strain was 15-20 times larger than
the circumferential strain. However, in the case when the circumferential curvature increases,
the material deformation does not follow the plane strain assumption any more [19]. For parts
such as pyramid with small corners, the sheet deformation is under biaxial stretching
deformation condition. By considering the general ISF deformation conditions and ignoring
the through thickness shear effect and the case of corner deformation, the plain-strain
assumption is made in the analysis. In this way, the tracing of material points on the surface of
a part can be implemented in the 2D cross-sections of the part. In addition, other assumptions
include: a) the material volume is constant; b) the bending effect is ignored. Based on these
assumptions, a thickness prediction model for the multi-pass incremental forming is proposed.
This thickness prediction model includes three key steps: (1) Prediction of geometric profiles
for each pass; (2) Tracing the material points on the part surface; (3) Calculating the thickness
distribution. The detail calculation of thickness distribution is given as follows.
2.1 Description of the 2D cross-section profiles
In this work, the geometric cross-section profiles of forming parts are described by using
rational Bezier curves. Rational Bezier curve is a parametric polynomial curve, which does not
involve complex geometrical calculation and is especially suitable for describe the
cross-section of ISF parts. In the calculation, a rational Bezier curve in nth degree can be
defined by [25]:
, 0 , 0 ( ) ( ) ( ) n
i n i i i
n
i n i i
B u P
C u B u
0 u 1 (1)wherePi ( , , )x y zi i i is control point and
i is the scalar for each point. In the equation, thebasis functionB ui n, ( )is the classical Bernstein polynomial with n
th
degree, which can be given
,
!
( ) (1 )
!( )!
i n i
i n
n
B u u u
i n i
(2)
Using this definition, a cross-section profile can be described with the given control
points{ }Pi and their weights{ }
i . Equation (1) provides a convenient approach to describe thegeometrical profiles in the calculation process.
2.2 Geometric profiles generation algorithm
In the ISF process, the forming tool deforms the sheet in the vertical z direction level by
level, incrementally obtains the final shape. Considering the prediction of part profile after the
tool movement of each z-level, as the pre-described tool path is known, the cross sectional
shape of part can be generated with forming parameters including tool radiusRand the step
down valuedz.
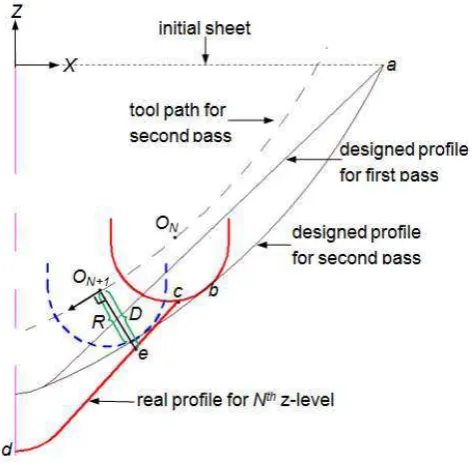
For a typical two-pass ISF process, concerning the intermediate shapes in the first pass as
shown in Fig.1, when the tool center locates at ONthe geometric profile is composed of three
parts: the deformed inclined wall (described by curve a-b), the contact region (described by
curve b-c-d) and the unformed bottom area (described by curve d-e-f). When the tool moves
down to the point ON+ 1 for the N+ 1th z-level, the wall a-b-c is further deformed and the
original contact area c-d-e moves to c-g-h. The unformed bottom area e-f keeps unchanged
and becomes h-i. Concerning the material movement in this process, the material at the region
a-b and h-i is kept unchanged. The sheet d-e joins the deformation while the sheet b-c is left in
the deformation process. In this way, the geometric profiles can be described based on the
Fig.1 Generation algorithm of geometric profiles in the first pass
Concerning the second pass, the geometry of the tool motion path in the cross-section can
also be obtained by offsetting the designed profile of the second pass. As shown in Fig. 2, if the
geometric profile for the Nth z-level has already been computed and ON is the tool center, the
tool center ON+1 for the N+ 1th z-level can be calculated according to the designed tool path with
the step down valuedz. Depending on the relative position of the geometric profile for the Nth
z-level and the tool contour for the N+ 1th z-level, the relationship between the geometric
profiles and tool can be divided into two cases as shown in Fig.2.
(b) The lowest point of the tool for the N+ 1th z-level is below the geometric profile for the Nth z-level
Fig.2 Geometric profiles generation in the second pass (a) the lowest point of the tool for the N+ 1th z-level
is over the geometric profile for the Nth z-level ; (b) the lowest point of the tool for the N+ 1th z-level is
below the geometric profile for the Nth z-level
As shown in Fig.2 (a), the tool tip g for N+ 1th z-level is above the geometrical profile of
previous Nth z-level a-b-c-d-e. In this case, the sheet profile for N+ 1th z-level can be described
by the curve a-b-f-d-e, in which the curve a-b is the deformed area, b-c-d deforms to b-f-d and
d-e is still the un-deformed sheet area.
As shown in Fig.2 (b), the tool tip h for N+ 1th z-level is below the geometrical profile of
previous Nth z-level a-b-c-d-e-f. In this case, the sheet profile for N+ 1th z-level can be
described by the curve a-b-c-g-h-i, in which the curve a-b-c is the deformed area, c-d-e moves
to c-g-h, and e-f moves to h-i as rigid body motion.
In the multi-pass ISF process, if the intermediate shapes are not properly designed, the tool
and sheet may lose the contact due to the rigid body motion of un-deformed sheet below the
tool, which results in an inaccurate final part geometry. In order to consider this effect in the
proposed model, the minimum distance between the tool center and the geometric profiles will
be calculated to determine the status of contact between the tool and sheet. As shown in Fig. 3,
will stop.
Fig. 3 The determination of contact between the tool and sheet
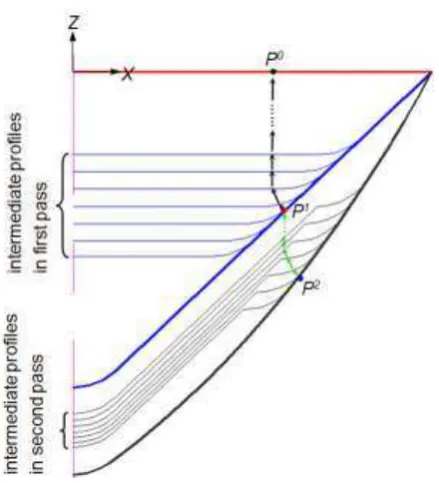
2.3 Backward tracing of material points
Based on the calculated shapes, the material motion may be traced according to the
intermediate shape of each z-level. In this work, a backward tracing method is developed. In
this method, the nodal point on the final predicted shape is traced back to dreamtime its
position on the intermediate shapes and initial blank. It is assumed that the material point will
move along its normal position on the surface in every transient time [19]. In this way, for any
given point P on the final surface N+ 1th level, the point position on the previous surface of Nth
level can be obtained by calculating the intersection point of the P’s normal and the profile
curve of Nth level. By repeating this process, the point PN-1 for N-1th z-level until the initial
Fig. 4 The tracing of material points in the two-pass ISF process
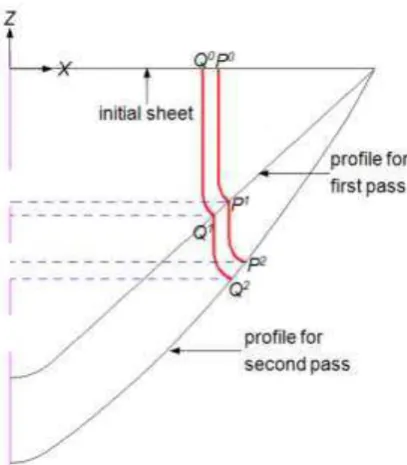
According to the updated point positions after deformation, the thickness distribution can
be calculated under the volume constancy assumption. In this work, for any two neighboring
points P, Q on the blank, the thickness can be updated by:
1
1 i PQ
i i
PQ PQ i
PQ
A
t
t
A
(3)where
t
PQi represents the sheet thickness whileA
PQi represents the segment area between Pand Q for pass number i. The segment area can be obtained from the coordinates of the
Fig. 5.The traces of two adjacent points of P and Qin two-pass ISF process
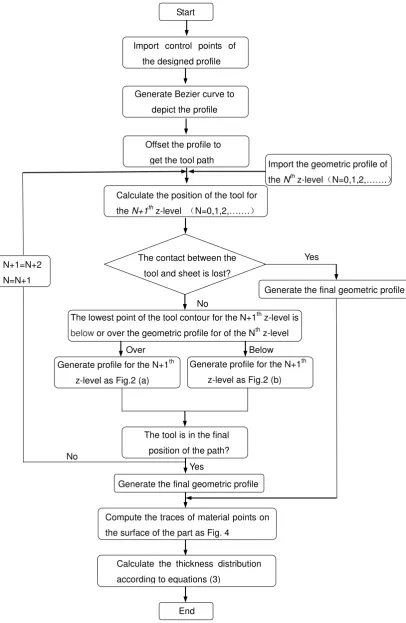
2.4 Development of thickness prediction program
In this work, an in-house software program is developed to predict the ISF thickness
distribution. For any given initial shape and final profile, the thickness is calculated according
to the developed method and the calculation procedure is illustrated in Fig. 6. As shown in the
figure, the control points of the designed profile for the second pass is firstly imported and
then a rational Bezier curve is generated to depict the designed profile. By offsetting a distance
of tool radius R, the tool path can be obtained and the tool position at each z-level can be
calculated with the step down valuedz. With the new tool position, the contact state between
the tool and sheet will be checked. If there is no contact between the tool and sheet, the
forming process stops and the final geometric profile can be generated according to the current
state. Otherwise, the geometric profile for the N+ 1th z-level is calculated according to Fig.2 (a)
or Fig.2 (b) depending on the relative position of the geometric profile and the tool. In this
way, the geometric profiles for each z-level deformation can be calculated. After the final
geometric profile of the forming pass is generated, the tracing of material points on the surface
of the part can be computed based on the algorithm illustrated in Fig.4. Then the final
thickness distribution can be calculated by using the equation (3). In this way, the thickness
Fig. 6 Procedure to calculate the thickness distribution of multi-pass ISF process
Import control points of
the designed profile
Generate Bezier curve to
depict the profile
Offset the profile to
get the tool path
Calculate the position of the tool for
the N+1th z-level N=0,1,2,…….
The contact between the
tool and sheet is lost?
The lowest point of the tool contour for the N+1th z-level is
below or over the geometric profile for of the Nth z-level
Generate profile for the N+1th
z-level as Fig.2 (a)
Generate profile for the N+1th
z-level as Fig.2 (b)
The tool is in the final
position of the path? No
Yes
Over Below
Yes N+1=N+2
N=N+1
No
Import the geometric profile of
the Nth z-level N=0,1,2,…….
Generate the final geometric profile
Generate the final geometric profile
Compute the traces of material points on
the surface of the part as Fig. 4
Calculate the thickness distribution
according to equations (3)
3.
Experimental Validation
Using the developed geometric profiles generation, material deformation and thickness
distribution calculation method, the final shape of part fabricated by multi-pass ISF
technology can be predicted. To verify the developed thickness prediction approach, four
different shapes including a cone shape with a constant forming angle, a parabolic cone, a
non-axisymmetric part and a hemisphere were formed. The intermediate and final shapes and
the final thickness distributions from analytical model and experiments were calculated and
measured, respectively.
3.1 Experimental setup
The experiments were performed on a 3-axial CNC machine as shown in Fig. 7. A ball
head tool with a radius of 5mm was used to form the parts with the feed rate of 2000 mm/min.
Contour based tool path with a step down value of 0.2mm was generated and used for the four
parts. Aluminum alloy AA5052 and AA1100 with initial thickness of 1mm had been used in
the experiments. For the case1-3, AA5052 was employed in the experiments. For the fourth
case with large forming angle, AA1100 was used to validate the effectiveness of the developed
method. The initial size of the blank is 180×180mm. During the forming process, grease was
employed as lubrication to reduce the friction between tool and sheet. Note that a backing
plate had been placed at the bottom of blank to avoid the bending around the top edge of part
in the forming process. In the experiments, depending on the forming steps, the part in each
case are formed 2-4 times to ensure the experimental repeatability on both thickness and
cross-sectional profiles. After forming, the cross-section of geometric profiles of finished parts
are measured by using a KEYENCE® LK-G150 laser displacement sensor with a resolution of
0.01 m as shown in Figure 8. It is worthwhile to mention that the on the top surface profiles
are measured in the experiment while in the prediction, the tracing of material points are also
implemented on the top surface of the part. In this way, the profiles measured and calculated
Fig.7 Experimental setup Fig.8 Measurement of the part profile
3.2 Case1: a cone shape with a constant forming angle
In this case, a cone shape with a major diameter of 120mm and constant angle of 60° was
employed to validate the developed method. Two forming passes had been designed to form
the designed cone. In the first pass, a cone with a constant wall angle of 30° would be formed.
In the second pass, the final shape would be formed as shown in Fig. 9. Fig. 10 shows the
finished parts after each forming pass.
(a) Part for the first pass (b) Part for the second pass
Fig.10 Formed parts: (a) part for the first pass; (b) part for the second pass
In order to compare the intermediate profile shapes, in the experiment, the ISF process
was paused and the intermediate cross-section shapes were measured when the forming depth
increased every 10mm. In this way, about 9 intermediate profiles are obtained and these
profiles are compared with those obtained from the analytical prediction. In addition, the
designed profile is also included in the comparison as reference. The comparison result is
given in Fig.11. As can be seen from the figure, the predicted profile is quite close to the
designed profile but some discrepancy can be observed for those measured in the experiment:
the predicted profiles are about 1mm deeper than the experimental one. This discrepancy may
be from two sources: 1) the initial bending at the top edge of the cone, which is not considered
in the analysis. 2) Another factor may be from the cyclized loading: after the tool leaving a
certain location, the spring back of sheet occurs. However, this spring back is not considered
Fig.11 Comparison of the scanned geometric profiles with predicted geometric profiles
In order to measure the thickness distribution, the thicknesses of the formed parts were
marked at an interval of 2mm on the initial sheet surface and then the thicknesses were
measured according to these marks on the formed parts. Fig. 12 compares the thickness
distributions of the physical formed parts and the predicted results by both the developed
method and the Sine law for the first and second passes. As can be seen in the figure, the
prediction accuracy of Sine law is obvious worse than the developed method. Concerning the
first pass, as shown in Fig.12 (a), accurate prediction can be obtained by comparing the
experimental result, except for the edge of cone, where the predicted thickness changes rapidly
while the actual thickness decreases gradually. This may be attributed to that the developed
method does not consider the bending effect. Concerning the second pass, the predicted result
is still effective, although some deviations can be observed at the top edge of the cone. The
bending effect shows larger influence on the thickness at the edge of the cone, where the
thickness changes rapidly and a thinning band can be observed in the actual formed parts (see
Fig.10b). Generally, the developed method suggests good thickness prediction accuracy for
(a)Thicknesses for the first pass
(b) Thicknesses for the second pass
Fig.12 Comparison between the experimental thickness distributions and the predicted results: (a)
thicknesses for the first pass; (b) thicknesses for the second pass
3.3 Case2: a parabolic cone
In the second case problem, a parabolic cone with varied wall angle was employed in the
analysis. Similar to the previous case, the major diameter of the cone is 120mm. Two forming
steps were employed in the analysis. In the first step, a cone with constant angle of 45° was
formed. In the second step, ISF was implemented to finalize the part to the designed geometry
Fig.13 Geometric model of a parabolic cone
(a) Part for the first pass (b) Part for the second pass
Fig.14 Formed parts: (a) part for the first pass; (b) part for the second pass
It is worthwhile to note that, the first step and second step are designed with the same
depth as shown in the Fig.13. This kind of pass design will result in the rigid body motion of
sheet at the second step. This rigid body motion will result in the losing of contact between
tool and sheet. This could also be observed in Cao’s work [13]. Concerning the rigid body
motion in this case, as shown in Fig.15b, the stepped feature can be observed due to the loss of
contact between the tool and sheet.
Concerning the intermediate profile shape prediction, in the experiments, the
forming step. Fig.15 compares the scanned, predicted and designed geometric profiles. As can
be seen from the figure, only little difference can be observed between the scanned profile and
predicted profile, which suggests relatively high prediction accuracy.
Concerning the designed profile and the predicted profile as shown in Fig. 15(d), obvious
difference can be observed: no stepped feature was expected in the design. However, this
feature was captured by the developed program and it also occurred in the actual case. The
discrepancy between the final forming depth of the prediction and the experiment is very little.
This result suggested the satisfactory prediction of rigid body motion of the developed
method.
(a) At the depth of 10mm (b) At the depth of 20mm
(c) At the depth of 30mm (d) Final position
Fig.15 Comparison of the scanned geometric profiles with predicted geometric profiles: (a) at the depth of
Concerning the thickness distribution, as can be seen from Fig. 16(a), the Sine law does
not show good accuracy while the developed method is more accurate. Concerning the first
forming step, the developed program suggests accurate result. In the second step, the
prediction and the actual results have the same trend in thickness distribution. At the edge of
cone, the prediction is not very accurate as the sheet thinning may be affected by bending
effect. On the part wall, the prediction result is close to experimental result. The maximum
discrepancy is about 0.085mm, which represents the prediction error of about 8%. This case
study suggests that in the condition of variable wall angle, the developed method is still
effective in thickness prediction.
(a)Thicknesses for the first pass
(b) Thicknesses for the second pass
Fig.16 Comparison between the experimental thickness distributions and the predicted results: (a)
3.4 Case3: a non-axisymmetric part
In the above two cases, axisymmetric parts were employed in the analysis. In order to
examine the robustness of the developed method and program a part with different
cross-section shapes was designed as shown in Fig.17. In the ISF process, two forming stages
were employed as given in the figure. Fig. 18 shows the final formed parts.
Fig.17 Geometric model of a non-axisymmetric part
(a) Part for the first pass (b) Part for the second pass
Fig. 19 compares the final geometry of the formed part. As can be seen from the figure,
the prediction of final geometry by using the developed program is quite effective. The
difference at the top edge is because of obvious bending observed for the actual formed part.
In the comparison, the maximum difference occurs at the bottom of the part, with maximum
distance of about 1.8mm.
[image:23.595.96.542.192.373.2](a) Final profile for the X-section (b) Final profile for the Y-section
Fig.19 Comparison of the scanned geometric profiles with predicted geometric profiles: (a) final profile for
the X-section; (b) final profile for the Y-section
Concerning the thickness distribution prediction, both the developed method and the Sine
law are accurate for the first forming step. At the second stage, the prediction and the actual
results have the similar trend in thickness distribution (see Fig.20 (b) and (c)). At the edge of
cone, the predicted values are thinner than the actual result for the bending effect is not
considered in the analysis. Beside this, the thicknesses calculates from the developed method
are thicker than the measured thicknesses of part. Taking Fig.20 (c) as examples, the
maximum discrepancy of Y –section occurs at the distance of 30mm from part edge, with the
maximum value of about 0.084mm, which suggests the prediction error of about 8%.
Although the Sine law shows the similar trend in prediction, the results is even worse at the
(a)Thicknesses for the first pass
(b)Thicknesses for the second pass of X-section
(c) Thicknesses for the second pass of Y-section
Fig.20 Comparison between the experimental thickness distributions and the predicted results: (a)
thicknesses for the first pass; (b) thicknesses for the second pass of X-section; (c) thicknesses for the second
3.5 Case 4: a hemisphere
In cases 1-3, only two forming stages were employed in the analysis. To further validate
the robustness of the development method under the case with four forming steps and wall
angle of 90º, a hemisphere part with diameter of 118mm had been employed. Four forming
stages had been designed as shown in Fig. 21. In order to achieve the maximum wall angle of
90º, AA1100 material was employed. Fig. 22 shows the finished parts after each forming
stages.
Fig.21 Geometric model of a hemisphere
[image:26.595.135.507.73.248.2]
(c) Third forming pass (d) Final forming pass
Fig.22 Formed parts: (a) First forming step; (b) Second forming step
(c) Third forming step; (d) Final forming step
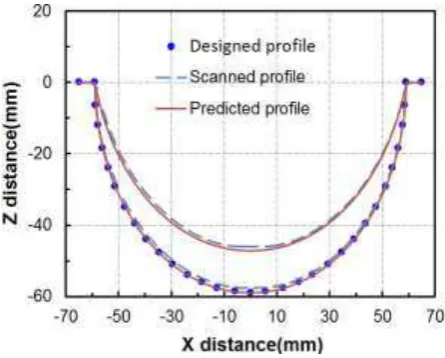
Fig. 23 compares the scanned, predicted and designed geometric profiles the end of the
second, the third and the fourth forming stages. In addition, intermediate scanned and
predicted profiled near the beginning of each forming stage were also compared for further
validation. As can be seen from the figure, the predicted profiles are quite close to those
measured in the experiments, which suggests the robustness of the developed program on
geometrical shape prediction.
[image:26.595.98.541.485.661.2]
(c) Profiles for the fourth forming pass
Fig.23 Comparison of the scanned geometric profiles with predicted geometric profiles: (a) profiles for the
second forming pass; (b) profiles for the third forming pass; (c) profiles for the fourth forming pass
Concerning the thickness distribution, Fig. 24 compares those from the physical formed
parts and the predictions by both the developed method and the Sine law for all the forming
stages. As can be seen in the figure, very accurate prediction can be obtained at the initial
forming stages. However, with the increasing of forming steps, the prediction accuracy
reduces due to the error accumulation. Concerning the Sine law, the prediction result obtains
from the Sine law is much worse than the developed method. For the third step as shown in
Fig. 24(c), obvious difference between the experiment and Sine law can be observed, while
the maximum discrepancy is over 0.15mm while that for the developed method is less than
0.1mm. For the fourth step, the error of the Sine law become over 0.2mm while that for the
developed method is about 0.1mm, except for the points that near the edge of part: the
minimum thickness predicted by the developed method is about 0.2mm while in the actual
case, the minimum point is about 0.35mm. This discrepancy may be attributed to the double
effect from bending and error accumulation. From this case, it may be obtained that the
accuracy may reduce with the increase of forming step, as the thickness calculation is based
on the previous results. Generally speaking, for a three-step forming, the accuracy is
(a)Thicknesses for the first pass
(b)Thicknesses for the second pass
(d)Thicknesses for the fourth pass
Fig.24 Comparison between the experimental thickness distributions and the predicted results: (a)
thicknesses for the first pass; (b) thicknesses for the second pass; (c) Thicknesses for the third pass;
(d)Thicknesses for the fourth pass
3.6 Discussion of results
The developed thickness prediction method is a geometric approach based on the
calculation of intermediate geometric profiles of each z-level and the trace of material point in
the forming process. The examples of a basic cone shape, a parabolic cone shape, a
non-axisymmetric shape and a hemisphere suggested the satisfactory prediction accuracy,
which demonstrated the robustness of the developed method. Comparing to the conventional
Sine law calculation, the developed method showed more accurate prediction results.
Comparing to the FE approach, the developed method is much more efficient. In this way, a
good balance between the calculation accuracy and efficiency can be achieved in the
prediction of multi-pass ISF thickness distribution.
In this study, it is found that the thickness prediction accuracy also depends on the
prediction of the intermediate geometric profiles, the trace of material point and the
accumulation of errors, which may also be affected by the bending effect during the process as
well as the sheet material property. The discrepancy between the prediction and experiments
may be due to these factors.
(1) To consider the sheet bending effect so that the thickness distribution close to the edge of
the part can be predicted.
(2) To introduce the plasticity theory into the sheet deformation calculation, so that it can
provide a more accurate prediction in the cases that the sheet thickness is strongly affected
by the material behavior, e.g. prediction of the thinning band.
4.
Conclusions
In this paper, an efficient thickness prediction method for multi-pass incremental forming
is proposed. By using the developed method, the geometric profiles, the positions and
thickness distribution of four formed parts using multi-step ISF process are calculated. To
validate the proposed method, four different geometrical shapes including a basic cone shape,
a parabolic cone shape, a non-axisymmetric shape and a hemisphere are produced. The
geometric profiles and the thickness distributions of the formed shapes are measured to be
compared with those obtained from the developed method. The agreement between the
analytical calculation and experimental validation demonstrates the advantages of the
developed method as outlined as following:
(1) The thickness prediction method for multi-pass incremental forming processes produces
relatively accurate results for both the final geometrical shape and the corresponding
thickness distribution, for examples of the axisymmetric and non-axisymmetric parts.
(2) The stepped features due to rigid body motion during the ISF process can also be predicted
accurately by the developed method.
(3) This method is very computational efficient. It could produce the thickness distribution
prediction in minutes, much faster than the conventional FE approach.
Acknowledgement
References
1. Jeswiet J, Micari F, Hirt G, Bramley A, Duflou J, Allwood J 2005 Asymmetric Single
Point Incremental Forming of Sheet Metal. CIRP Ann Manuf Technol 54 2 88-114
2. Malhotra R, Xue L, Belytschko T, Cao J 2012 Mechanics of fracture in single point
incremental forming. J Mater Process Technol 212 7 :1573-1590
3. Ambrogio G, De Napoli L, Filice L, Gagliardi F, Muzzupappa M 2005 Application of
Incremental Forming process for high customised medical product manufacturing. J
Mater Process Technol 162-163 156-162
4. Micari F, Fratini L, Governale A, Lo Franco A, Panzeca A 2007 Incremental forming
process for the accomplishment of automotive details. Key Eng Mat, 344 559-566
5. Iseki H, Kato K,Sakamoto S 1989 Flexible Forming Method Using Ball Roller. Proc.
40th Japanese Joint Conf. for Technology of Plasticity (in Japanese) 41-44
6. Matsubara S 1994 Incremental backward bulge forming of a sheet metal with a
hemispherical head tool. Journal of JSTP 35: 1311–1316
7. Smith J, Malhotra R, Liu W. K, Cao J (2013) Deformation mechanics in single-point
and accumulative double-sided incremental forming. Int J Adv Manuf Technol
69:1185-1201
8. Duflou J.R, Callebaut B, Verbert J, De Baerdemaeker H(2007) Laser Assisted
Incremental Forming: Formability and Accuracy Improvement. CIRP Ann Manuf
Technol 56(1): 273-276
9. Fan G.Q, Sun F.T, Meng X.G, Gao L, Tong G.Q(2010) Electric hot incremental forming
of Ti-6Al-4V titanium sheet. Int J Adv Manuf Technol 49:941-947
10. Iseki H(2001) Flexible and incremental bulging of sheet metal using high-speed water
jet. JSME Int J 44(2):486-493
11. Li J.C, Hu J.B,Pan J.J, Geng P (2012) Thickness distribution and design of a
multi-stage process for sheet metal incremental forming. Int J Adv Manuf Technol
62(9-12):981-988
12. Skjoedt M, Bay N, Endelt B, Ingarao G(2008), Multi stage strategies for single point
13. Malhotra R, Bhattacharya A, Kumar A, Reddy N.V, Cao J(2011) A new methodology
for multi-pass single point incremental forming with mixed toolpaths. CIRP Ann
Manuf Technol 60(1): 323-326
14. Zhang C, Xiao H.F, Yu D.H(2013) Incremental forming path-generated method based
on the intermediate models of bulging simulation. Int J Adv Manuf Technol
67(9-12):2837-2844
15. Hussain G, Gao L(2007) A novel method to test the thinning limits of sheet metals in
negative incremental forming. Int J of Mach Tool Manuf 47(3-4):419-435
16. Kitazawa K, Nakanes M, Hemi-ellipsoidal stretch expanding of aluminum sheet by
CNC incremental forming process with two path method. J Japan Ins Light Met
47:440–445
17. Kitazawa K, S.H, Sumio Y (2001) Hemispherical stretch-expanding of aluminum sheet
by computerized numerically controlled incremental forming process with two path
method. J Japan Ins Light Met 46:219 -224
18. Van Houtte P, Van Bael A, He S, Duflou J.R, Szekeres A, Henrard C, Habraken
A.M(2005) Finite element modeling of incremental forming of aluminum sheets. Adv
Mat Res 6:525-532
19. Bambach M(2010) A geometrical model of the kinematics of incremental sheet
forming for the prediction of membrane strains and sheet thickness. J Mater Process
Technol 210(12):1562-1573
20. Duflou J.R, Verbert J, Belkassem B, Gu J, Sol H, Henrard C, Habraken A.M(2008)
Process window enhancement for single point incremental forming through multi-step
toolpaths. CIRP Ann Manuf Technol 57(1):253-256
21. Filice L(2006) A phenomenology-based approach for modeling material thinning and
formability in incremental forming of cylindrical parts. Proc. IMechE 220:1449-1455
22. He S, Gu J, Sol H, Van Bael A, Van Houtte P, Tunckol Y, Duflou J.R(2007)
Determination of Strain in Incremental Sheet Forming Process. Key Eng Mat
344:503-510
24. Fang Y, Lu B, Chen J, Xu D.K, Ou H(2014) Analytical and experimental
investigations on deformation mechanism and fracture behavior in single point
incremental forming. J Mater Process Technol 214:1503-1515