A study on Profitability position with reference to Das Limited
Dr.S.Poongavanam,Asst. Professor, AMET Business School, AMET University, Chennai ABSTRACT
The financial statement analysis
generally involves common size analysis, ratio analysis (liquidity, turnover, profitability, etc.), trend analysis and industry comparative analysis. This permits the valuation analyst to compare the company to other businesses in the same or similar industry, and to find lacunas of the company and/or the industry over time. By comparing a company’s financial statements in different time periods, the valuation expert can view growth or decline in revenues or expenses, changes in capital structure, or other financial trends.
Key words: GP ratio, NP ratio, Return on Investment & Return on Total Assets
BACKGROUND OF THE STUDY
Finance is one of the most primary requisites of a business and the modern management obviously depends largely on the efficient management of the finance. Financial statements are prepared primarily
manager in a business firm. He performs such varied tasks as budgeting, financial forecasting, cash management, credit administration, investment analysis and funds procurement. The recent trend towards globalization of business activity has created new demands and opportunities in managerial finance. Financial statements are prepared and presented for the external users of accounting information. As these statements are used by investors and financial analysts to examine the firm’s performance in order to make investment decisions, they should be prepared very carefully and contain as much investment decisions; they should be prepared very carefully and contain as much information as possible. Preparation of the financial statement is the responsibility of top management. The financial statements are generally prepared from the accounting records maintained by the firm.
Elements of financial statements
1. Asset: An asset is a resource controlled by the enterprise as a result of past events from which future economic benefits are expected to flow to the enterprise.
2. Liability: A liability is a present obligation of the enterprise arising from the past events, the settlement of which is expected to result in an outflow from the enterprise' resources, i.e., assets. 3. Equity: Equity is the residual interest in
the assets of the enterprise after deducting all the liabilities under the Historical Cost Accounting model. Equity is also known as owner's equity. Under the units of constant purchasing power model equity is the constant real value of shareholders´ equity.
The financial performance of an enterprise is primarily provided in an income statement or profit and loss account.
1. Revenues: increases in economic
benefit during an accounting period in the form of inflows or enhancements of assets, or decrease of liabilities that result in increases in equity. However, it does not include the contributions made by the equity participants, i.e., proprietor, partners and shareholders.
2. Expenses: decreases in economic
assets or incurrences of liabilities that result in decreases in equity.
OBJECTIVES OF STUDY
To study the overall profitability
position of the company.
To study the return on investment of the
firm.
To study the return on total asset ratio of
the company
NEED OF THE STUDY
o The study covers all the
components of profitability, return on investment and return on total assets
o Thus the study reveals how
effectively the financial
performance analysis used in the organization.
RESEARCH METHODOLOGY
Research methodology is a way to systematically solve the research problem. it may be understood as a science of studying how research is done scientifically. So, the research methodology not only talks about the research methods but also considers the logic behind the method used in the context of the research study. The project evaluates the
financial performance one of the company with help of the most appropriate tool of financial analysis like ratio analysis and comparative balance sheet. Hence, it is essentially fact finding study. The study is based on secondary data. Data pertaining to ratio were collected from the balance sheet and profit & loss account of Das Limited. The necessary data were obtained from published annual report. The data required for the study has been collected from secondary sources and the relevant information were taken from annual reports, journals and internet etc., Tools applied: To have a meaningful analysis and interpretation of various data collected, profitability ratio were used for this study.
LIMITATIONS
As the study is based on secondary data,
the inherent limitation of the secondary data would have affected the study.
The figures in a financial statement are
likely to be a least several months out of date, and so might not give a proper indication of the company’s current financial position.
This study need to be interpreted
show whether performance is good or bad. It requires some quantitative
information for an informed analysis to be made.
DATA ANALYSIS AND INTERPRETATION Profitability Ratios
A. Gross Profit Margin
Gross profit Gross Profit Margin = ________________ *100
Sales
TABLE -1 Gross Profit Margin
S.NO YEAR
Gross Profit Rs. in lakhs
Net Sales
Rs. in lakhs Ratio
1 1 7052.87 18262.60 38.62
2 2 7925.86 19808.5 40.01
3 3 7904.58 21612.94 36.57
4 4 9275.87 21885.20 42.38
5 5 12543.85 30087.56 41.69
CHART -1 Gross Profit Margin
Interpretation:
In the year 1, the Gross Profit Ratio was 39% but then it increased to 40%, which
shows a good profit earning capacity of the business with reference to its sales. But in the year 3, it decreased to 37% which may be due to increase in cost of production or due to sales
at lesser price. But thereafter, for the succeeding two years, it has increased considerably, which indicates that the cost of production has reduced. Therefore the Gross Profit Ratio for the five years reveals a satisfactory condition of the business.
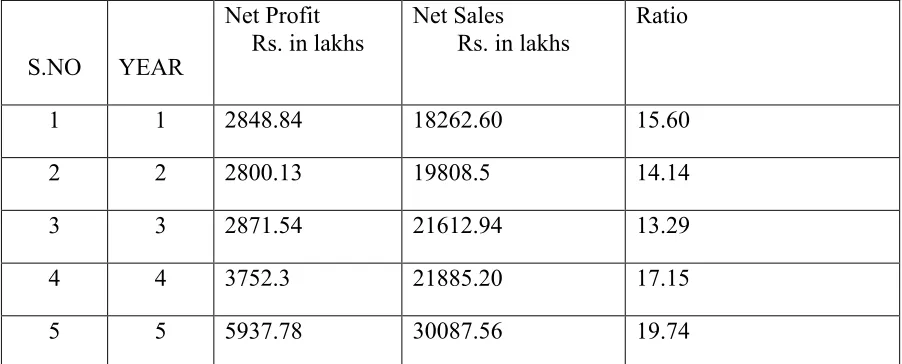
B. Net Profit Margin
Earnings after interest and taxes
Net Profit Margin =______________________________ *100 Net Sales
TABLE -2 Net Profit Margins
S.NO YEAR
Net Profit Rs. in lakhs
Net Sales Rs. in lakhs
Ratio
1 1 2848.84 18262.60 15.60
2 2 2800.13 19808.5 14.14
3 3 2871.54 21612.94 13.29
4 4 3752.3 21885.20 17.15
5 5 5937.78 30087.56 19.74
Interpretation:
In the year 1 the Net Profit is 15.60%, but in the year 1-2 it was decreased to 14.14 and 13.29. It may due to excess selling and distribution expenses. But thereafter for the succeeding years it has been increasing which indicates a
better performance of the company. Therefore the performance of the management should be appreciated. Thus an increase in the ratio over the previous periods indicates improvement in the operational efficiency of the business.
C. Return on Investment (ROI)
Operating profit Return on Investment =_________________
Capital Employed
TABLE-3 Return on Investment (ROI)
S.NO YEAR
Operating Profit
Rs. in lakhs
Capital Employed Rs. in lakhs
Ratio
1 1 2531 35803 7.07
2 2 2434 33355 7.30
3 3 2437.54 32556.72 7.49
4 4 3190.73 35637.92 8.95
5 5 4733.93 36999.30 12.79
CHART-3 Return on Investment (ROI)
Interpretation:
This ratio indicates that how much of the capital invested is returned in the form of net profit. This ratio is increasing year after year which indicates the capital employed is returned in the form of net profit. In the same
manner, returns from capital employed for the succeeding years are good. Thus, the Return on Investment ratio for the five years shows the efficiency of the business which is very much satisfactory.
D. Return on Total Assets
Net profit after taxes and interest
Return on Total Assets =_________________________________ *100 Total assets
TABLE-4 Return on Total asset
S.NO YEAR
Net Profit after Tax
and interest Rs. in lakhs
Total asset Rs. in lakhs
Ratio
1 1 2848.84 35156.63 8.10
2 2 2800.13 32593.54 8.59
3 3 2871.54 32556.72 8.82
4 4 3752.3 35637.92 10.53
5 5 5937.78 36999.3 16.05
CHART-4 Return on Total asset (ROE)
Interpretation:
The return on total asset ratio is increasing year after year. This increases ratio indicates the funds are invested effetively. Therefore the return on total asset ratio for the five years reveals a satisfactory condition of the business.
FINDINGS
The proprietary ratio in all the five years is
above the satisfactory level, that is, 50%. It indicates the creditors are in a safer side and there is no pressure from them.
The debt to equity ratio is decreasing year
after year, which indicates , the servicing of debt is less burdensome and consequently its credit standing is not adversely affected.
The Net Profit for the five years has been
increasing which shows that the selling and distribution expenses are under control and there is a good operational efficiency of the business concern.
CONCLUSION
The study is made on profitability position of the company based on five years data collected from DAS Limited. The profitability ratio indicates that profitability position DAS Ltd. Is good whereas debt equity and proprietary ratios shows the long term financial position. Similarly, profitability ratios are helpful in evaluating the efficiency of performance in DAS Ltd.
REFERENCES
[1] Deepali Kapoor Suri (2013) VSRD
International Journal of Business and Management Research, Volume-3, No: 6.
[2] Dr.P.S. Vohra, ACTA university
agriculture at silk at silk culture business, Volume -59, No: 1.
[3] Mabwe Kumbirai and Robert Webb,
African Review of Nepalese Business Studies, Volume-1, No: 1.
[4] Ramachandran Azhagaiah (2012)
International center for Business Research, Volume-1, No: 3.
[5] R.Ramachandran & R.Srinivasan,
Management Accounting, Sriram Publications, Trichy.
[6] Dr. M. Sheik Mohaned, Dr. E.Mubarak
Ali, Dr. M.Abdul Halleem, (2012).
Management Accounting - -Raja publications.
[7] R.S.N. Pillai, Bagavathi (2005).