White Rose Research Online URL for this paper:
http://eprints.whiterose.ac.uk/86841/
Version: Accepted Version
Article:
Chandler, D.M. and Lerner, D.N. (2015) A low cost method to detect polluted surface water
outfalls and misconnected drainage. Water and Environment Journal, 29 (2). 202 - 206.
ISSN 1747-6585
https://doi.org/10.1111/wej.12112
This is the peer reviewed version of the following article: Chandler, D.M. and Lerner, D.N.
(2015) A low cost method to detect polluted surface water outfalls and misconnected
drainage. Water and Environment Journal, 29 (2). 202 - 206, which has been published in
final form at http://dx.doi.org/10.1111/wej.12112. This article may be used for
non-commercial purposes in accordance with Wiley Terms and Conditions for
Self-Archiving.
[email protected] https://eprints.whiterose.ac.uk/ Reuse
Unless indicated otherwise, fulltext items are protected by copyright with all rights reserved. The copyright exception in section 29 of the Copyright, Designs and Patents Act 1988 allows the making of a single copy solely for the purpose of non-commercial research or private study within the limits of fair dealing. The publisher or other rights-holder may allow further reproduction and re-use of this version - refer to the White Rose Research Online record for this item. Where records identify the publisher as the copyright holder, users can verify any specific terms of use on the publisher’s website.
Takedown
If you consider content in White Rose Research Online to be in breach of UK law, please notify us by
A low cost method to detect polluted surface water outfalls
1
and misconnected drainage.
2
3
David Chandler and David N Lerner
4
Civil & Structural Engineering, University of Sheffield
5
6
Abstract: Sewer misconnections lead to discharge of wastewater direct to rivers and
7
streams. They are difficult to detect due to their intermittent discharges and the wide range
8
of compounds which can be discharged. Optical brighteners are strong indicators of the
9
presence of sewer misconnection discharge in surface water sewers, representative of many
10
components of misconnections, and easily identified. The authors have developed and tested
11
a promising method to identify optical brighteners in sewer systems using inexpensive
12
passive samplers and a simple analysis method. The method is used to identify large areas of
13
four sewer systems which are polluted with misconnection discharge. Limited validation
14
shows that the method successfully indicated diffuse pollution in the surface water sewer
15 system. 16 17
1 Introduction
18Polluted surface water outfalls (PSWOs) can be major sources of faecal indicator organisms
19
(O'Keefe et al., 2005), nutrients, and toxic compounds (Environment Agency, 2007; UKWIR,
20
2012), which can significantly impact receiving waters. Sewer misconnections are the
21
connection of grey or foul water drains to surface water sewers, leading to direct discharge
22
of untreated wastewater to rivers and streams. They are a key contributor of pollution to
23
PSWOs, and can discharge a wide range of pollutants (UKWIR, 2012; Ellis, 2013).
24
Misconnections discharge intermittently and therefore pose problems for monitoring, as
25
impacts may only be observed during discharge.
26 27
Monitoring PSWO effluents generally takes the form of either spot sampling, taking an instant
28
sample at a point which can be stored for later analysis, or continuous monitoring, placing a
29
sampler or sensor in situ which will collect samples over time. Passive sampling allows
30
integrated sampling for indicators over time without producing individual data points. Due to
31
the intermittent nature of misconnection discharges, continuous monitoring or passive
32
sampling are the most promising methods to identify these discharges, as spot sampling will
33
only identify effluent if it is present at the time of sampling.
34 35
Commonly monitored components include nutrients, sewer solids, bacterial growth,
36
biochemical oxygen demand (BOD), ammonia, phosphorus and pH, among others
37
(Environment Agency and Water UK, 2014). These components are present in a wide range of
38
discharges, and so the value of them for specifically identifying and tracing misconnection
39
discharges is limited. Though misconnections discharge a wide variety of pollutants which
40
could be used as indicators, such as triclosan or tryptophan, these are not expected to be
41
present in many discharges, and can be expensive to monitor, therefore limiting their
42
functionality as indicators.
43 44
Optical brighteners (OBs) are a promising indicator of misconnection effluent in surface
45
water sewers, as they are found in many components of effluents, including discharge from
46
washing machines, sinks, and toilets. This paper presents the first UK trial of an inexpensive,
47
simple, passive sampler for OBs in surface water sewers.
2 Current and developing practice
50
51
Aesthetic indicators such as turbidity, sewage fungus, and solids are common results of
52
polluted discharge, which are easily identified and develop quickly following exposure to
53
polluted discharge (Hickey, 1988; Pitt et al., 2004). These are either observed on natural
54
substrates, or can be sampled in sewers using caging to trap solids (Environment Agency and
55
Water UK, 2014). However visual indicators are not always present in misconnection
56
discharge, and are not uniquely a result of misconnection discharges, they can be present as
57
a result of other inputs to sewer systems, and therefore do not definitively indicate the
58
presence of misconnections on a sewer system.
59 60
Distributed temperature sensing uses fibre optic cables, temporarily inserted into sewer
61
systems, to detect changes in temperature of water entering sewer systems (de Haan et al.,
62
2011). This can be very time-efficient, but is also expensive at around !10-12 (Approximately
63
£8-9) per meter of sewer tested including analysis costs (Schilperoort et al., 2013). This also
64
requires considerable technical knowledge to operate the temperature sensor (Hoes et al.,
65
2009). While this method is rarely used at present, if costs can be reduced it may become
66
more widely accessible.
67 68
Passive water chemistry samplers can be used in rivers to observe changes in concentrations
69
of chemicals over time periods from days to months (Namiesnik et al., 2005; Vrana et al.,
70
2005; Zhang and Davison, 2000). These are inexpensive, do not require external power, and
71
do not require regular maintenance (Zabiegala et al., 2010), however they have not been
72
tested for monitoring misconnection effluents, and may only be sufficiently sensitive to
73
identify large, or constant, discharges.
74 75
Dye testing involves pouring fluorescent dye into appliances in households, which can then
76
be detected in the surface water sewer system if the appliance is misconnected (Hoes et al.,
77
2009; Environment Agency and Water UK, 2014). Dye testing is only used once a region of the
78
sewer system suffering from misconnections is identified using other methods, as it is a
79
relatively slow process, visiting individual properties to perform testing. However, this is the
80
only method at present which unambiguously identifies specific appliances which are
81
discharging to the surface water system, and therefore is needed in the final stage of
82
misconnection correction actions.
83 84
Further information on these and other less commonly used methods for tracing and
85
correcting sewer misconnections in the UK and USA can be found in Environment Agency
86
and Water UK (2014) and Center for Watershed Protection and Pitt (2004) respectively.
87 88
3 Passive sampling for optical brighteners
89 90
3.1 Method
91 92
Optical brighteners (OBs) are chemicals which fluoresce under ultraviolet (UV) light and do
93
not occur naturally in the environment. They have a high affinity for fabrics such as cotton,
94
and are commonly used in laundry detergents, toilet paper, and cleaning products (Burres,
95
2011). These are components which are expected to be present in the majority of
96
misconnection effluents (UKWIR, 2012). OBs have been used to identify illicit discharge to
97
surface water sewers (Braun, 2011), usually using a fluorometer to measure the fluorescence
98
of discharged water. Fluorometers are relatively inexpensive, though they require flow in the
99
sewer, so will not detect a response if there is no flow or no optical brighteners discharged
at the time of sampling. Therefore the ability to identify intermittently discharged
101
misconnection effluents is limited. To overcome this limitation, an in situ passive method has
102
been tested and developed to identify misconnection effluents in the field using OB free
103
tampons as a sorbent to collect OBs.
104 105
Laboratory testing was performed to determine concentrations of detergent at which
106
fluorescence would be observed. Twenty five microliters of detergent, the smallest volume
107
which could accurately be measured, were added to 25 litres of tap water. A tampon was
108
submerged in the container for 5 seconds. OBs adsorbed to the tampon immediately, and
109
were still identifiable up to 30 days after initial exposure (figure 1). Modern washing
110
machines discharge between 29 and 144 litres of water per use, with an average of 77 litres
111
(Australian government WELS 2014). This equates to roughly 0.65ml of detergent per litre of
112
discharged water if manufacturers recommendations for the volume of detergent used in an
113
average laundry load are used. This therefore means that even with a 300 times dilution in
114
the sewer pipe, which is far beyond anything which could be expected from normal sources,
115
polluted discharge would still be observable.
116 117
For sampling OBs in situ, tampons were fixed in surface water sewers, either by tying to a
118
suitable point in the sewer, or tied to lengths of bamboo cane which could then be wedged in
119
the sewer so that they lay in the invert of the sewer out of direct sunlight to avoid photo
120
decay of optical brighteners. If there was flow in the sewer at the time of sampling, the
121
tampon was briefly exposed to the flow and tested for fluorescence on site using an
122
inexpensive UV light, if suitable darkness could be achieved to accurately identify
123
fluorescence. However sufficient darkness could not be achieved in the field during this trial,
124
so samples were transferred to the lab for testing. If a positive response was not observed
125
instantly, tampons were left in situ for a three day period, to ensure polluted discharge was
126
not missed. Three days was empirically found to be the optimum time to leave a sample in
127
place to avoid fouling, but ensure a good exposure time, with five and seven days exposure
128
leading to considerable fouling of the samples. When samplers were removed from the
129
sewers, they were placed in individual zip-lock bags and stored in darkness to avoid
130
contamination between samples and photodecay of OBs until samples could be exposed to a
131
UV light to test for fluorescence. The cost of initial purchase of raw materials (UV light,
132
cotton, apparatus to attach them in place) in this investigation was approximately 20 pence
133
per sampler.
134 135
3.2 Field trial
136 137
Sampling was performed in 16 surface water sewer outfalls across three catchments in the
138
Sheffield area in March 2013. Nine of the 16 outfalls were indicated as discharging OBs. Four
139
sewer systems were further investigated using the method in accessible manholes to trace
140
OB containing effluent to its source. Samplers were returned to the laboratory and tested
141
for OBs using an inexpensive 365nm UV light. Where OBs were found below a section of
142
sewer, but not above it, a misconnection was indicated between the two points, and
143
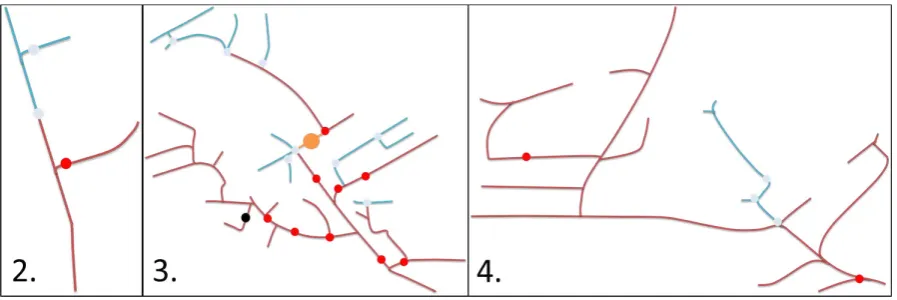
therefore an area of the system to be dye tested could be identified (figures 2 and 3).
144 145
The method successfully identified areas of the sewer systems in which further investigation
146
using dye and visual misconnection inspection could be performed. This significantly
147
reduced the area in which detailed investigation was required, and thus reduced cost of
148
follow up investigations. Samples corroborated well, with indicated misconnected points
149
joining up, and correctly connected points joining up. The method showed only one conflict
150
over four catchments where a sewer was indicated as correctly connected at one point, but
151
misconnected further up the catchment (figure 3).
153
Visual inspection of properties was performed in part of sewer system 3 (figure 3). A sink
154
and a soil stack were found misconnected in this area. These misconnections were
155
corrected, though additional sampling could not be performed, to determine whether other
156
misconnection problems existed in the system after correction, due to budgetary
157
constraints.
158 159
3.3 Practical issues
160 161
When large quantities of suspended solids are present in sewer systems, tampon samplers
162
can become fouled, and fluorescence masked to the extent that if OBs are present,
163
fluorescence is not observable. Once significantly fouled, washing the sampler did not
164
remove enough of these solids to allow analysis to be performed on the sampler. A
165
shortened period of exposure reduced the risk of this problem, however to ensure the same
166
exposure period as samplers on other outfalls, samplers were replaced more frequently,
167
which increased the cost for those points.
168 169
At some sewer outfalls, samplers were vandalised by members of the public. This only
170
occurred when sampling outfalls, and only at sites which were close to footpaths, even
171
though they were generally not visible from the footpath. This may be avoided by inserting
172
the samplers further into the outfall, though in the present study this was not possible
173
without contravening health and safety requirements.
174 175
There is a risk of misinterpretation of fluorescence due to the presence of oil (Lambert et al.,
176
2003) or surface discharges of OB containing compounds, such as from car washing with
177
soaps, though these still indicate an abuse of the system and so are important to identify as
178
they cause polluted discharge to the receiving water. Oil, which also should not be present in
179
the surface water sewer system, will leave a coating on the sampler, and therefore should be
180
easily identified. Surface discharge of OB containing compounds are not expected to be a
181
frequent occurrence, but may cause confusion where they do occur.
182 183
The major limitation of the method is that some misconnections may not discharge
184
compounds containing OBs, and therefore will not be detected using the method. Combining
185
the optical brightener method with other established methods, such as visual inspection
186
methods, allows an integrated sampling strategy so that a weight of evidence approach can
187
be taken to identify systems which require further investigation.
188 189
3.4 Further development
190 191
This study demonstrated that the method successfully identified misconnection discharge in
192
surface water sewer systems, however budget limitations prevented full validation of the
193
sewer systems from being performed. The next development of the method should be to
194
perform a full validation of the method, including full tampon sampling throughout several
195
sewer systems, and thorough dye testing to ensure that where misconnections are indicated,
196
they are found, and where they are not indicated, they are not found. This would give a
197
better indication of the accuracy of the method and may discover methodological
198
improvements which may in turn change costs.
199 200
Following thorough method validation, the main improvement which could be made to the
201
method is to develop a way to protect the sampler from sewer solids. Fouling is a major
202
problem for the method at present, limiting the time that samplers can be left in situ, yet it is
203
one of the easiest limitations to overcome. Solving this may require development of a
protective barrier to block solids, or a cleaning process to clean off solids, and leave OBs in
205
place on the sampler. This would reduce the number of visits required, and therefore reduce
206
costs of sampling, though it would increase the cost of individual samplers.
207 208
4 Conclusion
209 210
This paper presents the first UK investigation of an inexpensive and simple passive method to
211
identify sewer misconnection effluents using cotton samplers onto which optical brighteners
212
bind. The method successfully identified optical brighteners in surface water sewer systems,
213
and limited validation showed misconnections were present where they were indicated.
214
Further development may improve the method and either increase or decrease the current
215
low costs. This proved a very promising method for identifying sewer misconnections and
216
other diffuse pollution discharge to surface water sewer systems. Pending further validation,
217
this is recommended for investigation of sewer misconnections in surface water sewer
218
systems.
219 220
Acknowledgements: The authors thank Yorkshire Water and the Environment Agency for
221
their technical support. Field testing of the method throughout sewer catchments was
222
performed by technical staff at Yorkshire Water. Funding was provided by Yorkshire Water
223
and the EPSRC.
224 225
References
226
Australian government water efficiency labelling and standards scheme (WELS) (2014)
227
www.waterrating.gov.au accessed 20/11/2014.
228 229
Braun, D. (2011), Illicit discharge detection and elimination in six missisquoi river basin
230
communities, Technical report, Stone Environmental Inc.
231 232
Burres, E. (2011), Measuring optic brighteners in ambient water samples using a fluorometer.,
233
Technical Report Standard operating procedure 3.4.1.4.
234 235
Center for Watershed Protection and Pitt, R. (2004), Illicit discharge detection and
236
elimination, Technical report.
237 238
de Haan, C., Langeveld, J., Schilperoort, R. and Klootwijk, M. (2011), `Locating and classifying
239
illicit connections with distributed temperature sensing', 12th international conference of
240
urban drainage, Porto Alegre/Brazil, 11-16 September 2011 .
241 242
Ellis, J. B. (2013), `Misconnections to surface water sewers in England and Wales: Are they a
243
serious problem?', Proceedings of the 7th international conference on sewer processes and
244
networks, Sheffield pp. 449-456.
245 246
Environment Agency (2007), The unseen threat to water quality - diffuse water pollution in
247
England and Wales report, Technical report.
248 249
Environment Agency and Water UK (2014), Investigation and rectification of drainage
250
misconnections - good practice document, Technical report, Chartered institute of
251
environmental health.
252 253
Hickey, C. W. (1988), `River oxygen uptake and respiratory decay of sewage fungus biofilms',
254
Water Research 22(11), 1375-1380.
Hoes, O. A. C., Schilperoort, R. P. S., Luxemburg, W. M. J., Clemens, F. H. L. R. and van de
257
Giesen, N. C. (2009), `Locating illicit connections in storm water sewers using
fiber-258
opticdistributed temperature sensing', Water Research 43(20), 5187-5197.
259 260
Lambert, P., Goldthorp, M., Fieldhouse, B., Wang, Z., Fingas, M., Pearson, L. and Collazzi, E.
261
(2003), `Field fluorometers as dispersed oil-in-water monitors', Journal of Hazardous
262
Materials 102(1), 57-79.
263 264
Namiesnik, J., Zabiegala, B., Kot-Wasik, A., Partyka, M. and Wasik, A. (2005), `Passive sampling
265
and/or extraction techniques in environmental analysis: A review', Analytical and
Bio-266
analytical Chemistry 381(2), 279-301.
267 268
O'Keefe, B., D'Arcy, B. J., Davidson, J., Barbarito, B. and Clelland, B. (2005), Urban diffuse
269
sources of faecal indicators, Vol. 51, pp. 183-190.
270 271
Pitt, R., Chaturvedula, S., Karri, V. and Nara, Y. (2004), `Source verification of inappropriate
272
discharges to storm drain systems', Proceedings of the Water Environment Federation
273
WEFTEC 2004(1-10), 1192-1218.
274 275
Schilperoort, R., Hoppe, H., deHaan, C., and Langeveld, J. (2013) `Searching for storm water
276
inflows in foul sewers using fibre-optic distributed temperature sensingÕ, Water Science and
277
Technology 68(8), 1723-1730.
278 279
UKWIR (2012), `Sewer misconnections - what is the true non-agricultural diffuse water
280
pollution impact?', UK Water Industry Research Limited .
281 282
Vrana, B., Allan, I. J., Greenwood, R., Mills, G. A., Dominiak, E., Svensson, K., Knutsson, J. and
283
Morrison, G. (2005), `Passive sampling techniques for monitoring pollutants in water', TrAC
284
Trends in Analytical Chemistry 24(10), 845-868.
285 286
Zabiegala, B., Kot-Wasik, A., Urbanowicz, M. and Namiesnik, J. (2010), `Passive sampling as a
287
tool for obtaining reliable analytical information in environmental quality monitoring',
288
Analytical and Bio-analytical Chemistry 396(1), 273-296.
289 290
Zhang, H. and Davison, W. (2000), `Direct in situ measurements of labile inorganic and
291
organically bound metal species in synthetic solutions and natural waters using diffusive
292
gradients in thin films', Analytical Chemistry 72(18), 4447-4457.
FIGURES
294 295
296 297 298
Figure 1. Samplers exposed to UV light to detect fluorescence. A. Fluorescing tampon
299
sampler. B. Non-fluorescing tampon sampler.
304 305
Figure 2: Sewer system 1, Sheffield. Red dots indicate manholes where optical brighteners
306
were detected with tampons and pale blue dots where none were detected.
[image:9.595.76.434.69.676.2]310
Figure 3: Sewer systems 2, 3 and 4, Sheffield. Colour coding as Figure 2. The black circle in
311
sewer system 3 indicates where validation has been performed and misconnections
312
observed. The orange circle in sewer system 3 indicates where a conflict was observed
313
between upstream and downstream samples.
314