heat exchangers of thermoacoustic systems
.
White Rose Research Online URL for this paper:
http://eprints.whiterose.ac.uk/93001/
Version: Accepted Version
Proceedings Paper:
Ilori, OM, Mao, X and Jaworski, AJ (2015) Numerical simulation of oscillatory flow and heat
transfer in the heat exchangers of thermoacoustic systems. In: Proceedings of ICR2015.
ICR2015 : The 24th IIR International Congress of Refrigeration, 16-22 Aug 2015,
Yokohama, Japan. International Institute of Refrigeration .
[email protected] https://eprints.whiterose.ac.uk/
Reuse
Unless indicated otherwise, fulltext items are protected by copyright with all rights reserved. The copyright exception in section 29 of the Copyright, Designs and Patents Act 1988 allows the making of a single copy solely for the purpose of non-commercial research or private study within the limits of fair dealing. The publisher or other rights-holder may allow further reproduction and re-use of this version - refer to the White Rose Research Online record for this item. Where records identify the publisher as the copyright holder, users can verify any specific terms of use on the publisher’s website.
Takedown
If you consider content in White Rose Research Online to be in breach of UK law, please notify us by
NUMERICAL SIMULATION OF OSCILLATORY FLOW AND HEAT
TRANSFER IN THE HEAT EXCHANGERS OF THERMOACOUSTIC
SYSTEMS
Olusegun M. ILORI, Xiaoan MAO, Artur J. JAWORSKI
Faculty of Engineering, University of Leeds, Leeds LS2 9JT, United KingdomABSTRACT
The design of appropriate heat exchangers is an essential requirement for the development of next generation of thermoacoustic systems. In this study, RANS method with SST k- turbulence model was applied to solve the time-dependent turbulent Navier-Stokes and energy equations for oscillating flow and heat transfer conditions in three individual but similar parallel plate heat exchangers, arranged in series and positioned in an oscillating helium gas environment. The numerical code is validated by comparing the low amplitude oscillating flow results to the analytical solutions found in the literature. The effects of pressure oscillation on the velocity and temperature distributions are discussed in detailed with respect to the channels’ entrance and exit edge shapes of the heat exchangers. Three types of edge shapes, blunt, cone and ogive, in this study influence the oscillating flow behaviour and heat transfer condition differently at the entrance and exit of the heat exchanger channels.
1.
INTRODUCTION
Central to the efficiency of energy systems such thermoacoustic engine and cooler are appropriately designed heat exchangers, because of the potential gain in the thermodynamic efficiency which could result from such an improved design. This is all-important considering the extensive areas of application of an efficient thermoacoustic system, such as in the area of economic electricity production, gas liquefaction and regasification, electronic cooling, space application etc. However, the presence of acoustically induced flow in the technology makes the design of heat exchangers a challenging task.
considered at the entrance and exit of the heat exchangers. The investigation is carried out with respect to the drive ratio in the system, defined as the ratio of mean pressure to the pressure amplitude at the antinode.
2.
NUMERICAL METHOD
[image:3.595.113.482.189.378.2]2.1. Geometrical and computational domain
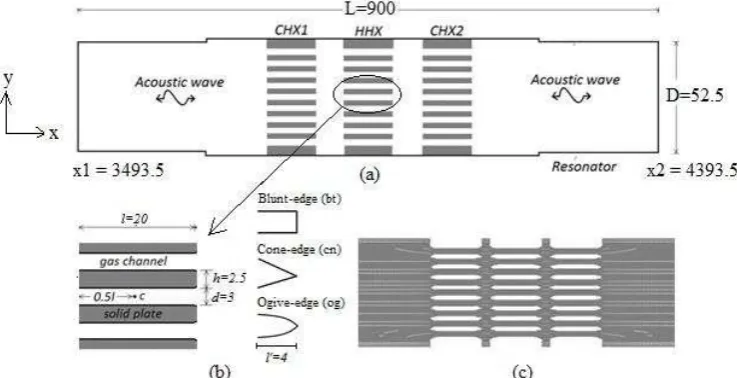
Figure 1 shows the geometry, edge shapes and the computational domain as used in this study. The geometry consists of a 2D replica of a ½-wavelength thermoacoustic set-up of Ilori et al. (2013) where three identical heat exchangers, arranged in series are being tested in an oscillating helium gas environment.
Figure 1. (a) Schematic of heat exchangers arrangement, (b) enlarged view of heat exchanger and the edge shapes (c) fine mesh in the computational domain. All dimensions are in millimetres.
In Figure 1, ‘Blunt-edge’ is the basic parallel plate with squared edge, cone-edge has 17.4o angle of inclination and ogive-edge has ogive-like shape with curvature radius r = 7mm. The edge shapes are attached to the solid plates of each heat exchanger for each simulation case to provide uniformity. Each heat exchanger has nine flow channels. Fine mesh is used everywhere in the computational domain and is chosen such that the flow structure in the heat exchangers region is not influenced by any unsteadiness in the oscillatory flow from the upstream and downstream of the core. The domain inlet and outlet are defined with respect to the pressure antinode in the experimental rig. Thermal (k) and viscous (v) penetration depths in the channel for all edge shapes, drive ratios and temperatures arek 2kmcp 0.00099 – 0.00105m,
m
v
2 0.00082 – 0.00086m, where, k[W/mK],
2
f [rad/s], m [kg/m 3], cp[J/kgK], and
[Pa.s] are the thermal conductivity, angular frequency, mean density, specific heat capacity and dynamic viscosity respectively. The operating parameters for the simulation are given in table 1.Table 1. Operating parameters as used in the CFD simulation
Parameters Values/descriptions
Medium Helium
Mean pressure, MPa 0.1
Frequency, Hz 57
Drive ratio, % 0.3Dr 2.0
CHX (1&2) surface temperature, K 273.15 HHX surface temperature, K 323.15
2.2. Physical model
0 i j u x t
(1)
m i i j i j uj j i i j i j i S u x u u x x F x p u u x t u 2 ' ' '
(2)
i
uj eff hj eff j i i S u x T k x p E u x E
t
) (
(3)
where,
ijk k eff j i i j eff uj x u x u x u 3 2
(4)
ij k k t j i i j t j i x u x u x u uu
3 2 '
'
(5)
RT
P
(6)
Equations (1)-(3) are the mass, momentum and energy equations for the RANS equation. Eq. (4) and eq. (5) are the effective stress tensor and the Reynolds Stresses term used to model momentum equation for the turbulence affected flow. Eq. (6) is the ideal gas equation. SST k- turbulence model (Menter, 1994) is used in the simulation. SST k- gave better accuracy of oscillating velocity and temperature profiles near the wall and the core within parallel-plate heat exchanger, when compared with experimental data (Mohd Saat, 2013, Shi et al. 2010). Pressure-based solver, PISO, and Second-order discretisation are used in all simulation cases. Time step of /250 was found to be sufficient for the convergence criteria for the transport and energy equations (10-5, 10-5, and 10-8). Compressibility effect was considered due to the short channels of the heat exchangers (Swift, 2001).
Temperature-dependent viscosity and thermal conductivity are defined as
68 . 0 5 10 99 . 1 o T T , 72 . 0 152 . 0 o T T k (7)
where, To is the reference temperature (300K). The inlet and outlet boundary conditions are (Swift, 2001):
) cos( ) ' cos( ) , ( 1
1 x t p k x t
p o
(8)) cos( ) ' cos( ) , ( 2
2 xt p k x t
p o
(9)) ' sin( 1 1
, kx
c p u
m o
a (10)
) ' sin( 2 2
, kx
c p u
m o
a (11)
0
2 1, x x x T (12)
0.125 Re 16 .0
a
I 0.07D (13)
The Reynolds number is defined asRea oua1,2D o. The velocity is calculated from eq. (10) and (11), and values of density and viscosity at the reference temperature. Provided the domain is sufficiently long, this approach provided solution with an excellent match to the experimental solutions. Constant temperature of 273.15K (15oC) is applied to both CHX1 and CHX2 heat exchangers walls and constant temperature of 323.15 (50oC) is applied on HHX wall. The resonator wall is modelled as adiabatic and non-slip boundary conditions are applied to all walls. Reynolds number and the normalised temperature, velocity amplitude and channel separation distance are defined as Re
uid
, (Tf Tw) (Th Tc), y dandU u ui respectively, where ui,Tf,Tw,Th,Tc, and y [mm] are the velocity amplitude at the CHX2 channel inlet, local fluid temperature, local wall temperature, reference hot and cold temperatures in the domain, and vertical distance in the channel respectively.3.
RESULTS AND DISCUSSION
3.1. Mesh convergence study
In order to characterise the required spatial discretisation and ascertain the independency of mesh on the simulation results (Rochie 1994), a systematic mesh refinement study was conducted before the detailed simulation study. Details of the study can be found in Ilori et.al (2014). M1, M2, M3 and M4 are the mesh sizes of 43348, 70376, 113979, and 179140 respectively. A total of 113979 cells was used with y+ below 1 everywhere in the wall region having the maximum value of 0.327 i.e. y+ < 1. Heat exchangers with ogive-edge shape were used for the convergence study and approximate mesh counts were subsequently used for the two other edge shapes (blunt and cone). Figure 2a gives the definition of flow directions and phase () in the acoustic cycles for velocity, pressure, and displacement amplitudes, while Figure 2b shows the sensitivity of the solution to the mesh refinement in terms of the axial velocity amplitude at central location ‘c’ in the CHX2 (Figure 1). Having established solutions that are mesh independent, the mass flow rate through the domain was also monitored to further establish the convergence of the solution.
(a)
(b)
Figure 2: (a) definition of flow direction and the relationship between the pressure, velocity and gas displacement amplitudes (b) Axial velocity amplitudes distribution at the centreline location in the CHX2 at
0.3% drive ratio with respect to mesh sizes.
3.2. CFD solution validation
The analytical expression for the axial velocity amplitude of an oscillatory laminar flow (Dr 0.3%) in a channel of parallel plates with blunt edges is given as (Swift, 2001).
i t
v o
v o c
e y
i y y i u
t y
u
cosh 1
1 cosh 1 Re ) , (
1 (13)
where uc, and yoare the velocity amplitude at centreline location in CHX2, and the half channel distance.
0
[image:6.595.187.410.140.288.2]y at the central channel of HHX and yo d 2. Figure 3 shows the analytical and simulation results for the axial velocity amplitude at the centreline location in CHX2 using the blunt edge shape configuration at 0.3% drive ratio. The plot shows a good match between the theoretical and the predicted solution which confirms the validity of the simulation method.
Figure 3: Axial velocity at centreline location in the CHX2 at 0.3% drive ratio.
3.3. Effect of edge shape on velocity profile
Summary of simulation results is given in table 3. Fluid flow characteristics are related to change in the velocity profiles. The effects of plate edge on velocity profiles within the heat exchangers channel at all the drive ratios (0.3 – 2.0%) are shown in Figure 4.
Table 3. Summary of the simulation results for all edge shapes r
D (%) Blunt Cone Ogive
bt i
u
, (m/s)T (K)
Re cn i
u
, (m/s)T (K)
Re og i
u
, (m/s)T (K)
Re
0.3 4.33 313.71 106 3.90 307.54 96 4.07 310.85 100 0.65 9.32 314.92 228 8.19 317.87 201 8.60 317.26 211 1.0 14.22 313.52 348 13.46 313.37 330 13.69 314.01 336 1.5 21.69 310.77 532 19.89 311.07 487 20.69 311.40 507 2.0 27.42 310.48 672 26.38 311.24 646 26.93 310.51 660
The corresponding displacement amplitudes ( u ) at different drive ratios range from 12 – 76.56mm, 10.89 – 73.66mm, and 11.37 – 75.21mm for blunt, cone and ogive edge shapes respectively. The results presented here are taken at inlet location of the CHX2 at 5mm into the channel (Figure 1b), taken the length of the edge shapes into consideration. The choice of this location is basically to determine the extent of influence of the edge shape on flow and heat transfer through the velocity and temperature profiles at that location. Other locations could as well be considered if such is desired. For clarity sake, the influence of edge shape on velocity profile at the inlet of the channel are compared at eight different phases, 1, 4, 7, 10,
11, 14, 17, and 20 for all edge shapes. Taking a close look at the results suggests the effectiveness of the edge shape on the flow structure at the entrance and exit of the channels. At all drive ratios cone edge shape appears to be most effective by reducing the velocity amplitudes to the values below that of blunt and ogive edge shapes. This is an indication that the presence of these edge shapes minimised the turbulent effects in the flow. The velocities in Table 3 give Reynolds numbers that range from 106 – 672, 100 – 660 and 96 – 646 for the three plate edges respectively. As can be seen from the plots in Figure 4, at drive ratios 0.3 – 2.0%, flow symmetry is not present for all the edge shapes, though the reduction in the velocity amplitude due to the presence of ogive and cone edge shapes can be seen from the profiles except for phases 10 and
20 respectively. The asymmetric profiles are more noticeable at the suction stage for all drive ratios and edge shapes but the fluid moves at higher velocity causing large gas displacement during the ejection stage.
[image:6.595.121.478.394.519.2]Figure 4: velocity profiles at inlet channel of CHX2 for all drive ratios (0.3 – 2.0%) and edge shapes – blunt, cone and ogive.
3.4.
Effect of edge shape on temperature distribution
The effect of temperature is examined through the temperature profiles presented in Figure 5. The temperature profiles for all drive ratios and edge shapes at eight different phases within one acoustic flow cycle similar to that of velocity profiles are shown. The instantaneous temperature is shown as a function of phases in the acoustic cycle, normalised by the wall, reference hot and cold temperatures. The edge shapes clearly reduce the maximum fluid temperature at the inlet into the CHX2 at the drive ratio of 0.3%. The blunt edge shape gave the highest temperature value followed by the ogive and the cone edge shapes. This indicates that when the gas velocity amplitudes are lower, higher fluid temperature is experienced. At higher drive ratio of 0.65%, cone edge shape gave the highest fluid temperature followed by the ogive and the blunt edge shapes. The temperatures at this drive ratio are the highest for all drive ratios. At 1.0% and 1.5% drive ratio, ogive edge gave highest fluid temperature value, while at 2.0%, cone edge gave the highest temperature value. At drive ratios 1.5% and 2.0%, blunt edge gave the lowest temperature values, while cone edge gave lowest at the 1.0% drive ratio. From the temperature profiles in Figure 5, it is thus clear that the edge shapes have influenced the heat transfer in the heat exchanger channel but a further analysis is required to make a final conclusion on the role played by each edge shape.
Dr = 0.3% Dr = 0.3%
Dr = 0.65% Dr = 1.0%
Figure 5: Temperature profiles at the inlet channel of CHX2 for all drive ratios (0.3 – 2.0%) and edge shapes
– blunt, ogive and cone
4.
CONCLUSION
This paper studies fluid flow and heat transfer performance of thermoacoustic parallel-plate heat exchangers under oscillatory flow conditions using 2D CFD simulation approach. The effects of entrance and exit shapes of the heat exchangers on velocity and temperature are examined with respect to different drive ratios. It is observed that there is a fluid flow variation, specifically the velocity amplitude, as a function of phase within the acoustic cycle. This flow variation can be minimised when ogive and cone edge shapes are used at the entrance and exit of the flow channel. The results suggest the possible role of edge shapes on temperature values at the inlet into the heat exchanger channel but further analysis will be required in order to give a conclusive remark. Generally, the presence of edge shapes helps to reduce the complexity in flow that results from the discontinuity of the geometry as related to thermoacoustic system. Future work will consider the plate-edge effect on flow separation at the edges of the heat exchanger and the results of temperature effects
Dr = 0.3% Dr = 0.3%
Dr = 0.65% Dr = 1.0%
in terms of dimensionless correlations. Additional plate-edge shapes will also be studied to further explore the possibility of using plate-edge for the improvement of thermoacoustic system.
5.
ACKNOWLEDGEMENT
Olusegun M. Ilori acknowledges the financial support from the Petroleum Technology Development Fund (PTDF), Nigeria, under the award number PTDF/E/OSS/PHD/IMO/395/11. Artur J. Jaworski would like to acknowledge the Royal Society for the support under Royal Society Industry Fellowship Scheme. This work was undertaken on ARC2, part of the HPC facilities at the University of Leeds.
6.
REFERENCES
Aben, P.C.H., Bloemen, P.R., and Zeegers, J.C.H. 2009, 2-D PIV Measurement of Oscillatory Flow Around Parallels, Experimental Fluids, 46: 631-431.
ANSYS Fluent 14.5.7, 2013, “User Manual,” ANSYS Inc.
Ilori O. M., Mao, X., and Jaworski, A. J., 2013, Design of Thermoacoustic Rig for the Analysis Thermal and Hydraulic Performance of Heat Exchangers in Oscillatory Flow, Proceedings of the World Congress on Engineering, London, U.K, 3: 1669-1674.
Ilori, O.M, Mao, X., Jaworski, A.J. 2014, CFD-Simulation of Oscillatory Flow Around the Heat Exchangers of Thermoacoustic Devices, Proc. of the ASME 2014 International Mechanical Engineering Congress & Exposition: IMECE2014-37926.
Jaworski, A. J., Mao, X., Mao X., and Yu, Z. 2009, Entrance Effects in the Channels of the Parallel Plate Stack in Oscillatory Flow Conditions, Experimental Thermal and Fluid Science, 33(3): 495-502.
Kamsanam W., Mao. X., and Jaworski, .A. J., 2012, Heat Transfer Performance of Finned-Tube Thermoacoustic Heat Exchangers in Oscillatory Flow, Proceedings of 19th international Congress on Sound and Vibration, Vilnius, Lithuania, 2: 2588-2595.
Marx, D., Bailliet, H., and Valiere, J. 2008, “Analysis of the Acoustic Flow at an Abrupt Change in Section
of an Acoustic Waveguide Using Particle Image Velocimetry and Proper Orthogonal Decomposition,” Acta
Acustica United with Acustica, 94(4): 54 – 65.
Menter, F. R. 1994, Two-Equation Eddy-Viscosity Turbulence Models For Engineering Applications, AIAA Journal, 32(8): 1598-1605.
Merlki P., and Thomann, H., 1975, Transition in Oscillating Pipe Flow, Fluid Mech., 68(3): 567-575.
Mohd Saat, F.A.Z., 2013, Numerical Investigations of Fluid Flow and Heat Transfer Processes in the Internal Structures of Thermoacoustic Devices, PhD Thesis, Dept. of Eng., Univ. of Leicester, UK.
Morris, P.J., Boluriaan, S., and Shieh, V.M. 2004, Numerical Simulation of Minor Losses Due to a Sudden Contraction and Expansion in High Amplitude Acoustic Resonators, ACTA Acoustica United with Acustica, 90: 393-409.
Piccolo, A. and Pistone, G. 2006, Estimation of Heat Transfer Coefficients In Oscillating Flows: The Thermoacoustic Case. International Journal of Heat and Mass Transfer, 49 (9-10): 1631-1642.
Roache, P. J. 1994, Perspective: A Method for Uniform Reporting of Grid Refinement Studies, Transactions-American Society of Mechanical Engineers, Journal of Fluids Engineering, 16: 405-405.
Shi, L., Mao, X. and Jaworski, A.J. 2010, Application of Planar Laser-Induced Fluorescence Measurement Techniques to Study The Heat Transfer Characteristics of Parallel-Plate Heat Exchangers in Thermoacoustic Devices. Measurement Science and Technology, 21 (11): 115405.
Smith, B. L, and Swift, G. W. 2003, Power Dissipation and Time-Averaged Pressure in Oscillating Flow Through a Sudden Area Change, J. Acoust. Soc. Am. 113 (5): 2455-2463
Swift, G. W. 2001, “Thermoacoustics: A Unifying Perspective for Some Engines and Refrigerators,” Los
Alamos National Laboratory, (Fifth Draft, LA-UR 99-895).
Versteeg, K., and Malalasekera, W. 2007, An Introduction to Computational Fluid Dynamics: The Finite Volume Method, 2nd edition, England: Pearson Education Limited, Chap. 3.
Yu Z., Mao X.,Jaworski A.J 2014, Experimental study of heat transfer in oscillatory gas flow inside a parallel-plate channel with imposed axial temperature gradient. International Journal of Heat and Mass Transfer, 77: 1023-1032