City, University of London Institutional Repository
Citation
:
Caraher, M., Wu, M. and Seeley, A. (2009). ACA chefs adopt a school: An evaluation (9781900804431). London: Centre for Food Policy, City University.This is the unspecified version of the paper.
This version of the publication may differ from the final published
version.
Permanent repository link:
http://openaccess.city.ac.uk/497/Link to published version
:
9781900804431Copyright and reuse:
City Research Online aims to make research
outputs of City, University of London available to a wider audience.
Copyright and Moral Rights remain with the author(s) and/or copyright
holders. URLs from City Research Online may be freely distributed and
linked to.
ACA Chefs adopt a school
An evaluation
9 June 2009
ISBN 978-1-900804-43-1 © City University 2009
Annie Seeley BSc (Hons) RPHNut Michelle Wu BSc (Hons) MSc Dr Martin Caraher
Centre for Food Policy City University
Contents
Contents...2
Executive summary...5
Introduction...5
Methodology...5
Key findings...6
Cooking attitude...6
Cooking confidence ...7
Vegetable consumption...7
Asking confidence...8
Discussion and conclusions...8
Acknowledgements...10
Introduction...11
Evaluation methodology...12
Sample size ...12
Sample selection...12
Data collection methodology...14
Questionnaire reliability...15
Qualitative data...16
Data analysis methodology...16
Case studies ...17
Case Study 1: CAAS working with an Eco-school...18
Case Study 2: CAAS working with Playing for Success...20
Case Study 3: CAAS as part of the North West Healthy Weight Framework...21
Results...23
Attitude to CAAS session...23
Cooking confidence ...25
Cutting up fruit and vegetables...26
Following recipe instructions...26
Measuring ingredients...27
Making a pasta salad...28
Cooking confidence score ...29
Effects of other factors...30
Vegetable consumption...34
Cucumber consumption (n=169)...35
Pea consumption...37
Celery Consumption...38
Red pepper consumption...39
Overall vegetable consumption data...40
Vegetable consumption change score...41
Effects of other factors...42
Exposure and provision...43
Asking confidence...45
Confidence to ask parents to buy pasta salad ingredients...45
Ask to buy your favourite sweets...46
Pick out ingredients for a pasta salad...47
Pick out fruit or vegetables when shopping...47
Ask for your favourite vegetable for supper...48
Asking confidence for favourite fruit for dinner...49
Openness to trying new vegetables...49
Hand-washing and food preparation...52
Hand-washing before touching food...52
Hand washing after touching face...53
Hand washing after visiting the toilet...53
Discussion...55
Attitude to CAAS session...55
Sample selection...55
Self reported efficacy...56
Cooking confidence...56
Free School Meal Entitlement (FSME) Vs intervention...58
Vegetable consumption...59
Exposure...60
Asking confidence...60
Openness to trying new vegetables...62
Hand washing...63
CAAS design...63
Conclusions...65
References...66
Appendix 1: Chefs Adopt a School...67
What Is It?...67
Executive summary
Introduction
This document summarises an evaluation of a cooking in schools initiative called Chefs Adopt a School (CAAS) which is delivered by the Academy of Culinary Arts.1 At present, sessions are provided all over
England from Cumbria to Cornwall subject to demand and resources (with a few sessions being delivered in Scotland too). Annually, 21,000 children take part in the initiative. Delivered by professional chefs, the programme aim is to teach children about food, food provenance, health, nutrition and cookery. The evaluation was informed by a rapid systematic review of the existing literature on cooking in schools.
This research has been carried out at a time when cooking in schools is being put forward as a solution to improving diets and reducing obesity. It is currently the only evaluation of school cooking in the UK that measures outcomes that impact on health, such as: eating behaviour, cooking confidence and confidence asking for fruit, vegetables and ingredients at home. As such, it can inform future UK school cooking initiative interventions and evaluations. It also highlights the need to incorporate evaluation into school cooking initiatives, as findings provide valuable information necessary to fine tune an intervention.
In the core programme, chefs link with local schools, usually primary, where they deliver 2-3 sessions to one year group within a school. This process is then repeated each year. Key issues covered include hygiene, healthy eating, an appreciation of food through the senses (particularly taste) and practical cooking/food preparation. The first session covers healthy eating and the sensory appreciation of food while the second and third sessions are practical.
Methodology
The evaluation sample comprised two similar groups of children in years 4 and 5 at primary school in England (with an age range of 9-11 years). There were 4 schools in each group, one in each of the following areas: North West England, Midlands, West London and East London. For each school in the intervention group a similar school (matched for geographical region and Free School Meal Entitlement) was included in the control group. Schools in the control group were expecting a Chefs Adopt a School session in the following academic year, and were therefore delayed intervention.
requirement, this indicates that any changes in cooking confidence were not likely to be due to chance.
A questionnaire was designed through consultation with chefs, teachers, children, research staff and an expert reference group. Pilot data collection with pupils provided an opportunity to consult with prospective participants and to test the reliability of the questionnaire. Amendments were made to the questionnaire following this consultation with pupils. The questionnaire was administered on two occasions in a two week period to assess reliability (i.e. consistency of a measure from one time to another) and was found to be sufficiently reliable.2
Questions were included to collect data on attitude to the CAAS session and cooking generally, cooking confidence, vegetable consumption, confidence asking for foods and ingredients at home and hand washing habits during food preparation. Data was collected in class groups before the chef delivered this session and 2-4 weeks following the session. Schools included in the intervention group received the standard 2 session delivery (including one practical session).
Key findings
Cooking attitude
To assess the children’s attitude to the chef’s sessions and cooking generally they were asked if they would like another visit from the chef, the aspects of the session they enjoyed and what other activities they would like to do:
• Overwhelmingly children reported enjoying the session: 89% stating that they would like another visit from the chef. Reasons given included: to make more dishes, cook more, to use the oven, to have the opportunity to taste new foods and flavours or because children enjoyed the first session and wanted to learn more about food.
• The key components children enjoyed were: tasting new foods (76%), making the dish (66%), learning about new foods (55%) learning new cutting skills (48%) and meeting the chef (48%).
• The session with the chef made most children want to cook a lot or a bit more (78%).
• While 9% either answered that they did not like cooking or the session did not make them want to cook more, all but 1 of these children would have liked another session with the chef.
• Children were asked what other things they would have liked to have done in the sessions; there were four key areas of focus. These were: more opportunity and time too cook and prepare food (33%), more opportunity to taste new foods (20%), more autonomy and involvement in practical activities and opportunity to learn new skills (10%). Finally, 22% stated that they were happy with the
sessions and would not have changed anything.
Cooking confidence
Children were asked how confident they were in four key cooking tasks: cutting fruit and vegetables, measuring ingredients, following recipe instructions and making a pasta salad.
• From the answers given a cooking confidence scale was devised from 1-4 where 1 was low confidence and 4 was high confidence. Following the session with the chef, the average reported cooking confidence score increased from 3.09 to 3.35 (by 0.26 points) in the intervention group - a statistically significant improvement. In the control group, confidence increased from 3.35 to 3.44 (0.09 points) this change was not statistically significant.
• The biggest reported confidence change in a specific skill was observed in the percentage of children who reported being able to make pasta salad by themselves (increasing from 26% to 54% post intervention).
• Children who attended schools in deprived areas (measured by the percentage free school meal entitlement) were likely to have a lower confidence gain compared to children attending schools in less deprived areas.
• Thirteen pupils from schools in deprived areas reported reduced cooking confidence after the session with the chef. While 2% pupils from schools in less deprived areas reported a fall in cooking confidence following the session with the chef.
• Across schools in all areas 25% pupils reported no change in cooking confidence.
Vegetable consumption
Children were asked how often they had eaten 5 vegetables in the previous week (cucumber, tomato, peas, celery and red pepper). These vegetables were included in the pasta salad made during the CAAS session and their responses were translated to a scale of 1-4 (where 1 indicated low consumption and 4 was high).
• Children’s average reported vegetable consumption increased after the session with the chef, with the consumption score increasing from 2.24 to 2.46 points (0.22 points) again, a statistically significant increase.
• No significant changes were observed in the control group and, in fact average consumption of the 5 vegetables decreased slightly by 0.03 points from 2.58 to 2.55 points.
• While average reported consumption of all vegetables increased after the session with the chef in the intervention group, the only statistically significant increase was in individual vegetable consumption and related to cucumber consumption (from 37% to 52% post intervention).
Asking confidence
Questions were asked to measure whether the intervention impacted on children’s confidence to ask for vegetables and other foods and ingredients at home. Although the intervention was small, this data was collected to assess the potential to affect attitude, confidence and eating behaviour in the home
environment:
• Compared to the control group, children in the intervention group reported a significant increased confidence in asking a parent to buy ingredients for a pasta salad from 50% to 73% post
intervention. While in the same group there was a slight increase of 10% in confidence in asking for favourite sweets and this was not significant.
• Compared to the control group, children in the intervention group reported increased confidence in picking out the ingredients for a pasta salad whilst shopping (from 59% to 82% - approaching statistical significance). In the control group there was also an increase in confidence (from 66% to 74%). Despite there being no significant difference between the groups it is worth noting that the percentage of children who reported lack of confidence (either answering “I am not sure about doing” this or “I can’t do this”) in the intervention group fell from 42% to 18% (24%) post intervention and in the control group from 34% to 27% (7%).
• Compared to the control group, children in the intervention group reported a significant increased confidence in asking for their favourite vegetable for dinner (from 60% to 74% post intervention).
• There was a slight increase in the percentage of children who claimed to feel able to ask for their favourite fruit for dinner (64% to 72% in the intervention group and 81% to 89% in the control group). The change in both groups indicates there was no difference between the two groups.
Discussion and conclusions
Pupils were enthusiastic and engaged by the Chefs session. They were eager to learn how to cook, practice food preparation skills and taste new foods. This attitude represents a great opportunity to teach children healthier eating habits through practical cooking. The positive attitude towards the sessions may well be in part due to the chef, an adult outside of their school environment. With so many chefs’
presenting cookery programmes on television they have a certain status in society that children may respond well to.
The findings regarding asking confidence in the home indicate that eating behaviour and cooking confidence changes may be transferred to the home environment.
While changes in cooking confidence, vegetable consumption and asking confidence were small and distinct, that a small scale intervention has an impact is encouraging. The findings suggest that if more practical sessions were undertaken with pupils, a greater long-term impact may be achieved.
and intervention. It may be that children’s confidence was reduced when, during the practical session they realised the skill level needed to prepare and cook dishes and recognised they were yet to achieve this. Similarly the session may have caused them to draw comparisons with cooking at home, where it is possible that due to poor food access, low income and/or a lack of cooking skills, meals are not
prepared from fresh ingredients. Without measuring free school meal entitlement on an individual basis and relating to the individual outcomes it is impossible to reach firm conclusions regarding this
association.
To mediate specific outcomes, sessions need to be standardised without stifling individual chef’s creativity. This would ensure chefs work to a common agenda and may result in greater, measureable impact, particularly if combined with a higher dose (more practical sessions).
Acknowledgements
To all the children who took part in the evaluation with enthusiasm. To the teachers and head teachers who agreed to be included in the evaluation, particularly those schools in the delayed intervention group. To the catering staff who answered our questions patiently.
To The Academy of Culinary Arts and their chefs who deliver the Chefs Adopt a School scheme for giving their time and support us in our evaluation of their work.
Introduction
This report outlines an evaluation of The Academy of Culinary Arts’ Chefs Adopt a School Scheme carried out in the summer of 2008. Prior to this evaluation a rapid systematic review of the existing literature on cooking in schools was undertaken, which informed the evaluation design
In the core Chefs Adopt a School programme, chefs link with local schools, usually primary, where they deliver 1-3 sessions to one class each year, one of which is practical. Core elements included in all sessions are hygiene and health, an appreciation of food through the senses, particularly, taste and practical cooking/food preparation.
This is currently the only evaluation of school cooking in the UK that measures outcomes that may impact on health, such as: eating behaviours, cooking confidence and confidence asking for fruit, vegetable and ingredients at home. As such this work can inform future UK school cooking initiative evaluations and interventions. It also highlights the need to incorporate evaluation into school cooking initiatives as the findings can provide valuable information necessary to fine tune an intervention.
Evaluation methodology
Sample size
The first step in the evaluation design was to ascertain an appropriate sample size. In other words, we needed enough children in the sample to have an effect considered to be of scientific significance and also statistically significant. Cooking confidence, as determined by a cooking confidence score, was taken as the primary outcome on which to base the calculation of sample size. As the literature review identified very few evaluations of cooking interventions in the formal literature, the standard deviation for a cooking confidence scale was taken from one study (the Cookshop Study) which met the highest quality standard set in the literature review (Liquori et al, 1998).
Here, standard deviation is a measure of the average distance of each individual score from the mean within the sample, or how "spread out" the scores are. A sample size of 63 children in each group was calculated to be to detect a difference of half (0.5) a standard deviation (SD) in self-efficacy score, with 80% power. A small standard deviation indicates that the data points tend to be clustered around the mean value. A large standard deviation indicates that the data is wide ranging so with greater deviation from the mean. In relation to this study it would indicate a wide range of cooking confidence scores. In the Liquori paper the average standard deviation for cooking confidence score = 0.28.
The evaluation design was quasi-experimental, made up of two groups that were similar – i.e. they were not randomly selected. It involved one intervention group comprising 4 schools and one delayed
intervention comparison group consisting of 4 comparable schools. The primary outcome to be
measured was: difference in pre-test and post- test scores on a cooking self-efficacy scale, between the two groups. A difference of half (0.5) standard deviation (SD), was assumed to be a significant level of change in cooking confidence.
Sample selection
Schools were contacted and recruited through ACA Chefs local schools. In the intervention group chef delivered 1-2 practical sessions, including one practical session. In the delayed intervention group (control), no session was delivered. A control group was included in the design to provide robustness and repeatability and to enable researchers to accurately measure specific variables between the two groups.
Children in years 4 and 5 (ages 9-11 years) were included in the evaluation. This decision was informed by the literature design findings where practical cooking sessions were found to have a greater impact on the cooking confidence of older primary school children.
varies between chefs and is often adapted to suit schools different needs, curriculum focus and/or facilities available. Some standardisation of session content was therefore necessary for the purpose of the evaluation. Chefs were consulted regarding a suitable recipe that included at least 3 vegetables and which could be made irrespective of cooking facilities. Without this standardisation, measurement of impact on consumption and cooking skills would not have been possible. The Chefs decided upon a vegetable pasta salad, where they agreed on the 5 vegetables to be included (tomatoes, cucumber, celery, peas and red pepper).
The core delivery is usually 2 sessions: Session 1 covers hand washing, healthy eating and
experiencing food through the senses, with a focus on taste. Session 2 is usually a recap of the hygiene followed by a practical session. Sometimes a session 3 is undertaken which is usually a visit to the chef’s workplace. In the North West, to maximise reach, sessions 1 and 2 have been combined into one session. Further, we have highlighted some adaptations of delivery in the case studies included in this report.
Ethical clearance was applied for and approved by the Ethical Committee at City University.
For the intervention group, schools were invited to take part in the evaluation if they had scheduled sessions with their local chef in the summer term. Schools in both groups were excluded in the
evaluation if they were taking part in any other healthy eating or cooking intervention that could affect the evaluation outcomes. Schools included in the control group were selected from schools that were expecting a CAAS session in the forthcoming year, and were therefore delayed intervention. As a selection criteria control schools were chosen to be comparable to intervention schools both region and geographical setting and in free school meal entitlement. Full outline of sessions delivered can be found in Appendix 1 to this report.
In total therefore 11 schools were approached and 8 took part in the evaluation. One school in the North West was excluded from the intervention group because the CAAS session was being delivered as part of a healthy eating week. Another school in the intervention group was excluded because a different dish was made by the chef. Finally a school in the control group was not included because it had a low FSME compared to the intervention group that it was to be matched with. As a result of these exclusions, combined with the tight timescales, the sample size was reduced from 5 to 4 comparable schools in each group.
Schools were based in the North West (near Manchester and Liverpool), Midlands, West London and East London. These provided two comparable sub-samples which ultimately provided 86 participants (intervention) and 83 participants (control) that provided baseline and post intervention data. See Table 1 below:
Control Intervention
n=83 n=86
Gender (%)
Girl 41.0% 49.4%
Boy 59.0% 50.6%
East London 31% 23%
West London 23% 22%
North West England 19% 28%
Midlands 27% 27%
FSME
East London 70% 41%
West London 23% 20%
North West England 56% 51%
Midlands 7% 13%
Geographical setting
East London Inner city Inner city West London Urban Urban North West England Urban Urban
Midlands Urban Urban
The comparable school in East London differed in FSME. In the control group 70% of pupils were entitled to FSM compared to 41% in the intervention school. However, alternative schools could not be identified in the time available.
Two visits were made to the 8 schools included in the evaluation to collect pre and post data. Baseline data was collected just before the scheduled session with the chef. Post intervention data was collected 2-4 weeks following the session with the chef. Any additional data in schools was collected at these times
Data collection methodology
A questionnaire was developed that would engage children. The study questionnaires identified in the rapid systematic literature review informed the questionnaire design. Examples of evaluation tools from the Center for advanced studies in Nutrition and Social Marketing in the US also informed the questionnaire design.3 Once the questionnaire design was drafted, consultation with the Centre for Food
Policy department at City University, ACA staff and the chefs delivering the sessions was undertaken. Finally, an international academic reference group (comprising 8 members) with expertise in practical cooking interventions was consulted.
The standard intervention ‘dose’ of the sessions is small: 1-2 sessions per school in total, including one practical session. Consumption data collection measured children’s consumption in the week prior to
post data collection of the 5 vegetables included in the pasta salad. These questions were deemed the best way to assess any changes in eating behaviour as the intervention was small dose. So measuring consumption of the vegetables used in the intervention would detect small changes in consumption.
Questions regarding where children had eaten the 5 vegetables (at home, school dinner or lunchbox) were asked. These were used to firstly eliminate those children who had claimed to eat certain vegetables in the previous week during school lunch when it was not available. So catering managers were also interviewed regarding lunch provision during these weeks. Secondly collection of this data provided an opportunity to measure whether there was a link between exposure to the vegetables during school lunch and consumption.
Questions regarding food preparation were used as a proxy to measure confidence in specific skills required for simple food preparation. Children were not directly asked whether they had prepared a pasta salad at home as this may have encouraged children to conform to perceived expectations. Therefore questions regarding confidence at asking for specific foods in the home environment and when shopping were included in the questionnaire to assess possible transference eating behaviour into the home environment. The questionnaire included a section on a mystery vegetable (fennel) to assess whether the tasting part of the session encouraged children to try new, unfamiliar foods. As the session also focuses on hygiene in the kitchen, questions were asked regarding children’s hand washing habits during food preparation.
A sample of the final questionnaire can be found in Appendix 2 to this report.
Questionnaire reliability
The final draft of the questionnaire was piloted twice over two weeks with Year 5 pupils from a school in West London. The pilot provided an opportunity to consult with prospective participants and an opportunity to test the reliability of the questionnaire. Amendments were made to the questionnaire as a result of this consultation with pupils. When using an instrument for evaluation with groups of children, the instrument is considered sufficiently sensitive and reliable at the 0.6 level.4 The questionnaire was
administered on two occasions in a two weeks period to assess reliability (i.e. consistency of a measure from one time to another)
the fennel question. A correlation coefficient of 1.0 would indicate that all children gave the same answer to a question the second time.
Qualitative data
As well as the collection of this quantitative data, qualitative data was collected. The questionnaire included questions asking children about their favourite fruit and vegetables, food they prepared and cooked at home. It also asked participants to tell a story about a favourite meal or dish they would make at the weekend. The latter question includes sections on ingredients, who they ask to help, what they would need help with, where they would eat the meal, and who they would eat the meal with. These questions were designed to find out about children’s food culture. Findings from qualitative data collection will be reported in a separate report.
Finally questions regarding the children’s perception and attitude to the session with the chef were asked and these have been collated and are included in this report. This section of the report serves to provide ACA with direct feedback from participants as well as giving an insight into children’s attitudes to the session with the chef, cooking and food preparation per se.
Data analysis methodology
Data was collected, input into excel. Quantitative data was exported in to SPSS v16 software for analysis. Findings are presented under the headings: Attitude to CAAS session; cooking confidence; vegetable consumption; openness to trying new foods and hand washing.
Case studies
Standardisation of recipes included in the formal evaluation resulted in homogenised sessions. To reflect some of the diversity of the ACA work we also visited the following initiatives and have included them as case studies in the report:
• Case Study 1: CAAS working with rural Eco-school
• Case Study 2: CAAS working with Playing for Success
• Case Study 3: CAAS as part of the North West Healthy Weight Framework
These case studies are briefly outlined in the following pages.
Case Study 1:
CAAS working with an Eco-school
This village school is set in a rural farming region, is small, with 60 pupils. The school budget is small (as money allocated to schools is based on pupil numbers). Despite this, staff are committed to and deliver a range of practical ecological and food based activities that includes working with CAAS.
Ecology
The school has been awarded the Green Flag (the highest accolade) 3 times running by Eco-School Standards. Ecology is incorporated into every level of school life, from the curriculum, to working with the children to reduce the schools carbon footprint, and in practical cooking activities, where food grown in the school vegetable patch is often used, while food waste is composted by the school too. Teaching staff aim to encourage the children to understand how what they do in their immediate environment can have positive or negative affects people in other parts of the World. The school teaches children that they need to be aware of this interdependence. Staff have forged links with Concern, a charity that in developing countries, as such the school promotes and teaches fair trade principles and has also visited Concern projects in Africa. So ingrained is ecology the children’s way of thinking that when they eat lunch on school outings they have been known to ask where the composter is to dispose of their food waste.
The school has about 27 small vegetable growing plots. The garden is managed by a member of staff, two volunteers from the village and the children. They also have about 6 compost bins.
For the harvest lunch all classes made different dishes, some of the produce from the garden was used: Pumpkin soup, beetroot soup and tomato and basil soup, home made bread, local cheese and apple cakes. The soup was made from produce grown in the school garden.
Cooking sessions
The school delivers practical cooking lessons under the food technology curriculum, an after-school cooking club and CAAS sessions. The teaching kitchen is small and basic, and therefore only takes small groups of children.
The CAAS sessions are delivered to larger groups so are held in one of the class rooms. In the most recent Chef’s sessions, children learned how to make tortilla wraps
The chef’s approach is creative and passionate and his enthusiasm is infectious. The children really enjoy having a visitor deliver the sessions (rather than a staff member). As with many schools, teachers here are female so a male chef provides an important role model for the boys.
Case Study 2: CAAS working with Playing for Success
As well as delivering sessions in local primary schools ACA chefs also deliver practical cooking sessions at local football clubs. This is arranged either directly as with the Aston Villa Vitality Scheme or within the Playing for Success initiative.
During the evaluation period, Aston Villa was refurbishing its teaching kitchen for local ACA chef to deliver practical cooking sessions.
At another football club in the North West, sessions are delivered within a national scheme called Playing for Success, which started in 2001. The programme aims to help improve literacy and numeracy skills of children who have been identified as likely to under-achieve. The impact of the overall scheme is evaluated at a local club level. At Everton the PSF Centre manager was once a teacher (this is the set up for the centres generally). Children do about 10 x 2 hour sessions usually. The group that was observed in the ACA session were working on a business enterprise project that included a written business plan, an advertising jingle, and a logo design. As well as focussing on literacy and numeracy skills the project also was an opportunity to familiarise the children with IT including desktop publishing. The chef’s session was therefore different to the other sessions that, so was likely to be enjoyed by the children as it was a practical session.
The group observed was small: 8 children all from year 2. The chef’s session was shorter than other sessions (1 ½ hours) and combined sensory, taste and practical cooking session.
The lesson included guidance on hand washing, experiencing food through the 5 senses, focussing on taste, using honey (sweet), dark chocolate (bitter), Hula Hoop (salty) and lemon (sour) and the 5 food groups. The children enjoyed this part of the session.
The chef then used the Balance of good health poster and asked the children to put different foods in the correct food group.
Case Study 3: CAAS as part of the North West Healthy Weight
Framework
CAAS in the North West is delivered as part of the North West Healthy Weight Framework. This strategy, co-ordinated by North West Regional Public Health Group, NHS Northwest and the
Government Office North West, brings together local agencies delivering initiatives that promote healthy eating and physical activity to help prevent obesity. The aim is to achieve healthy weight for children and families.
CAAS falls within school setting delivery and is therefore a member of the North West Food in Schools cluster alongside National Healthy Schools Programme, Lets get cooking and the Food for Life
Partnership. The CAAS programme is funded by the Regional Development Agency. Being a member of the cluster group enables CAAS to communicate with and work collaboratively with other health
promotion agencies in schools.
The local chef delivering CAAS has a target of 240 taste/cookery sessions to be delivered in schools, developing healthy eating lesson plans and recruiting 25-30 academicians/chefs for the North West region to support embed and sustain the programme after the life of the project. Schools with 50% or more pupils entitled to free school meals are targeted in this area. To ensure that the delivery target is met the Chef consolidates the taste and sensory and practical cooking session into one session rather than two.
As part of the year of food and farming (2008) the School Food and Nutrition Cluster organised a visit to a local farm in Wirral in the morning followed by a session with the local CAAS chef in the afternoon. This was part of the Crop to Kitchen curriculum initiative.
The farm visited is well-known local family business, in the Wirral, and is the setting for the Annual Wirral Food and Drink Festival. It has an on site kitchen where sessions are run by a local chef, there may be possibility for CAAS to work with this chef and/or the farm and farm kitchen in the future (though the kitchen can only accommodate small groups).
Children were given the tour of the farm by the farmer starting with a delivery of asparagus, picked that morning ready for sorting, trimming, grading, bundling and packing into cardboard boxes and delivery later that day. The farm supplies local shops and restaurants as well as its own farm shop
On the tour teaching staff were each given a stick with a piece of string attached, pupils were
Results
Attitude to CAAS session
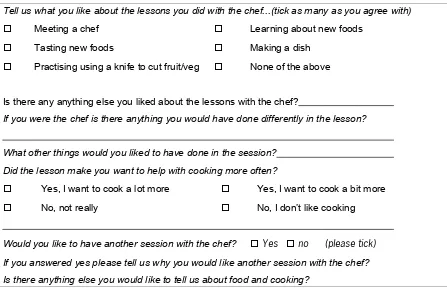
[image:24.595.73.520.240.530.2]Participants who took part in the intervention were asked questions regarding the session, see Figure 1 below. This part of the questionnaire was designed to find out about the pupil’s attitude to the CAAS session and satisfaction. The questions were also devised to indicate participant’s attitude to cooking and food preparation.
Figure 1: Attitude to session with chef
Tell us what you like about the lessons you did with the chef...(tick as many as you agree with)
Meeting a chef Learning about new foods
Tasting new foods Making a dish
Practising using a knife to cut fruit/veg None of the above
Is there any anything else you liked about the lessons with the chef?
If you were the chef is there anything you would have done differently in the lesson?
What other things would you liked to have done in the session? Did the lesson make you want to help with cooking more often?
Yes, I want to cook a lot more Yes, I want to cook a bit more
No, not really No, I don’t like cooking
Would you like to have another session with the chef? Yes no (please tick)
If you answered yes please tell us why you would like another session with the chef? Is there anything else you would like to tell us about food and cooking?
Out of the 88 children who answered this part of the questionnaire, 89% wanted to have another session with the chef. Of these children:
• Twenty seven wanted another session with the chef so they could make more dishes and cook more, some wanted the opportunity to use an oven.
• Twenty four wanted another session with the chef to taste new foods and flavours.
• Twenty two wanted another session with the chef because enjoyed it.
• Fifteen wanted another session with the chef to learn more about food.
• Five children said they did not want another class with the chef, while 4 children did not answer the question at all.
• Sixty six percent enjoyed making a new dish;
• Fifty five percent enjoyed learning about new foods;
• Forty eight percent enjoyed learning new cutting skills with fruit and vegetables;
• Forty eight percent enjoyed meeting the chef;
• Only 2% said they didn’t enjoy any of these things
When asked whether there was anything else they liked about the sessions, participant’s answers focussed around 3 key areas: trying new foods and flavours (n=16), learning new cooking skills (n=15), food guessing games (n=9) and general enjoyment of the session and appreciation of the chef (n=9).
When participants were asked whether the session made them want to cook more:
• Fifty five percent answered yes I want to cook a lot more;
• Twenty six answered yes I want to cook a bit more;
• Six percent answered no not really;
• Three percent answered no I don’t like cooking;
• And 3% did not answer the question.
Children were asked what other things they would have like to have done in the sessions. Answers fell into 5 different categories:
• The most popular answer was to make more food and to have more opportunity and time to cook and prepare food (n=22) from cheeseburgers to seaweed and noodles.
• Many children were happy with the sessions and would not have done anything else (n=18): “Tthe session was absolutely fantastic; there don’t need to be any changes!”
• Sixteen would have liked to have tasted more food.
• Eight would have liked more autonomy and opportunity to learn new cooking skills within the session: “I would like to cook what I want”, “have a go at cutting the pasta”.
Children were asked if there was anything they would have done differently in the session, if they were the chef. Answers fell into 5 main areas:
• Twenty two said they would have liked to have done more cooking and food preparation had more variety of foods and had more time.
• The same number of children said they would not do anything differently and were happy with the session (n=22)
• Thirteen would have liked to taste more foods. Though on a negative health promotion note, 3 of these wanted more chocolate and 1 wanted more crisps. Three of these children wanted to try the dish that they had made in the session.
dish”, “I would let them make most of the food themselves”.
• Five would have liked more explanation, including information about fruit and vegetables and find out about growing more fruit and vegetables.
Cooking confidence
Changes in confidence and consumption were measured between the intervention and delayed intervention groups. They were also measured within each group. Finally the influence of different variables: Genders, geographical area, FSME on outcomes were measured.5
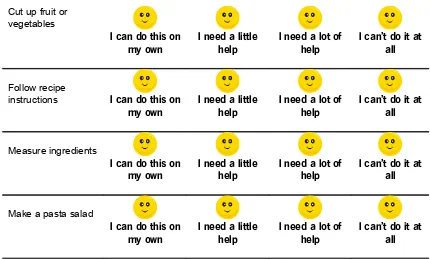
[image:26.595.82.512.373.632.2]Children were asked whether, when preparing food, they felt able to cut up fruit and vegetables, follow recipe instructions, measure ingredients and make a pasta salad. Their confidence was assessed using a scale, where 1=‘I can’t do this at all’, 2= ‘I need a little help’, 3=’I need a lot of help’, and 4=’I can do this on my own’. See figure 2 below:
Figure 2: Cooking confidence questions
If you are preparing food, can you (please draw a circle around the face that tells us about you)....
Cut up fruit or vegetables
I can do this on
my own I need a little help I need a lot of help I can’t do it at all
Follow recipe
instructions I can do this on
my own I need a little help I need a lot of help I can’t do it at all
Measure ingredients
I can do this on
my own I need a little help I need a lot of help I can’t do it at all
Make a pasta salad
I can do this on my own
I need a little help
I need a lot of help
I can’t do it at all
5 Between-group differences were evaluated using Pearson’s x2 statistic for categorical variables and the
Cutting up fruit and vegetables
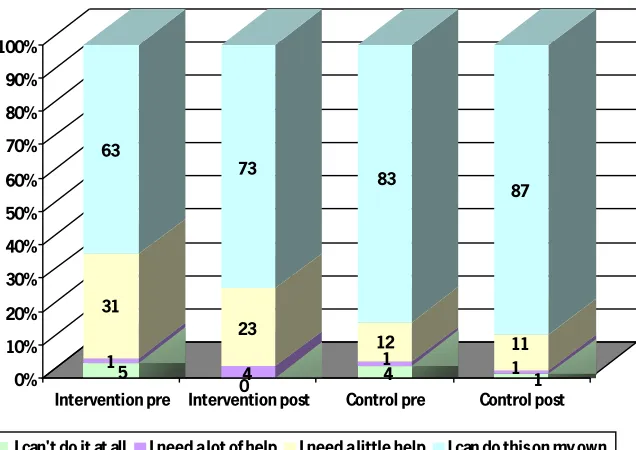
[image:27.595.145.463.251.476.2]When asked before the chef sessions if they could ‘cut up fruit or vegetables’, 63% of children in the intervention group said they could do this ’on my own’ compared with 83% of children in the control group (see figure 3). So the two groups were not the same at baseline. Post-test, the proportion of children who said they could cut fruit and vegetables on their own increased by 10% to 73% in the intervention group and by 3% in the control group. The number of children in the intervention group who could not cut up fruit and vegetables without help fell from 5% to 0% in the intervention group and 4% to 1% in the control group.
Figure 3: Cutting up fruit and vegetable confidence (n=169)
5 1 31 63
04 23 73
4 1 12 83
1 1 11 87
0% 10% 20% 30% 40% 50% 60% 70% 80% 90% 100%
Intervention pre Intervention post Control pre Control post
I can't do it at all I need a lot of help I need a little help I can do this on my own
Following recipe instructions
Figure 4: Confidence following recipe instructions (n=169) 9 8 37 46 18 44 47 1 5 34 60 2 5 28 65 0% 10% 20% 30% 40% 50% 60% 70% 80% 90% 100%
Intervention pre Intervention post Control pre Control post
I can't do it at all I need a lot of help I need a little help I can do this on my own
Measuring ingredients
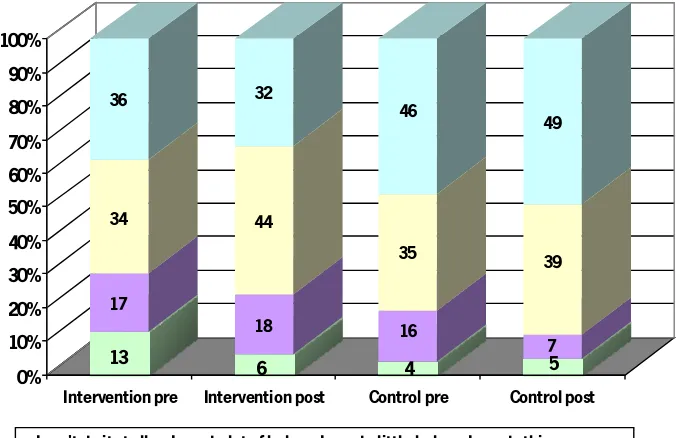
At baseline and post-test, the differences between groups in reported confidence measuring ingredients were not statistically significant. Within the intervention group, the largest change from pre- to post-test occurred in the proportion of children who said they ‘need a little help’, which increased from 34% to 44% at post-test (See figure 5). Also in the intervention group, those who said they could not measure ingredients at all fell from 13% to 6% at post-test, while this proportion increased slightly in the control group.
Figure 5: Confidence in measuring ingredients (n=169)
13 17 34 36 6 18 44 32 4 16 35 46 5 7 39 49 0% 10% 20% 30% 40% 50% 60% 70% 80% 90% 100%
Intervention pre Intervention post Control pre Control post
Making a pasta salad
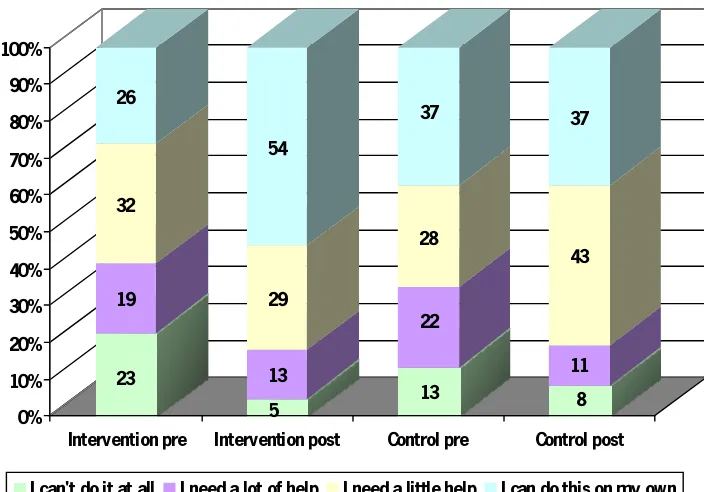
[image:29.595.126.478.251.497.2]At baseline, the differences between groups in reported confidence in making pasta salad were not statistically significant. Post intervention, the proportion of children who reported being able to make a pasta salad by themselves more than doubled in the intervention group, from 26% at baseline to 54% post-test (see Figure 6) In the control group, this proportion remained the same at 37%. While self reported confidence changed in both the intervention and control groups, post-test proportions did not differ significantly.
Figure 6: Confidence in making a pasta salad (n=169)
23 19 32 26
5 13 29 54
13 22 28 37
8 11 43 37
0% 10% 20% 30% 40% 50% 60% 70% 80% 90% 100%
Intervention pre Intervention post Control pre Control post
I can't do it at all I need a lot of help I need a little help I can do this on my own
.
or with a little help (n=169)
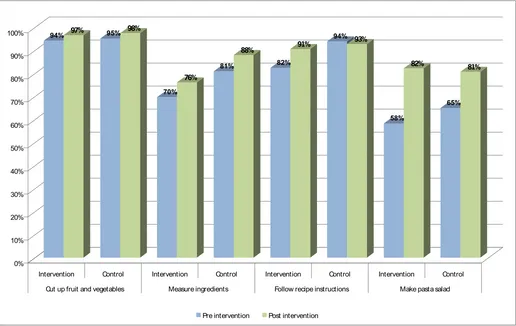
Figure 7 shows changes in both groups pre- and post- intervention, combining those who said they were able to do activities on their own with those who needed a little help, It is evident from the above that within groups, the largest pre- to post-test change occurred in children’s confidence in making pasta salad, with gains in both the intervention and control groups, though a larger change was seen in the intervention group.
Cooking confidence score
We measured cooking confidence using the questions outlined in Figure 2 where confidence was assessed using a scale, where 1=‘I can’t do this at all’, 2= ‘I need a little help’, 3=’I need a lot of help’, and 4=’I can do this on my own’. An average was calculated combining the confidence scores in all skill areas for each child and dividing by the number of skill areas (=4). This average ‘score’ was used as an indicator of overall cooking confidence and was also useful in showing the direction of change.
A difference score was calculated by subtracting the pre-test score from the post-test score. The difference-score measures the average change in cooking confidence score between the two groups of children. While both groups demonstrated an increase in cooking confidence post intervention, the
94% 97% 95% 98%
70%
76%
81%
88%
82%
91% 94% 93%
58%
82%
65%
81%
0% 10% 20% 30% 40% 50% 60% 70% 80% 90% 100%
Intervention Control Intervention Control Intervention Control Intervention Control Cut up fruit and vegetables Measure ingredients Follow recipe instructions Make pasta salad
This means the intervention had an effect on children’s cooking confidence.
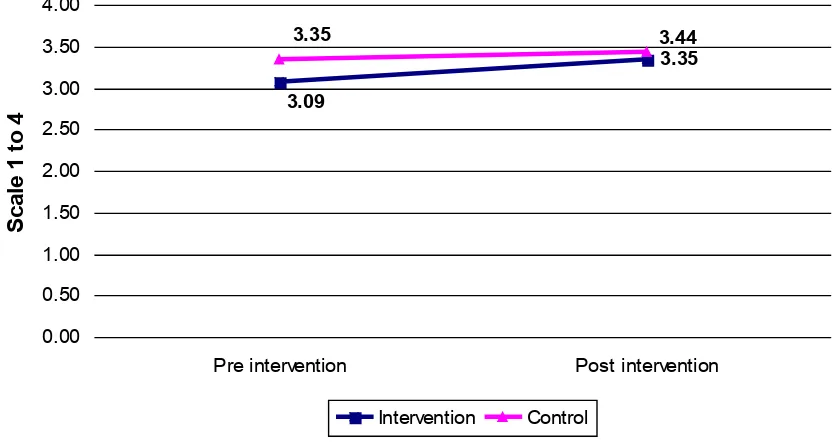
[image:31.595.91.509.227.448.2]At baseline, the average cooking confidence score in the intervention group was 3.09. Post-intervention, this increased by 0.26 (95%CI, 0.12, 0.38) to 3.35. . In the control group, confidence increased by 0.11 (95% CI, 0.02, 0.19) from 3.35 to 3.44. This finding suggests that overall, cooking confidence improved in both groups, though the greater gain was seen in the intervention group. See Figure 8 below
Figure 8: Cooking confidence score change pre to post intervention (n=169)
Effects of other factors
The influence of different variables (geographical regions, gender, FSME) on cooking confidence was measured.6
Of these variables, intervention was found to be associated with the change in cooking score (p=0.041) as was the interaction between group and geographic region (p=0.046). See Table 3 below. As schools in each geographical area had a different range of FSME, geographical region was highly correlated to FSME, i.e., intervention and control schools in each geographic area were selected on the basis of similar FSME. As such, we could not look at both variables at the same time; only one or the other. So geographical area was a proxy for FSME.
Table 3: Dependent variable difference in cooking confidence Vs other variables (n=169)
6 Using a Factorial ANOVA .
3.35
3.09
3.44 3.35
0.00 0.50 1.00 1.50 2.00 2.50 3.00 3.50 4.00
Pre intervention Post intervention
S
ca
le
1
t
o
4
In a separate analysis using FSME (stratified into ranges of % FSME), the interaction between FSME and group was again found to have a statistically significant (p=0.044) influence on cooking confidence. However, in this model neither group nor FSME independently were associated with cooking confidence (see Table 4 below).
Table 4: Dependent variable difference in cooking confidence Vs other variables (n=169)
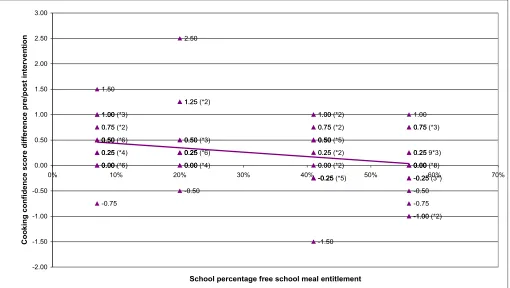
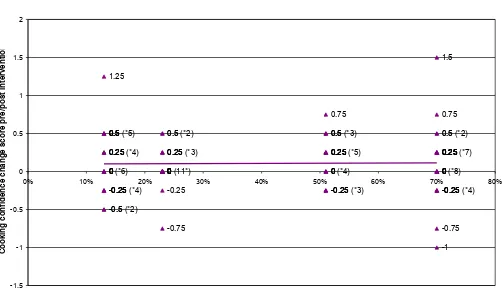
Reported changes in confidence for each pupil in the intervention group were plotted against the school’s free school meal entitlement, see Figure 8 below. An inverse association was observed between a school’s percentage free meal entitlement and change in cooking confidence score.
Source Significance
Intervention 0.041*
Gender 0.112
Geographical area 0.404
Intervention * gender 0.149
Intervention * geographical area 0.046*
Gender and geographical area 0.557 Intervention gender and geographical area 0.113
Source Significance
FSME 0.182
Intervention * gender * FSME 0.602
Figure 8: Intervention group cooking confidence difference change by school FSME(n=86
(*n) denotes number of pupils if more than 1
The same trend was not observed in the control group (see Figure 9 below). So in the intervention group, pupils from schools in more deprived areas, indicated by a higher percentage FSME tended to have a smaller gain in confidence in their cooking skills following the session with the chef, compared to their counterparts in schools with lower FSME. Of the 15 pupils who reported lower confidence in their cooking skills following the session with the chef, 13 were from schools with high FSME (41% and 56%), while only two were from schools with low FSME (7% and 20%) Across all schools in total 20 pupils (just under a quarter) reported no change in cooking confidence following the session with the chef.
Sixteen out of 25 (64%) of the pupils from the school with the lowest FSME reported an increased cooking confidence following the session with the chef compared to 7 out of 22 (32%) of the pupils from the class with the highest FSME (56%).
0.00 0.75 0.00 0.25 0.50 1.50 0.00 0.50 -0.75 0.50 0.50 0.25 0.00 0.25 0.50 1.00 1.00 0.00 0.25 -1.50 0.75 0.00 0.50 -0.25 0.50 -0.25 1.00 -0.25 0.50 -0.25 0.50 0.25 1.00 0.75 -0.25 0.00 -1.00 0.00 0.00 0.25 0.00 0.00 0.00 0.75 -0.75 -0.25 0.00 -0.50 0.00 0.25 1.25 0.25 0.25 0.25 -0.50 2.50 0.25 0.00 0.50 0.50 0.00 -0.25 (3*) -1.00 (*2) -0.25 (*5) 0.00 (*4) 0.25 (*6) 0.50 (*3) 1.25 (*2) 0.00 (*8) 0.25 9*3) 0.75 (*3) 0.00 (*2) 0.25 (*2) 0.50 (*5) 0.75 (*2) 1.00 (*2) 0.00 (*6) 0.25 (*4) 0.50 (*6) 0.75 (*2) 1.00 (*3) -2.00 -1.50 -1.00 -0.50 0.00 0.50 1.00 1.50 2.00 2.50 3.00
0% 10% 20% 30% 40% 50% 60% 70%
School percentage free school meal entitlement
Figure 9: Control group cooking confidence score change Vs school FSME (n=83)
*n denotes number of pupils
0.25 0.25 0.5 -0.5 -0.25 -0.25 0.5 0 -0.25 0 0.25 1.25 0 0.5 0 0 0.5 -0.25 0.25 -0.25 0.25 1.5 0 0.25 0.5 -0.75 0.25 0 -0.25 0.25 0 0 0.25 0.75 -1 0 0 0.25 0.5 0.25 0.5 0 -0.25 -0.25 0 0 0.25 0.25 0.75 0.25 0.25 0 0 0 -0.25 0.5 0 0 -0.75 0 0 0 0 0 0.5 (*2) 0.25 (*3) 0 (11*) 0.5 (*3) 0.25 (*5) 0 (*4) -0.25 (*3) 0.5 (*2) 0.25 (*7) 0 (*8) -0.25 (*4) 0.5 (*5) 0.25 (*4) 0 (*6) -0.25 (*4) -0.5 (*2) -1.5 -1 -0.5 0 0.5 1 1.5 2
0% 10% 20% 30% 40% 50% 60% 70% 80%
School percentage FSM entitlement
Vegetable consumption
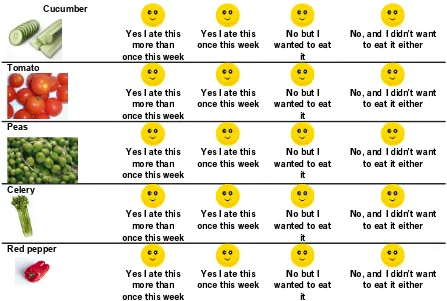
[image:35.595.74.521.236.537.2]To measure vegetable consumption pupils were asked to circle the relevant face on the questionnaire section detailed in figure 10, below. Consumption questions related to the 5 vegetables included in the pasta salad the children made in the chef’s session.
Figure 10: Vegetable consumption questions
In the last week have you eaten any (please draw a circle around the face that tells us about you)...
Cucumber
Yes I ate this more than once this week
Yes I ate this
once this week wanted to eat No but I it
No, and I didn’t want to eat it either
Tomato
Yes I ate this more than once this week
Yes I ate this
once this week wanted to eat No but I it
No, and I didn’t want to eat it either
Peas
Yes I ate this more than once this week
Yes I ate this
once this week wanted to eat No but I it
No, and I didn’t want to eat it either
Celery
Yes I ate this more than once this week
Yes I ate this
once this week wanted to eat No but I it
No, and I didn’t want to eat it either
Red pepper
Yes I ate this more than once this week
Yes I ate this
once this week wanted to eat No but I it
Cucumber consumption (
n
=169)
At baseline, significantly more children in the control group reported eating cucumber at least once a week than in the intervention group (81% Vs 59%, respectively).
As shown in Figure 11, within groups, this percentage rose by 15% in the intervention children after the session with the chef, from 59% to 74%, which was a statistically significant increase. The percentage of children in the control group who ate cucumber at least once in the previous week did not change significantly post-test.7
[image:36.595.119.481.315.554.2]The change in consumption observed in the intervention group was statistically significant post-test (p=0.007).
Figure 11: Percentage cucumber consumption (n=169)
30 11 22 37
17 8 22 52
13 6 19
62
12 7 24 57
0% 10% 20% 30% 40% 50% 60% 70% 80% 90% 100%
%
Intervention pre Intervention post Control pre Control post
No and didn't want to No but wanted to Ate once Ate more than once
Tomato consumption
At baseline, significantly more children in the control group reported eating tomato at least once in the previous week than in the intervention group (54% Vs 42%, respectively).
Changes in tomato consumption were not statistically significant in either group post-test. The
[image:37.595.137.474.240.470.2]percentage of children who answered ‘no, but I wanted to eat’ tomato did not change significantly from pre to post test in either group.
Figure 12: Percentage tomato consumption (n=169)
45 11 27 15
44 9 25 22
41 5 23 32
43 5 24 29
0% 10% 20% 30% 40% 50% 60% 70% 80% 90% 100%
Intervention pre Intervention post Control pre Control post
Pea consumption
As shown in figure 13, at baseline significantly more children in the control group reported that they had consumed peas at least once in the previous week compared to the intervention group (66% Vs 51%, respectively).
[image:38.595.126.486.259.509.2]Overall, the changes observed in reported pea consumption were not statistically significant in either group post-test. So while increases in consumption were observed in the intervention group, these were not statistically significant.
Figure 13: Percentage pea consumption (n=169)
33 16 17 34
31 11 24 34
23 11 37 29
26 8 37 29
0% 10% 20% 30% 40% 50% 60% 70% 80% 90% 100%
Intervention pre Intervention post Control pre Control post
Celery Consumption
At baseline more children in the control group reported eating celery at least once in the previous week than in the intervention group (34% Vs 26%, respectively), see Figure 14 below.
[image:39.595.126.489.261.512.2]The changes observed for celery consumption were not statistically significant in either group post-test. It is interesting to note however that there was a slight increase in the intervention group (5%) in children who would have liked to have eaten celery if it was available, which suggests a slight change in attitude (compared to a decrease of 5% in the control group).
Figure 14: Percentage celery consumption (n=169)
57 17 21 5
48 22 19 12
53 13 17 17
54 8 19 18
0% 10% 20% 30% 40% 50% 60% 70% 80% 90% 100%
Intervention pre Intervention post Control pre Control post
Red pepper consumption
At baseline, children in the intervention and control groups were similar in their red pepper consumption: 43% and 46%, respectively, reporting that they ate red pepper at least once in the previous week (see Figure 15 below). After the intervention, while both groups showed an increase in consumption, they remained similar (i.e., differences between the two groups were not statistically significant).
[image:40.595.119.491.239.499.2]The changes observed in red pepper consumption were not statistically significant in either group post-test.
Figure 15: Percentage red pepper consumption (n=169)
43
14 20 23
34
16 23 27
39
16 31 15
35
12 23 29
0% 10% 20% 30% 40% 50% 60% 70% 80% 90% 100%
Intervention pre Intervention post Control pre Control post
Overall vegetable consumption data
Figure 16 below combines the percentage of children who reported eating the vegetables once and more than once in the past week pre and post intervention for both groups. A trend for increased consumption for all 5 vegetables can be seen for the intervention group, while for the control group, consumption of cucumber and peas stayed the same, tomato consumption decreased slightly and slight increases in celery and red pepper consumption were observed. So while the reported increases in consumption in all vegetables in the intervention group were not significant, compared to the control group (where the same pattern of reported consumption was not observed) this is of note.
[image:41.595.65.534.282.650.2]Figure 16: All vegetable consumption (n=169)
Table 5: Within intervention group only change in the proportion of
Children reported eating each vegetable at least once in the last week (n=86)
Vegetable Pre-post difference p-value
Cucumber 15.1% 0.007*
Tomato 4.2% 0.678
Peas 7.6% 0.263
Celery 4.0% 0.523
Red pepper 7.1% 0.263
Table 5 above and Table 6 below summarise the changes in reported consumption pre to post test, within the intervention group and control groups, respectively. The increase in cucumber consumption in children receiving the chef sessions was the only statistically significant change observed. Though,
59 74
81 81
42 47
55 52 5159
66 66
2630
3437
43 50
46 52
0 10 20 30 40 50 60 70 80 90 100
%
Cucumber Tomato Peas Celery Red pepper
consumption of all vegetables did increase in the intervention group. No significant change in
consumption was observed in the control group, reported consumption of tomatoes and peas fell slightly.
Table 6: Within control group only: change in the proportion of children who reported eating each vegetable at least once in the last week (n=83)
Vegetable Pre-post difference p-value
Cucumber 0.0% 1.000
Tomato -2.4% 0.815
Peas -0.8% 1.000
Celery 3.6% 0.581
Red pepper 6.6% 0.210
Vegetable consumption change score
A summary measure for vegetable consumption was devised by assigning a number value to the consumption responses where 1= ‘No and didn’t want to eat it’ and 4= ‘Yes, I ate this more than once this week’. Similar to the cooking confidence score, an average was calculated by combining the scores for all five vegetables for each child. The average ‘score’ was used as an indicator of overall vegetable consumption and was also useful in showing direction of change.
A difference score was calculated subtracting the pre-test score from the post-test score. The difference-score measures the average change between the two groups of children. The vegetable consumption difference score was found to differ significantly between the two groups (p=0.024). This means the intervention had an effect on children’s vegetable consumption.
Figure 17: Vegetable consumption change scale pre and post intervention (n=169)
2.24 2.46
2.58 2.55
0 0.5 1 1.5 2 2.5 3 3.5 4
Pre intervention Post intervention
S
ca
le
1
t
o
4
Intervention Control
Effects of other factors
Statistical tests8 were carried out to determine the effect of different variables on vegetable consumption
[image:43.595.89.510.101.333.2]difference score. These included group (intervention or control), gender, FSME and geographic area. When other factors were accounted for, group was found to have an effect on vegetable consumption difference score (p=0.007), see Table 7 below.
Table 7: Effect of different factors on vegetable consumption difference score (n=169)
8 Factorial ANOVA
Source Significance
Intervention 0.007*
Gender 0.094
Geographical area 0.809
Intervention * gender 0.103 Intervention * geographical area 0.068 Gender and geographical area 0.173 Intervention *gender and geographical area 0.857 Intervention * gender * FSM 0.391
FSM 0.855
Exposure and provision
[image:44.595.75.522.242.702.2]Children were asked the questions outlined in Figure 18 to ascertain where participants reported eating vegetables.
Figure 18: Section of questionnaire regarding exposure and provision
If you ate any of the above vegetables where did you eat them (draw a cross through the pictures that tell us about you)? :
Cucumber
In your school lunch
In your lunchbox At home
Tomato
In your school lunch
In your lunchbox At home
Peas
In your school lunch
In you lunchbox At home
Celery
In your school lunch
In your lunchbox At home
Red pepper
In your school lunch
In your lunchbox At home
Table 8: Provision of 5 vegetables in school lunches
Vegetables in school lunch provision week prior to pre/post data collection Schools: pre/post
intervention
Cucumber Tomato Peas Celery Red Pepper
Pre Post Pre Post Pre Post Pre Post Pre Post
NW UK intervention
NW UK control pre
E London control pre
E London intervention pre
W London intervention pre
W London control pre
Birmingham intervention pre
Birmingham control pre
As can be seen from Table 8, of the 5 vegetables, celery and red pepper were not always included in lunch provision. The intervention school in the North West, the East London control school and the Birmingham intervention school did not provide these vegetables at baseline and post intervention. While the West London intervention school did not serve celery pre intervention and the Birmingham control school did not provide red pepper both pre and post intervention.
[image:45.595.53.545.86.219.2]This data was firstly used to assess whether school children mistakenly stated they had eaten vegetables at school which had not been included in school lunch provision.
Table 9: Children reporting eating celery or red pepper at school lunch Despite the vegetables not being included in lunch provision
Secondly this data was used to assess whether exposure (provision of these vegetables) at school lunch increased consumption. However as the group numbers were small, no significant association was found.
Schools: pre/post intervention Celery Red Pepper
NW UK intervention pre 1
NW UK Intervention pre 1 2
E London control pre 1
E London control post 3
W London intervention pre 1
W London intervention post 1 2
Birmingham intervention post 2
Asking confidence
In this section, children were asked whether they felt able to ask a parent or carer to buy the ingredients for a pasta salad, favourite sweets, the ingredients for a pasta salad, pick out a favourite fruit or
vegetable when shopping and ask for a favourite fruit or vegetable dish at supper. Pupils could select the following responses: ‘I can do this’, ‘I am not sure about doing this’ or ‘I can’t do it at all’. In order to make within group comparisons, those who answered ‘I can do this’ were coded as ‘yes’ and those who answered ‘I am not sure about doing this’ or ‘I can’t do this’ were coded as ‘no’. Figure 19 below details the asking confidence section of the questionnaire.
Figure 19: Asking confidence section of questionnaire
At home can you (please draw a circle around the face that tells us about you)....
Ask a family member/carer or friend to buy
ingredients for a pasta salad… I can do this I am not sure about
doing this I can’t do it at all
Ask a family member/carer or friend to buy
my favourite sweets… I can do this I am not sure about doing this
I can’t do it at all
Go shopping with my family/carer or friend and pick out the ingredients for a pasta
salad… I can do this I am not sure about doing this I can’t do it at all
Go shopping with my family/carer or friend and picking out my favourite fruit or
vegetables… I can do this I am not sure about doing this I can’t do it at all
Ask a family member/carer or friend to
make your favourite vegetable for supper… I can do this I am not sure about doing this
I can’t do it at all
Ask someone in your family/carer or friend
to serve your favourite fruit at dinner… I can do this I am not sure about
doing this I can’t do it at all