City, University of London Institutional Repository
Citation
:
Kalyvianaki, E., Charalambous, T. and Hand, S. (2010). Resource Provisioning for Multi-Tier Virtualized Server Applications. Computer Measurement Group (CMG) Journal, 126, pp. 6-17.This is the accepted version of the paper.
This version of the publication may differ from the final published
version.
Permanent repository link:
http://openaccess.city.ac.uk/8185/Link to published version
:
Copyright and reuse:
City Research Online aims to make research
outputs of City, University of London available to a wider audience.
Copyright and Moral Rights remain with the author(s) and/or copyright
holders. URLs from City Research Online may be freely distributed and
linked to.
City Research Online: http://openaccess.city.ac.uk/ [email protected]
RESOURCE PROVISIONING FOR MULTI-TIER
VIRTUALIZED SERVER APPLICATIONS
Evangelia Kalyvianaki Computer Laboratory University of Cambridge, UK
Themistoklis Charalambous Engineering Department University of Cambridge, UK
Steven Hand Computer Laboratory University of Cambridge, UK
Virtualizing the x86-based data center creates a dynamic environment for server application deployment and resource sharing. Resource management in this environment is challenging as applications are under fluctuating workloads causing diverse resource demands across their tiers. Resource allocation adaptation is essential for high performance machine utilization. This paper presents feedback controllers that dynamically adjust the CPU allocations of multi-tier applications in order to adapt to workload changes by considering the resource coupling between utilizations of application components. Our experimental evaluation on a virtualized 3-tier Rubis server application shows that our techniques work effectively.
1. INTRODUCTION
Recent advances in virtualizing commodity hardware (e.g. [VMware], [BDF+03]) are causing a dramatic change in the resource management of data centers. Traditionally x86-based data centers provide a pool of server machines for sharing among applications. Machines are dedicated to applications in ways to cope even with their most demanding workloads, however rare these may be. Although this scheme provides performance isolation, it has led to over-provisioning of server resources and consequent increased power, cooling and management costs. Virtualizing the data center enables resource sharing in arbitrary combinations between applications and physical servers. A physical machine is transformed into one or more virtual ones, called Virtual Machines (VMs), each one capable of hosting a different application, and all sharing the physical resources. In addition, VMs can take advantage of dynamic resource allocation. Virtualization is now regarded as a key technology, supplanting frameworks developed in the past to enable resource sharing within the context of traditional operating systems (e.g. [US04], [ADZ00]). This is due to the following reasons: virtualization (a) handles resource multiplexing transparently to the applications, (b) provides almost native performance to applications running on VMs, (c) ensures performance isolation since each VM is configured to guaranteed resources, and (d) is widely applicable, as VMs host heterogeneous operating systems.
Management tools that adapt the resource shares of virtualized applications according to their demands are integral to capitalize on this technology and create a truly agile environment for resource sharing. On one hand server applications need to be provisioned adequately to meet their changing resource demands caused by workload fluctuations [AJ00]. If applications are under-provisioned, they fail to comply with their performance goals. On the other hand, on-demand provisioning enables unused resources to be allocated for other applications to use. Server consolidation increases machine utilization, decreases the number of required machines and therefore decreases costs for power and cooling.
Modern server applications are typically based on the multi-tier paradigm. Each tier (or component) usually runs on its own server, executing some of the application's operations. All components are connected as required to serve incoming requests. In multi-component systems, each tier uses a different amount of resources to process incoming requests, and there is a correlation between the utilization of the various tiers. Server applications are usually modeled with queues in tandem. If any of the tiers is inadequately provisioned, the overall server performance is affected. In fact, when workload fluctuations happen in resource provisioned server components, the saturation point can be moved from one component to another, causing prolonged poor performance [ZCS05].
This paper addresses CPU resource provisioning for virtualized multi-tier applications. Initially, it presents a Single-Input Single-Output Usage-Based (SISO-UB) feedback controller that adapts the CPU allocations of virtualized server components while adjusting to varying resource demands due to workload changes. Building on the SISO controller, we also present a Multi-Input Multi-Output Usage-Based (MIMO-UB) feedback controller that collectively allocates CPU resources to all components by considering the resource coupling among the tiers. Our technique is tested against a 3-tier server benchmark application deployed on Xen-virtualized [BDF+03] machines. Results show that the MIMO-based provisioning enables the application to react faster to workload changes, and improves performance when compared to the SISO-based approach.
The rest of this paper is organized as follows. Section 2 presents the prototype virtualized cluster used for the evaluation. Section 3 discusses the system identification process that leads to the SISO (Section 4) and MIMO controllers (Section 5). The experimental evaluation is presented in Section 6. Section 7 refers to related work, and Section 8 concludes.
2. PROTOTYPE VIRTUALIZED CLUSTER
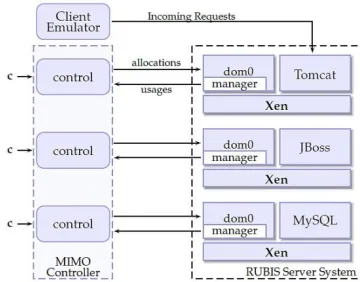
Figure 1 illustrates the prototype virtualized cluster used to evaluate our controllers. The cluster, which consists of three machines running Xen 3.0.2, hosts the Rubis server application [ACC+02]. Rubis is a prototype auction web server which models eBay.com. In this paper we use a 3-tier version of Rubis. Each one of the three server components – Tomcat web server, JBoss application server, and MySQL DB server – is deployed on a separate VM running on a separate physical machine. A fourth machine hosts the Rubis Client Emulator used to generate requests to the server. The Client Emulator also records the response times of requests and is used to evaluate the
performance of our controllers. All machines are connected via a Gigabit Ethernet network.
Figure 1. Virtualized prototype and control system overview. Solid lines between the controller modules and the Rubis Server System depict the three SISO-UB controller systems. The MIMO-UB controller is shown by the dashed rectangle.
Dom0 is the Xen control VM which is used, among other things, to control the user generated VMs.
The controllers presented in this paper determine CPU allocations for VMs. Periodically, the managermodule submits the mean CPU usage for the VM under control over the last interval to the controller module(s). The controller(s) computes the allocations for the next interval and enforces them for the specified VM by using the CPU scheduler interface exported by Xen. Our prototype uses the simple EDF (SEDF) scheduler configured with the “capped” (non-work conserving) option so that no VM can use any more CPU time that it has been allocated. The controller module(s) runs on the same machine as the Client Emulator.
The current prototype controls CPU allocations per VM. To ensure that the server's performance depends solely on the controller(s) CPU allocations, certain actions are taken. All machines have two CPUs, and each one of the two VMs per physical machine is pinned on a separate CPU. This simple setup enables us to study the impact of the controller(s) allocations on the server performance without any implications due to scheduling artifacts among running VMs sharing the same CPU. In future work we hope to demonstrate that our system performs well even when many VMs share a single CPU. Finally, for all the experiments each VM is allocated memory as required when first created and this allocation is kept constant throughout. The network bandwidth is also measured and is never a bottleneck to the application.
3. SYSTEM IDENTIFICATION
[image:3.612.344.524.99.240.2]the first goal without over-provisioning. In this way, the virtualized application is properly provisioned to cope with workload fluctuations while there are free resources for other applications to run.
To build our system we start by measuring the application performance when deployed on the current prototype and define its target QoS level in Section 3.1. To achieve the second goal, we build controller(s) that adjust the components’ allocations while maintaining the application QoS target. Section 3.2 presents the model of the system based on which the two controllers are built (Sections 4 and 5).
There are two workload parameters that affect the server's performance, namely the workload type mix and the number of clients simultaneously issuing requests to the server (hereafter referred to as number of clients). Both parameters affect the CPU utilization of individual components and, consequently, the overall performance of Rubis. The following analysis studies the performance under a changing number of clients but using only a single workload type mix (namely the browsing mix with read-only requests [ACC+02]). A similar analysis can be done for different workload mixes.
3.1 QoS Target
We first measure the performance level that the server achieves when all CPU resources are allocated to it. Ideally, the application should maintain this QoS level even when it is provisioned by the controller(s). The controller(s) should act transparently to the application, and its actions should not disturb the performance of the application.
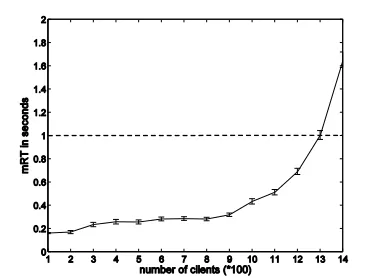
To this end, the application performance is measured when each component is allocated 100% of the CPU capacity and the number of clients varies. Figure 2 shows the mean client response time (hereafter denoted as mRT) and Figure 3 illustrates the corresponding throughput when the number of clients increases from 100 to 1400 in steps of 100. Each measurement is derived from an experiment where the clients issue requests to the server for 200 seconds (s) in total.
As the number of clients increases, the mRT initially stays well below 1s and the throughput increases linearly with the number of clients. However, when the number of clients increases above 1200 the mRT grows above 1s, while the throughput remains constant. It seems clear that the server saturates at around 1200 clients. If more clients issue requests, the mRT increases as requests are delayed in the server queue and the throughput stabilizes despite the increasing number of clients.
[image:4.612.342.530.73.212.2]Figure 2. Mean Request-Response Times; values are plotted with 95% confidence intervals (CIs).
Figure 3. Aggregate Throughput.
Figure 4. CPU utilizations per component. Mean utilizations are shown with error bars of one standard deviation.
[image:4.612.339.530.250.571.2]The QoS performance level can therefore be summarized as: The Rubis benchmark serves up to 1200 clients with a performance of mRT 1s. This denotes the level of performance the server is expected to achieve, even when the controller dynamically allocates CPU resources to the components. We also refer to this QoS value as the reference value.
Throughout the above analysis, the mean statistic is used to summarize the response time and CPU utilization distributions. Analysis showed, that in both cases, the mean is enoughto capture the dynamics of the systems without loss of generality. In the case of response time, similar qualitative conclusions were made when the median of each response distribution was used. Additionally, the CPU utilizations were shown to be normally distributed, and therefore either the mean or the median can be used. For the rest of this paperthe mean is used as the centrality index.
3.2 Controller Design
The controller is the most prominent part of the control system. It adjusts the allocations of all components as workload changes occur in order to maintain the reference QoS performance level. In this paper, we build feedback controller(s) that periodically change the component allocations based on observations of the running application. If a deviation from the QoS performance goal occurs (control error), then the controller adjusts the allocations accordingly. Building such a controller requires the system model which describes the relationship between the control input signals (the parameters that the controller adjusts) to the control outputs (the parameters that are related to the application’s performance). This section identifies the control input/output signals and builds the system model.
Control Signals
The selection and the number of the control input(s)/output(s) signals depend on the task appointed to the controller. Here, the controller dynamically allocates CPU resources for server components. Therefore, the control input(s) are the parameters that change the CPU allocation of the components. This is achieved by using the interface exported by the SEDF CPU scheduler which allows us to assign a percentage of the machine's CPU capacity to a running VM. Since there are three Rubis components, we need three control inputs. The control output(s) are related to the application's performance; candidate metrics include the mRT and the throughput. Another candidate metric is the components' CPU utilization. The CPU utilization indirectly relates to the server's performance; if a server is CPU saturated it is very likely that its performance is degraded. In
addition, the problem addressed here is a CPU allocation one, and intuitively the utilization provides a very good indication of the allocation itself. For each combination of control input/output signals, we aim to discover a meaningful relationship (if there is one) between them with respect to the reference input. If necessary, a transformation of the output signal or the reference input is also possible. Each output signal is now examined.
The first candidate output signal is the mRT. The mRT directly relates to the application’s performance and compares to the reference value. However, in order to use the mRT, there must exist an expressive enough model between it and the components' allocations; changing the allocations should affect the mRT in a meaningful way. To find this relationship we need to change the component allocations and observe the mRT. In fact, rather than changing the allocation, we observe changes in utilization, since an indication of the allocation needed by each component is its own usage. As shown in Figure 2 and in Figure 4 the mRT remains almost the same as the number of clients increases, giving no clear indication of how the allocation should be changed if the mRT changes. In addition, measuring the mRT at the server level adds overhead to the control process; for example, a proxy would be required to monitor all requests and keep statistics about them. Therefore, the mRT is not a good control output signal.
The second candidate output is the throughput. As the throughput increases the component usage increases too, indicating a quite potentially useful relationship between the two for control purposes. However, the throughput is not properly related to the reference value. A server performance with mRT 1s is achieved with various number of clients and, thus, different throughput values actually give no indication of the actual usage (see Figure 3). An alternative approach would be to change the reference value to be the throughput. However, referencing according to throughput does not provide us with a good indication of the performance. For example, if the reference throughput is set to 100 – which is achieved with at least 600 clients – and the number of clients increases beyond 600, the controller would not change the allocation, as the goal would have been reached. Finally, measuring the throughput at the server level introduces additional overhead, as in the case of the mRT and it is therefore not suitable to use as a control output.
observed over one period of time can be used as a reference for the allocation for the next one. The usage is easily measured at the server side, it does not require any domain knowledge for the application itself, and it has negligible cost over the control process. In order for the controller to maintain the performance at the reference value, the allocations should follow the components’ utilizations.
System Model
The controller aims to allocate the CPU resources of each component based on the control error between the measurements of the CPU utilizations and the mRT reference signal. However, since the two metrics that account for the error are different, a transformation is required. The following experiments aim to find the relationship between the allocation and the usage signals, so that the mRT stays below its target value of 1s.
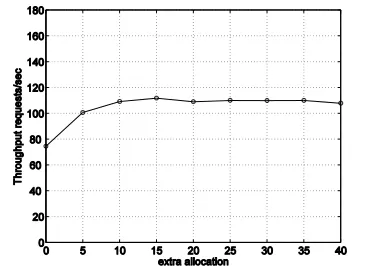
To this end, we vary the allocation of each component successively as the number of clients remains constant (800 in this case) and we observe the application’s performance. The initial allocation for each component equals the mean usage in the case of 800 clients as measured offline. We then increase the allocation (hereafter denoted as extra allocation) by a number ranging from 0 up to 40 in steps of 5. The allocation for the other two components is set to 100% of their CPU capacity. The mRT and the throughput in the case of the varying allocation for the JBoss component are shown in Figure 5 and Figure 6 accordingly. As the extra allocation increases the mRT decreases and the throughput increases. Both the mRT and throughput stabilize when the extra allocation is above 10. Increasing the allocation above this value does not improve the performance significantly. Similar experiments were performed for the other two components and results showed that the extra allocation beyond which the application performance stabilizes is 15 for the Tomcat component 10 for MySQL1.
Therefore, in order to maintain the reference QoS value, we need to keep the allocation a certain amount above the utilization. We define a component's
i
CPU allocationa
i to be the percentage of the total CPU capacity of a physical machine allocated to a running VM; a component's measured CPU usage or utilizationi
u
to be the percentage of the total CPU capacity actually used by that component. Ifr
i denotes the1
Note that these experiments provide the minimum values for the extra allocations. A more extensive analysis is required (e.g. varying number of clients, changing workload mixes, combinations of components and varying allocations) for a more accurate estimation of the extra allocations.
extra allocation for component
i
that is required to maintain the target QoS performance level then, the relationship between the allocation and the mean utilization is given by:i i i
r
u
[image:6.612.342.549.123.294.2]a
. (1) [image:6.612.343.529.330.463.2]Figure 5. mRT as the extra allocation increases.
Figure 6. Throughput as the extra allocation increases.
Maintaining the allocation above the utilization is a common practice and has been observed elsewhere. In data centers there is usually some amount of headroom of CPU resources to enable the application to cope with workload fluctuations and variable utilizations. In [PSZ+07]an adaptive integral feedback controller regulates the CPU utilization of virtualized server applications at 80% of the allocation.
The next two sections describe two controllers based on the system model derived above. Section 4 presents one controller per component and Section 5 describes one controller for all components which considers their resource coupling.
4. SISO USAGE-BASED CONTROLLER
separately. The SISO-UB control law for component
i
is given by:
i k i k i k i
e
u
p
a
1 , (2)and its control error is calculated by:
)
(
ki kii i
k
r
a
u
e
, (3)where
k
points to the time interval;p
i indicates the proportion of the usage that the allocation is assigned to (and must be 1); and is a tunable parameter that indicates the proportion of the final error that is applied towards the final allocation. The controller is globally stable when:1
(4)(Due to space limitations this proof is not given here.) The purpose of the SISO-UB controller is to maintain the difference between the allocation and the utilization (control error) at the reference extra allocation. The controller always allocates more resources than the CPU usage since the absolute error is used. If the difference between the allocation and the usage at time
k
equals the reference value, the control error becomes zero. To always allocate more CPU than the usage,p
iis introduced. In this way, the assigned allocation for each componenti
a
will always be larger than or equal top
iu
kiproviding at least some minimum resources. The reference value
r
i here serves as a second parameter, which ensures that the CPU allocation for small CPU usage possesses a specific absolute margin, which would not be the case if only the factori k i
u
p
is used. In general, ther
i values can be assigned in many different ways, in order to be higher for noisy workloads and lower for more predictable workloads. The next section describes the MIMO-UB controller where the errors from all components are considered in the final allocations.5. MIMO-UB CONTROLLER
This section presents the Multi-Input Multi-Output (MIMO) Usage-Based (MIMO-UB) controller for all the components. This controller is based on the SISO-UB controller but additionally uses the CPU resource coupling between the components to collectively allocate resources for all of them.
5.1 Motivation
Each tier uses different amount of resources to process incoming requests since they perform different sets of operations on them. With Rubis, for example, Tomcat consumes the most CPU while JBoss consumes the least (Figure 4). When dynamically allocating resources, the controller should take into account each component's distinct demands. In addition, in multi-tier systems the resource usages of the different components are closely related. This makes intuitive sense since the workload on each component is affected by the workload on the rest. If one of the components does not have enough resources to process all incoming requests (bottleneck component), then the rest of the components cannot process the requests of more clients.
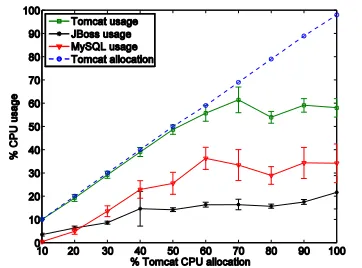
This behavior is further demonstrated by the following experiment in which we vary the allocation of only one of the components. The CPU allocation of the Tomcat component is varied from 10 to 100 in steps of 10, the number of clients is kept constant at 800, and each of the other two components are allocated 100% CPU. As shown in Figure 7, Tomcat’s usage follows the allocation until the allocation exceeds that required for the current workload. The usage of the other two components increases slowly, despite being allocated with the necessary resources to serve 800 clients. In this case the bottleneck component is Tomcat and, since it does not have adequate resources to cope with the current workload, the other components' usages are affected as well. We have observed similar behavior when either the JBoss or the MySQL components are subject to varying allocation.
Figure 7. Mean CPU utilizations per component as the Tomcat allocation varies; error bars show one standard deviation.
[image:7.612.345.526.468.602.2]explicitly takes into account the coupling of CPU usage between all components.
5.2 Controller Design
The MIMO-UB controller uses the CPU usage coupling among components to assign new allocations for all of them. Building on the SISO-UB controller, the MIMO-UB control law is given by:
k k
k
Pu
LMe
a
1 , (5)and its control error is calculated by:
)
(
k kk
r
a
u
e
. (6)If
c
denotes the number of application components, then:a
kR
c1,u
kR
c1,r
kR
cx1, ande
kR
cx1are the allocation, utilization, reference extra, and error vectors respectively and each row corresponds to a component;
P
R
c c is a diagonal matrix with the minimum proportion of the utilization considered for each component along its diagonal;L
R
cc is a diagonal matrix with the tunable parameter that accounts for the error for each component along its diagonal; andM
R
ccis a square matrix with the resource coupling relationships between pairs of components along its elements. If the utilization relationship between pairs of components is linear, thenM
is:1
1
1
1 1 1 1 1 2
c c c c c c cM
,where i (i {1,2,…,c}) are the coefficients of the linear utilization relationships between components. The MIMO-UB in the case of a 3-tier application is stable when:
3
/
1
(7)(Due to space limitations, this proof is not given here.) To better explain the MIMO-UB controller and the way
M
is used consider the example of the three Rubis components. First, the relationships between the different components usages is extracted. Data is collected offline (10 sets of CPU usages for all three components in the range of [100, 1200] clients) and then processed with the aid of the MATLAB Curve Fitting Toolbox. The CPU usage for all components(denoted by
u
1,u
2, andu
3) are found to be linearly related: 1 2 1 1u
u
, (8)2 3 2 2
u
u
, (9)3 1 3 3
u
u
, (10)where i and i (i {1,2,3}) are the coefficients found within 95% of CIs over the collected dataand are used to build
M
.The MIMO-UB controller differs from the SISO-UB controllers in how it accounts for the control error. When the MIMO-UB controller calculates the final allocation for each component, the control errors from all components are considered. For example, in the Rubis application when calculating the Tomcat (component 1) allocation the control error is given by:
3 2 1 2 1
1
e
e
e
. This is the sum of all components' errors mapped to the utilization of the Tomcat component. Therefore, any new allocation considers a percentage of the sum of all components' errors. In this way, even if the Tomcat component had a very small error, but another component a large one, the Tomcat’s allocation would be adjusted accordingly. In contrast, the Tomcat SISO-UB controller only considers its own error. By taking into account all components’ errors the MIMO-UB controller aims to react more quickly to workload changes.In this case, the array
M
is built based on the linear relationship among the components’ utilizations. However, this relationship might not be appropriate for all applications. Furthermore the offline computation of its elements might not be desirable when deploying a new application or when the application exhibits frequent changes in workloads. To address these issues, an alternative way is to compute and updateM
online. In this way, the coupling between the utilizations can be approximated by piecewise linear relationships and therefore we can retain the current form ofM
. Re-calculatingM
periodically allows us to store only small amount of data while also capturing varying workload conditions.6. RESULTS
6.1 SISO-UB
For the SISO-UB study we perform the following experiment: 300 clients issue requests to the server for 60 intervals in total. At the 30th interval another 300 are added for the next 20 intervals, doubling the server’s workload. At the 40th
interval the number of clients drops back to the initial 300. Each interval lasts for 5s, which enables the controller to react quickly to workload changes. The parameters for this experiment are:
p
i1
.
25
,
r
i30
,
i0
.
3
.
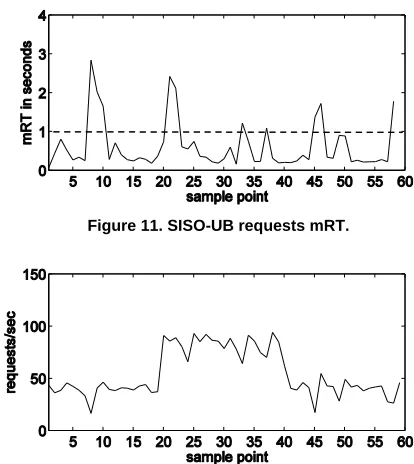
The SISO-UB allocations for the Tomcat, JBoss, and MySQL components are shown in Figure 8, Figure 9, and Figure 10 respectively. Each controller adjusts its allocations to follow both notable changes in the number of clients (20th and 40th intervals) as well as smaller variations throughout the experiment. By adjusting the allocations the controllers free resources whenever possible for other applications to use. The resulting Rubis application performance is shown in Figure 11, which illustrates the mRT, and Figure 12, which shows the throughout. Overall the mRT stays close to its reference target. However, there are some spikes that happen when the utilization of one or more of the components approaches very close to its allocation. In these cases the throughput drops. There are two reasons why the SISO-UB controller’s allocations cause the application to deviate from its reference value. Firstly, this is a reactive system, which reacts to a workload change only after it is detected. If during an interval the utilization increases up to its allocation, then the controller reacts to it only in the next interval. However, the performance of the application for that interval drops. Secondly, this is a multi-tier application and the saturation point can be moved from one component to the next until all components are properly provisioned. The MIMO-UB controller evaluated in the next section is designed to explicitly consider this behavior.
6.2 MIMO-UB
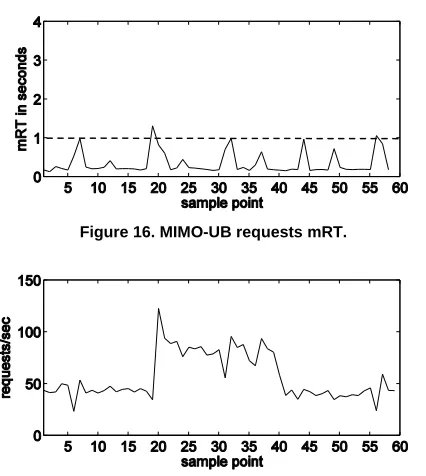
[image:9.612.326.534.76.171.2]Figure 13, Figure 14, and Figure 15 illustrate the MIMO-UB controller allocations for the Tomcat, JBoss, and MySQL components respectively. Again, the allocations adapt to the diverse and changing utilizations. Figure 16 illustrates the mRT and Figure 17 shows the corresponding throughput for the duration of the experiment. The mRT is maintained at its reference value for the majority of the experiment with fewer and shorter spikes above 1s when compared to the SISO-UB mRT (Figure 11).
Figure 8. SISO-UB Tomcat allocations and utilizations.
Figure 9. SISO-UB JBoss allocations and utilizations.
[image:9.612.327.534.468.700.2]Figure 10. SISO-UB MySQL allocations and utilizations.
Figure 11. SISO-UB requests mRT.
Figure 13. MIMO-UB Tomcat allocations and utilizations.
[image:10.612.69.275.205.304.2]Figure 14. MIMO-UB JBoss allocations and utilizations.
[image:10.612.67.277.334.433.2]Figure 15. MIMO-UB MySQL allocations and utilizations.
Figure 16. MIMO-UB requests mRT.
Figure 17. MIMO-UB requests throughput.
Figure 18. CDF plot for the SISO-UB individual requests RT (regular line) and the MIMO-UB requests RT (solid line).
Similarly, the throughput remains stable with some drops. To better compare the two controllers, Figure 18 shows the Cumulative Distribution Function (CDF) for all request-response times (RTs) during the experiments. In the case of the MIMO-UB controller more than 90% of the requests have a RT below 1s. However, in the case of the SISO-UB controller fewer than 90% of the requests achieve this.
The improved performance of the MIMO-UB controller is due to the higher allocations for given utilizations when compared to those coming from the SISO-UB controllers. This is because this controller considers the sum of all components’ errors. Although the SISO-UB controllers could perform as well as the MIMO-SISO-UB if they are configured to provide higher allocations (e.g. by increasing
p
i), the MIMO-UB allocates more resources as indicated only by the control errors. The next section formally compares the two controllers.6.3 Comparison
This section compares the performance of the SISO-UB and the MIMO-SISO-UB controllers and focuses on the ability of the MIMO-UB mechanism to adapt to large workload changes.
When the two controllers are configured with same parameter values, the MIMO-UB controller outperforms the SISO-UBs because it allocates more resources to components and considers the aggregate error from all components; this was shown in Section 6.2 and Section 6.3. This section compares the two controllers against large workload increases when they are both configured to make similar allocations under stable workloads.
[image:10.612.69.282.457.695.2]similar additional resources under a stable number of clients are identified. Secondly, using these values the controllers are compared when a large workload increase occurs. This is simulated by an experiment where 200 clients issue requests for 40 intervals. At the 25th interval, another 600 clients are added for the next 15 intervals.
metric abbreviation
metric description
CR number of completed requests NR percentage of completed
requests with RT 1s. additional the sum of the differences of
CPU resources between the allocations and the utilizations.
Table 1. Description of the performance metrics used for the comparison between the SISO-UB and the MIMO-UB.
For the first step, the additional allocations for each controller and for different values are measured using experiments with stable 600 clients for 60 intervals repeated 10-20 times. The range of values comes in the case of the SISO-UB controllers from Equation (4) and in the case of the MIMO-UB from Equation (7). Pair-wise comparisons of the additional allocations between the two controllers for different values are performed and two combinations of parameters that give almost identical additional allocations are identified: (SISO-UB
0
.
45
and MIMO-UB0
.
12
) and (SISO-UB0
.
75
and MIMO-UB0
.
2
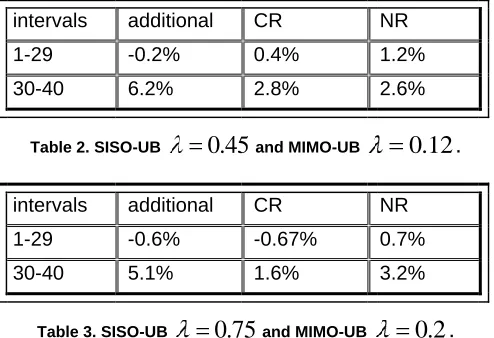
).For each of the two combinations of parameters the controllers are now compared when a large workload increase occurs. The metrics used for the comparison are defined in Table 1 above, and the results are shown in Table 2 and Table 3 below.
[image:11.612.54.298.158.279.2]intervals additional CR NR 1-29 -0.2% 0.4% 1.2% 30-40 6.2% 2.8% 2.6%
Table 2. SISO-UB
0
.
45
and MIMO-UB0
.
12
.intervals additional CR NR 1-29 -0.6% -0.67% 0.7% 30-40 5.1% 1.6% 3.2%
Table 3. SISO-UB
0
.
75
and MIMO-UB0
.
2
.Each of these tables compares the controllers across two regions of intervals. The first region (intervals 1-29) involves the period before the workload increase and is used to confirm that the two controllers allocate a similar amount of additional resource. The second region (intervals 30-40) is the time during the workload increase. Percentages in each case show the difference between the controllers in the metric of interest. A positive number indicates that the metric in the MIMO-UB case is larger than in the SISO-UB. All results are within a 95% CI after a t-test is applied. Results show that during the first 29 intervals the controllers have very similar performances (first row in both tables). Their additional metrics are very close and so is their performance, shown by CR and NR. However, during the intervals of the workload change (second row in both tables) the MIMO-UB controller allocates more resources despite being configured to make similar allocations to the SISO-UB. The increased allocations cause the MIMO-UB controller to have better performance as shown by the increased number of completed requests (CR) and the proportion of requests with mRT 1s (NR).
The MIMO-UB controller is able to react faster to workload increases by allocating more resources than the SISO-UB controllers because it accounts for all components' errors according to their resource coupling model. In this case, the error from any component is translated to an error for any other component. In this way, the MIMO-UB adjusts the allocations so that all components are settled down to the workload change as soon as possible.
7. RELATED WORK
7.1 Control in Resource Provisioning.
Control theory has been used to design controllers for allocating CPU resources in virtualized server applications.
Wang et al. [WZS05] present a nonlinear gain-adaptive integral controller that regulates the relative utilization at a target value for single resource containers. The same controller in combination with other controllers has been studied in virtualized environments in order to: (a) allocate the CPU resources for co-located multi-tier applications [PSZ+07] (b) maintain the server response time within user-specified limits [ZWS06]; and (c) regulate the response time to a reference value with the aid of a performance model based on transaction mixes to better estimate the utilization across tiers [WLZ+07].
[image:11.612.53.300.547.716.2]The MIMO-UB controller presented in this paper collectively allocates resources to multi-tier virtualized applications based on the relationship between the utilization of the various components.
In [KCH09], the integration of the Kalman filtering technique into feedback controllers is presented. The authors present two categories of controllers: SISO controllers to allocate resources for individual tiers and a MIMO controller for all the application component. The Kalman-based SISO controllers offer tuning capabilities that make the allocations less variable than the utilizations. The Kalman-based MIMO controllers are built to capture the resource coupling based on the utilization variances.
In addition to the feedback control approach, predictive control has also been applied to dynamic resource provisioning. Xu et al. [XZSW06] present a predictive controller that regulates the relative utilization of a single-tier virtualized server based on three time-series prediction algorithms. Results show that once the predictive model is properly trained either via on-line or off-line analysis, the predictive controllers adapted faster to repeated CPU usage trends. However, the predictive controllers performed poorly against newly seen behavior. Our controllers consider only the recent utilization history of the previous interval, and so are less fragile in the face of large workload changes.
7.2 Machine Learning Modeling
Machine learning approaches to performance modeling in virtualized environments have also been developed.
Xu et al. [XZF+07] present a two-layer resource management system that aims to minimize the resources consumed for single-tier applications to meet their SLAs, while maximizing the profit of a utility function over the “revenue” from shared resources. They use fuzzy modeling to learn the relationship, modeled as a group of states, between the workload and the required resource levels to meet SLAs. Tesauro et al. [TJDB06]apply Reinforcement Learning to data center server allocation. The authors employ a two-layer resource management. For each application at the first layer an application manager provides a utility curve of its expected value based on the number of allocated servers. At the second layer, a resource arbiter decides how to allocate servers among all applications so as to maximize some global utility function.
7.3 Queuing Modeling Techniques
Finally, queuing models have also been used to model the performance of server applications.
Urgaonkar et al. [UC05] use a queuing model to predict the resources of application tiers. Based on this
model, they redistribute the workload to application servers in a shared infrastructure.
Bennani et al. [BM05] study the applicability of analytical models for resource provisioning on virtualized environments through simulation.
Zhang et al. [ZCS07] model multi-tier server applications. Their model predicts performance metrics for diverse transaction-based mixes, using pre-computed CPU demands per transaction type from aggregate measurements over all requests on a given hardware.
This paper employs a black-box approach to modeling the resource coupling between components.
8. CONCLUSIONS
This paper has presented two feedback controllers which dynamically adjust the CPU allocations of virtualized multi-tier applications. The SISO-UB controller allocates resources to individual application components. The purpose of the controller is to maintain the allocations of the next interval above the measured utilizations over the previous interval. The MIMO-UB controller is inspired by the SISO-UB, but, crucially, allocates CPU resources to all components collectively based on their estimated resource coupling. Results showed that both controllers adapt to workload fluctuations. However, the MIMO-UB controller offers better server performance than the SISO-UB because it considers the control errors from all components.
Using the feedback controller, the allocations are provisioned on demand and therefore, there are free resources for other applications to run. In this way, high resource utilization per physical machine can be achieved.
9. REFERENCES
[ACC+02] C. Amza, A. Chandra, A. Cox, S. Elnikety, R. Gil, K. Rajamani, W. Zwaenepoel, E. Cecchet, and J. Marguerite. “Specification and Implementation of Dynamic Web Site Benchmarks”. In Proceedings of the 5th Annual IEEE International Workshop on Workload Characterization (WWC-5), pages 3-13, 2002.
[AJ00] M. Arlitt and T. Jin. “A Workload
Characterization Study of the 1998 World Cup Web Site”. IEEE Network, 14(3):30-37, May/June 2000. [BDF+03] P. Barham, B. Dragovic, K. Freiser, S. Hand, T. Harris, A. Ho, R. Neugebauer, I. Pratt, and A. Warfield. “Xen and the Art of Virtualization”. In
Proceedings of the 19th ACM Symposium on Operating Systems Principles (SOSP), pages 164-177, 2003. [BM05] M. Bennani and Daniel Menasce. “Resource Allocation for Autonomic Data Centers using Analytical Perfomance Models”, In Proceedings of the 2nd IEEE International Conference on Autonomic Computing (ICAC), pages 229-240, 2005.
[KCH09] E. Kalyvianaki, T. Charalambous, and S. Hand. “Self-Adaptive and Self-Configured CPU Resource Provisioning for Virtualized Servers Using Kalman Filters”, In Proceedings of the 6th International Conference on Autonomic Computing and
Communications (ICAC), 2009.
[LZP+07] X. Liu, X. Zhu, P.Padala, Z. Wang, and S. Singhal. “Optimal Multivariate Control for Differentiated Services on a Shared Hosting Platform”. In
Proceedings of the 46th IEEE Conference on Decision and Control, pages 3792-3799, 2007.
[PSZ+07] P. Padala, K. Shin, X. Zhu, M. Uysal, Z. Wang, S. Singhal, A. Merchant, and K. Salem. “Adaptive Control of Virtualized Resources in Utility Computing Environments”. In Proceedings of the European Conference on Computer Systems (EuroSys), pages 289-302, 2007.
[TJDB06] G. Tesauro, N. K. Jong, R. Das, and M. N. Bennani. “A Hybrid Reinforcement Learning Approach to Autonomic Resource Allocation”, In Proceedings of the IEEE International Conference on Autonomic Computing (ICAC), pages 65-73, 2006.
[US04] B. Urgaonkar and P. Shenoy. “Sharc: Managing CPU and Network Bandwidth in Shared Clusters”. IEEE Transactions on Parallel and Distributed Systems,15(1):2-17, 2004.
[UC05] B. Urgaonkar and A. Chandra. “Dynamic Provisioning of Multi-Tier Internet Applications”. In Proceedings of the 2nd International Conference on Autonomic Computing (ICAC), pages 217-228, 2005. [VMware] VMware, Inc., http://www.vmware.com/, website as of April 2009.
[WLZ+07] Z. Wang, X. Liu, A. Zhang, C. Stewart, X. Zhu, T. Kelly, and S. Singhal. “AutoParam: Automated Control of Application-Level Performance in Virtualized Server Environments”. In Proceedings of the 2nd IEEE International Workshop on Feedback Control
Implementation in Computing Systems and Networks (FeBid), 2007.
[WZS05] Z. Wang, X. Zhu, and S. Singhal. “Utilization and SLO-Based Control for Dynamic Sizing of
Resource Partitions”, In Proceedings of the 16th IFIP/IEEE International Workshop on Distributed Systems: Operations and Management (DSOM), pages 133-144, October, 2005.
[XZF+07] J. Xu, M. Zhao, J. Fortes, R. Carpenter, and M. Yousif. “On the Use of Fuzzy Modeling in
Virtualized Data Center Management”, In Proceedings of the 4th International Conference on Autonomic Computing (ICAC), 2007.
[XZSW06] W. Xu, X. Zhu, S. Singhal, and Z. Wang. “Predictive Control for Dynamic Resource Allocation in Enterprise Data Centers”. In Proceedings of the 10th IEEE/IFIP Network Operations and Management Symposium (NOMS), pages 115-126, 2006.
[ZCS07] Q. Zhang, L. Cherkasova, and E. Smirni. “A Regression-Based Analytic Model for Dynamic Resource Provisioning of Multi-Tier Applications”. In Proceedings of the 4th International Conference on Autonomic Computing (ICAC), 2007.