City, University of London Institutional Repository
Citation
:
Xu, Fang Yuan (2011). Smart grid framework analysis and artificial neutral network in load forecast. (Unpublished Doctoral thesis, City University London)This is the accepted version of the paper.
This version of the publication may differ from the final published
version.
Permanent repository link:
http://openaccess.city.ac.uk/19752/Link to published version
:
Copyright and reuse:
City Research Online aims to make research
outputs of City, University of London available to a wider audience.
Copyright and Moral Rights remain with the author(s) and/or copyright
holders. URLs from City Research Online may be freely distributed and
linked to.
City Research Online: http://openaccess.city.ac.uk/ [email protected]
CITY UNIVERSITY
• LONDON
Smart Grid Framework Analysis and Artificial
Neural Network in Load Forecast
By
Fang Yuan Xu
This thesis is submitted for the Degree of
Doctor of Philosophy
At
City University London
School of Engineering and Mathematical Sciences
SMART GRID FlUME WORK ANALYSIS AND ARTIFICIAL NEUIUL NETWORK IN LOAD FORECAST
Acknowledgement
It is my honour to express my respect and gratitude to my supervisor Professor Loi
Lei Lai for his professional support and supervision to my PhD study with patient. His
novel researching style directs me on forming my own research skills. With the
bi-directional communication, he introduced the world-leading technologies and latest
development to me. Every time I met difficulties, his encouragement is my incentive
towards the challenges. I am highly grateful to his help and kindness.
I would like to express my thankfulness to Dr Ma Yingnan, Dr Zhou Long, Zhang
Hao Tian and many other colleagues
in
Energy System Group, City University
London. Researching together for years, communications with them not only give me
inspiration but also make my research a pleasure.
I would like to convey my appreciation and gratefulness to my parents, Jian Ping Xu
and Jia Ning Dai for their self-forgetful loves and support to me. I miss them every
day abroad.
It
is my honour to express my thanks to Lai Chi Ken, Zhu Feng,
Li
Zhi, Hao Zhou
and Si Jia Lu. They offer their helps on providing materials and resources when I need.
I appreciate the solicitude from my girl-friend
LiPei Pengo Her patient and love is my
Finally I would like to thank all guides from Kildare Walk 21: Zhi Hao Zhong, Li
Yan Zhang, Zhi Hong Zhong, Cheng Cheng Cui, Sheng Li Jiang and Tracy Zhang.
They bring love and joy to my study life in the UK.
SMART GRID FRAMEWORK ANALYSIS AND ARTIFICIAL NEURAL NETWORK IN LOAD FORECAST
Abstract
Power system is the one of the most critical parts of the whole energy utilization
around the world. Recently people pay more attention to the energy utilization, new
types of generations, storages and power utilization need to increase energy efficiency
and reduce carbon emission. Due to the power grid currently is still mainly under the
old-designed approach, it is increasingly exposed limitation on efficiency
enhancement, security and reliability improvement, new technologies compatibility
and meeting larger power capacity requirements.
Thus, Smart Grid is 'born' to improve power grid for these requirements. It is an
overlapping area between power system and digital technology, intelligent technology,
communication technology and so on. Smart Grid can provide updates for nearly all
sections of traditional power grid. It is a systematic framework that new technologies
integration, system development strategy and planning, customers' awareness
improvements and supports from all relevant areas. The areas must be operated in
coordination and parallel.
Firstly, this thesis introduces Smart Grid and Smart Metering on its definition,
characteristics and deployment.
Secondly, this thesis describes a load forecasting system for macro-grid. Artificial
Neural Network (ANN) was introduced to achieve this work for its excellent mapping
approximation ability.
In
the third section, thesis focuses on load forecasting for micro-grid.Back-Propagation method is used to train the Multi-layer Perceptron (MLP) ANN and its
results were compared to that from Radial Basis Function (RBF) ANN. Analysis was
focused not only on the two networks but also ANN generalization problems and
List of Publications
[1]. Fang yuan Xu, Loi Lei Lai,
'A Study on Design and Functionalities of SmartGrid',
Power and Energy Society General Meeting, 2011 IEEE, pp. 1-5, Oct 2011,
Print ISBN: 978-1-4577-1000-1.
[2]. Fang yuan Xu, Long Zhou, Yi Lin Wu, Yingnan Ma,
'Standards, Policies andCase studies in smart metering' ,
Power and Energy Society General Meeting,
2010 IEEE, pp. 1-5, Sep 2011, Print ISBN: 978-1-4244-6549-1
[3]. Fang yuan Xu, Long Zhou, Loi Lei Lai,
'Application of Artificial Neural Networkin electrical analysis of micro-grid load' ,
Power and Energy Society General
Meeting, 2010 IEEE, pp. 1-5, Sep 2010, Print ISBN: 978-1-4244-8357-0
[4]. Fang yuan Xu, Loi Lei Lai,
'Simple intelligent 3-phase power quality detectingframeworkfor microgrid',
2011 International Conference on Machine Learning
and Cybernetics, Volume 3, pp. 1319 -1323, Sep 2011, Print ISBN:
978-1-4577-0305-8.
[5]. Fang yuan Xu, Leung, M.C., Long Zhou,
'A REF networkfor short - term loadforecast on microgrid',
2010 International Conference on Machine Learning and
Cybernetics, Volume 6, pp. 3195 - 3199, Sep 2011, Print ISBN:
978-1-4244-6526-2
[6]. Hao-Tian Zhang, Fang yuan Xu, Long Zhou,
'Artificial neural networkfor loadforecasting in smart grid',
2010 International Conference on Machine Learning
and Cybernetics, Volume 6, pp. 3200 - 3205, Sep 2010, Print ISBN:
978-1-4244-6526-2.
[7].
Long Zhou, Fang yuan Xu, Ying nan Ma, •
Impact of smart metering on energySMART GRID FRAMEWORK ANALYSIS AND ARTIFICIAL NEURAL NETWORK IN LOAD FORECAST
[8).Fang yuan Xu, Loi Lei Lai, 'Multi-Agent Demand Side Management Framework Design/or Micro - Grid', IEEE Transactions on Smart Grid. (to be submitted)
Table of Content
ACKNOWLEDGEMENT ... II
ABSTRACT ... ~ ... IV LIST OF PUBLICATIONS ... V TABLE OF CONTENT ... VII LIST OF FIGURES ... XI LIST OF TABLES ... XIII
COPYRIGHT DECLARATION ...
xv
Chapter 1 ... 1
Introduction ... 1
1.1
Thesis Organization ...2
1.2
Original Contribution ...3
Chapter 2 ... 5
Smart Grid ... 5
2.1
Introduction ...5
2.2
Smart Grid Definition ... 52.3
Drive of Smart Grid ... 72.4 Smart Grid Scope Design Procedure ... 8
2.4.1
Smart Grid Characteristics ...9
2.4.2
Smart Grid Technologies Metrics ...12
2.5
Smart Grid Scope ... 132.5.1
Bulk Generation ...14
2.5.2
Transmission ...15
2.5.3
Distribution ... 162.5.4
Customer ...17
2.5.5
Operations ...17
2.5.6
Markets ... 182.5.7
Service Provider ...19
2.6 Smart Grid Related Organization and Standards ... 20
SMART GRID FlUME WORK ANALYSIS AND ARTIFICIAL NEUIUL NETWORK IN LOAD FORECAST
2.6.2 International Electrotechnical Commission (1EC) and Its Smart Grid ... 21
2.6.3 ZigBee Alliance and Its ZigBee Communication Tech for Smart Grid ... 23
2.6.4 HomePlug Powerline Alliance and Its HomePlug Powerline Tech for Smart Grid ... 24
2.7 Smart Grid Benefit ... 27
2.8 Smart Grid Demonstration Projects ... ~ ... 28
2.8.1 Pacific Northwest Smart Grid Demonstration Project.. ... 28
2.8.2 EPR! Smart Grid Demonstration Initiative ... 30
2.9 Conclusion ... : ... 32
Chapter 3 ... 33
Smart Metering Infrastructure ... 33
3.1 Smart Metering Introduction ... 33
3.2 Smart Metering Infrastructure Benefits ... 34
3.2.1 Consumer Benefits ... 34
3.2.2 Utilities Benefits ... 35
3.2.3 Social and Environment Benefits ... 35
3.2.4 Other Benefits ... 36
3.3 Smart Metering Technologies ... 36
3.4 Smart Metering Standards ... 38
3.5 Smart Metering Worldwide ... 39
3.5.1 Smart Metering in UK ... 39
3.5.2 Smart Metering in Italy ... 40
3.5.3 Smart Metering in United States ... 40
3.5.4 Smart Metering in Oceania ... 41
3.6 Conclusion ... 42
Chapter 4 ... 43
Artificial Neural Network in Load Forecasting of Smart Grid ... .43
4.1 Introduction to load forecasting ... : ... 43
4.2 Introduction to Artificial Neural Network (ANN} ... .45
4.2.1 Artificial Neural Network Model... ... 45
4.2.2 History of Artificial Neural Network Development ... .46
4.3.1 Perceptron Basic ... 47
4.3.2 Multi-layer Perceptron (MLP) ... 49
4.4 Back-Propagation Training of Multi-layer Perceptron ... 50
4.4.1 Supervised Learning and Unsupervised Learning ... 51
4.4.2 Delta rule and Gradient Descent with Batch Learning ... 51
4.4.3 Back-Propagation (BP) Training Theory ... 51
4.4.4 Back-Propagation Trained ANN for Power Grid Load Forecasting ... 57
4.5 Back-Propagation Training Improvement ... 64
4.5.1 Quasi-Newton Algorithm ... 65
4.5.2 Levenberg-Marquardt (LM) Algorithm ... 66
4.5.3 Load Forecasting by Inlproved BP Trained ANN ... 67
4.6 Simulation Analysis ... 70
4.6.1 ANN Training Analysis ... 70
4.6.2 Performance Analysis ... 73
4.6.3 Calculation Time Analysis ... 75
4.7 Conclusion ... 77
Chapter 5 ... 79
Artificial Neural Network in Load Forecasting of Micro-grid ... 79
5.1 Micro-grid Load Forecasting ... 79
5.1.1 Micro-grid ... : ... : ... 79
5.1.2 Micro-grid Load Forecasting ... 80
5.2 Back-Propagation Trained ANN for Micro-grid Load Forecasting ... 81
5.2.1 System Design ... : ... 81
5.2.2 BP Trained ANN Training and Performance ... 83
5.3 Radial Basis Function Network for Micro-grid Load Forecasting ... 89
5.3.1 Radial Basis Function (RBF) Network ... 89
5.3.2 Radial Basis Function (RBF) Network Training ... 93
5.3.3 Radial Basis Function Network for Micro-grid Load Forecasting ... 97
5.4 Micro-grid Load Forecasting Analysis ... 99
5.4.1 Analysis on Prediction with RBF Networks ... 99
5.4.2 Analysis on ANN Generalization ... : ... 100
SMART GRID FRAMEWORK ANALYSIS AND ARTIFICIAL NEURAL NETWORK IN LOAD FORECAST
5.4.4 Analysis on Compare between Micro-grid and Macro-grid Load Forecast
... ; ... : ... : ... 109
5.S Conclusion ... 113
Chapter 6 ... 115
Conclusion and Future Work ... 115
6.1 Thesis Conclusion ... 115
6.2 Future Work ... 117
List of Figures
Fig 2.1: Smart Grid Scope Design Procedure ... 9
Fig 2.2: Smart Grid Characteristics by NELT ... 10
F{g 2.3: Smart Grid Characteristics by ENSG ... 11
Fig 2.4: NIST Smart Grid Conceptual Framework Model ... 14
Fig 2.5: Bulk Generation ofNIST Smart Grid Conceptual Model ... 15
Fig 2.6: ofNIST Smart Grid Conceptual Model ... 16
Fig 2.7: ofNIST Smart Grid Conceptual Model ... 16
Fig 2.8: Customers ofNIST Smart Grid Conceptual Model ... 17
Fig 2.9: Operation ofNIST Conceptual Model ... 18
Fig 2.10: Market domain ofNIST Smart Grid Conceptual Model ... 19
Fig 2.11: Service Provider of NIST Smart Grid Conceptual Model ... 19
Fig 2.12: Powerline Network Diagram ... 25
Fig 2.13: Smart Grid Home Area Network by Power Line Communications ... 26
Fig 2.14: Key Smart Grid Locations of Pacific Northwest Demonstration Project .... 29
Fig 3.1: Structure of Smart Metering Infrastructure from ESMA ... 34
Fig 3.2: Smart Metering Projects Worldwide ... 39
[image:12.541.45.482.96.734.2]Fig 4.1: Load forecasting on August 30, 2011 for Canadian Ontario Demand by ieso ... 44
Fig 4.2: Biological Neuron ... 45
Fig 4.3: Neuron working procedure ... 46
Fig 4.4: Perceptron neuron model. ... 48
Fig 4.5: Simplified Model of Multi-Layer Perceptron ... 50
Fig 4.6: Forward Calculation and Error Propagation in BP ... 52
Fig 4.7: Typical 3 layers ANN .. : ... 52
Fig 4.8: ANN Batch Training Step ... 57
Fig 4.9: Influencing factors for power demand ... 59
Fig 4.10: Canadian Population Distribution Map ... 61
Fig 4.11: Measurement indices for ANN selection ... 63
Fig 4.12: The first 50 steps of training with 3 different methods On a sample ANN .. 71
Fig 4.13 (a) (b) (c): Examination plot of actual demand and prediction demand ... 72
Fig 4.14: Example of instability of Quasi-Newton algorithm ... 73
SMART GRID FRAMEWORK ANALYSIS AND ARTIFICIAL NEURAL NETWORK IN LOAD FORECAST
Fig 5.2: Chillers system demand prediction structure ... 82
Fig 5.3: Perfonnance of different architecture network ... 85
Fig 5.4: Model ofRBF neuron ... 91
Fig 5.5: Typical RBF network structure ... 91
Fig 5.6: RBF network sense the input point in hyper panel by distance combination 92 Fig 5.7: Flow chart of RBF network training ... 94
Fig 5.8: a sample case of network result variation as goal change with sensitivity 0.1665 ... ; ... 99
Fig 5.9: Off-line learning for load forecast. ... : ... 108
Fig 5.10: On-line learning for load forecast.. ... 108
List of Tables
Table 2.1: Smart Grid Definition ... 6
Table 2.2: Smart Grid Metrics ... 13
Table 2.3: Sample oflEEE Smart Grid Promotion ... 20
Table 2.4: Samples of IEEE Smart Grid Standards ... 21
Table 2.5: Samples of catalogues in IEC Smart Grid Roadmap ... 22
Table 2.6: lEC established standards classification ... 23
Table 2.7: Examples oflEC Smart Grid standards ... 23
Table 2.8: Technical compare between ZigBee and other techniques ... 24
Table 2.9: HomePlug Powerline Technology Application ... 25
Ta~le 2.10: HomePlug Specifications compare ... 26
Table 3.1: Samples of Smart Metering technology options from ESMA ... 37
Table 3.2: Samples oflEC Smart Metering Standards ... 39
Table 4.1: Important Events of ANN Development. ... 47
Table 4.2: Step function for activation function ... 49
Table 4.3: Sigmoid function for activation function ... 49
Table 4.4: Computer details for ANN training ... 58
Table 4.5: ANN selection for BP training in load forecasting ... 63
Table 4.6: Load forecasting by an ANN with 20 neurons in hidden layer ... 64
Table 4.7: ANN architecture selection for load forecast with Quasi-Newton (BFGS) Method ... 67
Table 4.8: Load forecast by ANN with 20 neurons in hidden layer with Quasi-Newton (BFGS) Algorithm ... 69
Table 4.9: ANN architecture selection for load forecast with LM Method ... ,'. 69
Table 4.10: Load forecast by ANN with 20 neurons in hidden layer with Levenberg-Marquardt Algorithm ... 70
Table 4.11: Quasi-Newton (BFGS) trained ANN performances compare ... 74
Table 4.12: Summary of ANN time consumption per epoch ... 75
Table 4.13: Best performance ANN found in this load forecasting ... 77
Table 5.1: 2008-2009 Academic Calendars ... 83
Table 5.2: Network architecture selection for BP training ... 84
SMART GRlD FRAMEWORK ANALYSIS AND ARTIFICIAL NEURAL NETWORK IN LOAD FORECAST
Table 5.4: ANN architecture selection of Quasi-Newton (BFGS) training ... 86
Table 5.5: Load forecasting by a sample Quasi-Newton (BFGS) trained ANN with 10 neu~ons in hidden layer ... 87
Table 5.6: ANN architecture selection of Levenberg-Marquardt training ... 88
Table 5.7: Load forecasting by a sample Levenberg-Marquardt trained ANN with 10 neurons in hidden layer ... 89
Table 5.8: Candidate functions for Radial Basis Function selection ... 90
Table 5.9: Samples of RBF network training results ... 98
Table 5.1 0: Example of RBF network for Micro-grid load forecast ... 98
Table 5.11: Radial Basis Functions with different sensitivities ... 100
Table 5.12: Training comparison between early stopping and over-fitting ... 102
Table 5.13: Examination plot compare the differences between early stopping and over-fitting case ... 1 03 Table 5.14: Training comparison between different architecture ... 105
Table 5.15: Examination plot compare between networks in different architectures 105 Table 5.16: Approximation Ability compare between RBF network and BP network ... 107
Copyright Declaration
The author grants power of discretion to the City University London Librarian to
allow this thesis (SMART GRID FRAMEWORK. ANALYSIS AND ARTIFICIAL
NEURAL NETWORK IN LOAD FORECAST) to be copied in whole or in part
without reference to author. This permission covers only single copies made for study
purposes, subject to normal conditions of acknowledgements.
Fang Yuan Xu
SMART GRID FRAMEWORK ANALYSIS AND ARTIFICIAL NEURAL NETWORK IN LOAD FORECAST
Chapter 1
Introduction
Power system is the one of the most critical parts of the whole energy utilization around the world. Recently people pay more attention to the energy utilization, new types of generations, storages and power utilization need to increase energy efficiency and reduce carbon emission. Due to the power grid currently is still mainly under the old-designed approach, it is increasingly exposed limitation on efficiency
enhancement, security and reliability improvement, new technologies compatibility and meeting larger power capacity requirements.
Thus, Smart Grid is 'born' to improve power grid for these requirements. It is an overlapping area between power system and digital technology, intelligent technology, communication technology and so on. Smart Grid can provide updates for nearly all sections of traditional power grid, including renewable energy generation and new storage integration, Demand Response (DR) and Demand Side Management (DSM), Transmission & Distribution Automation, Electric Vehicle (EV) integration,
Advanced Metering Infrastructure (AMI) and so on. It is a systematic framework that new technologies integration, system development strategy and planning, customers' awareness improvements and supports from all relevant areas. The areas must be operated in coordination and parallel [1] - [6].
In current status, Smart Grid developments still stay at the initial points. Various works are placed at Smart Grid definition, characteristics summarization,
standardization and Smart Grid test bedding. But seldom people have organized the above work in.a reasonable development procedure. This thesis aims to establish one systematic procedure framework that formalizes the design of Smart Grid scope. Works will be constituted with plain sequences in this procedure framework.
Power load, as a main requirement for power system, affects the power flow in every electricity cable. A prediction of power load influences not only planning for all
Neural Network. Moreover, through analysis and compare, this thesis figures out the feature differences between macro-grid load forecast and micro-grid load forecast, Smart Meter plays an important role in demand response. It is more than a measurer but also a platform for demand response and dynamic pricing. In demand response, customers receive the latest load information from Smart Meter before their
consumption. The utilities will provide a predicted price for customer to manage their consumptions, which the predicted price is based on the predicted load. Due to the huge contribution from Smart Meter to load forecast applications, this thesis also concerns about the Smart Metering development.
1.1 Thesis Organization
This thesis mainly focuses on Smart Grid and Power System load forecasting. It consists of 6 Chapters.
Chapter 1 is the main Introduction and describes the layout the whole thesis.
Chapter 2 introduces Smart Grid on its definition, characteristics and constructions. Furthermore, the competitive Smart Grid standardizations is also revealed. Smart Grid demonstration projects worldwide are included to summarize the countries' behaviour toward this new concept.
As the earliest application, Smart Metering system is introduced in Chapter 3. This Chapter provides analysis on policy and standards of Smart Metering worldwide. Case study for each country of their Smart Metering application is included.
Chapter 4 describes a load forecasting system for Macro-grid. Artificial Neural Network (ANN) is introduced to achieve this work for its excellent mapping
approximation ability. Back-Propagation training and its improvements are introduced
SMART GRID FRAMEWORK ANALYSIS AND ARTIFICIAL NEURAL NETWORK IN LOAD FORECAST
Chapter 5 focuses on load forecasting for Micro-grid. Back-Propagation trained MLP ANN and Radial Basis Function (RBF) ANN are applied for comparison. Analysis is placed not only on the two networks but also ANN generalization problems and differences between Micro-grid load and Macro-grid load prediction.
Chapter
6
sUnlmarizes the work done in the study. Based on the current work, direction on future study is pointed out, such as load forecasting system for a mixed load Micro-grid, which integrated with the framework of Demand Side Management (DSM).1.2 Original Contribution
1.
Comparison, analysis and summary of Smart Metering Standards and Policies.This work summarizes the advantages and week points of various Smart Metering projects with their development procedure. It provides a good reference for future Smart Grid development. (Chapter 3)
2. Analysis on Smart Grid design, functionalities and standards. This work organizes Smart Grid's characteristics, functionalities, necessary technologies into a scope design procedure. Comparison is also applied to Smart Grid standards worldwide, which provide a good tutorial for areas aiming to develop Smart Grid system. (Chapter 2)
3. Smart Grid load forecasting system framework design for Macro-grid in Ontario, Canada. This work introduces a Smart Grid load forecast design procedure with considering general influencing factors and Ontario local factors. (Chapter 4) 4. An Artificial Neural Network based load forecasting system design for Ontario,
Canada. This work compares results from different ANN training algorithms and provides a novel explanation for the differences. (Chapter 4)
5. Micro - Grid load forecasting system framework design for City University of Hong Kong. This work compares the differences between macro-grid and micro-grid load forecast problems so as to figure out the traditional method has
SMART GRlD FRAMEWORK ANALYSIS AND ARTIFICIAL NEURAL NETWORK IN LOAD FORECAST
Chapter 2
Smart Grid
2.1 Introduction
The Smart Grid vision presents a new power system with more automatics, more intelligence, more decentralization, more options and consumer participation, and better resilience and management. It is an upgrade from the traditional power grid in all levels, including not only the technologies and management but also the value and the characteristics.
This Chapter proposed a construction of Smart Grid in multi-level with an entire scope framework design procedure. An orbicular Smart Grid description including
characteristics, metrics, standards and technologies will be unfurled.
2.2 Smart Grid Definition
Smart Grid is a large and complicated concept which is still holding debate on its
defmition because of the expected emphasis addressed by each participant.
Various definition of Smart Grid is raised, such as:
. • "The infrastructure to transmit renewably generated electricity from a variety of small and large generation sites scattered over wide areas with the ability to manage both fluctuating supply and loads" by European Climate Forum (ECF) [7].
• "A smart grid is an electricity network that uses digital and other advanced technologies to monitor and manage the transport of electricity from all generation sources to meet the varying electricity demands of end-users" by International Energy Agency [8].
technology in the generation, delivery and consumption of electrical energy." by IEEE [9].
Other Smart Grid definitions are shown in Table 2.1:
Definition provider Smart Grid Defmition
EU Functionalities of Smart A Smart Grid is an electricity network that can cost Grids and smart meters efficiently integrate the behaviour and actions of all
users connected to it - generators, consumers and those that do both - in order to ensure economically efficient, sustainable power system with low losses and high levels of quality and security of supply and safety [10].
DOE Smart Grid book: The A smarter grid provides chances to make the smart grid: An Introduction transformation from a centralized,
producer-controlled network to one that is less centralized and more consumer-interactive, by bringing the
philosophies, concepts and technologies that enabled the internet to the utility and the electric grid. More importantly, it enables the industry's best ideas for grid modernization to achieve their full potential [6]. European Regulators' Group A Smart Grid is an electricity network that can cost
[image:22.541.46.488.125.652.2]for Electricity and Gas efficiently integrate the behaviour and actions of all users connected to it - generators, consumers and those that do both -
in
order to ensure economically efficient, sustainable power system with low losses and high levels of quality and security of supply and safety is [11].Table 2.1: Smart Gnd Definition
But whatever definitions are used, Smart Grid will always be focused when facing the following problems:
• High proportion of high-carbon centralized generation.
• Monotonous market.
• Few options to power quality, services and consumption types.
SMARTGRlD FRAMEWORK ANALYSIS AND ARTIFICIAL NEURAL NETWORK IN LOAD FORECAST
• Vulnerable to attack and disasters
Due to face similar problems, most of the Smart Grid definitions will include the following sections:
• To use new technical methods to improve the efficiency, security and power reliability of each part and the whole electricity grid.
• To provide new services, new customer options and to enable the grid compatibility for new products and new services.
• To set up an entire communicating system and the associated assets that improve the interpretability among related devices for better effect.
2.3 Dl-ive of Smart Grid
New thing is splendid as born with promotion and requirement. Smart Grid, a new set of new value, new characteristics and new technologies, is raised as facing several requirements other than from whimsy.
In 21st century, electric systems in several major economic entities are going to suffer serious bottlenecks, which are mainly placed in persisting supplying clean, reliable and affordable energy services. According to the requirement, the general drivers for Smart Grid are [6]:
• Reliability: Blackouts and brownouts are happen frequently as lacking of automated analytics, slow response times of mechanical switches and lacking of situational awareness on the part of grid operators.
• Efficiency: Based on the large scale of power system, only a small improvement of efficiency representing not only a large consumption reduction but also a significant carbon emitting decrease.
• National Economy: In 2005, extreme weather causing extensive damage of overhead lines in Southern Sweden, burning 400 million € with 70 million m3
wood damaged [12]. The traditional grid not only fails to meet the requirement of economic development but also fails in providing enough protection to
current economic status.
• Security: The traditional grid's centralized structure leaves all the society into the risk of attack. A too much dependency on grid could bring national
banking, communications, and traffic and security systems among others to a complete standstill when attack occurs.
• Environment/climate change: Over half of the electricity worldwide is burning by coal, producing pollution and green house gas.
• Global competitiveness: Facing the development of Smart Grid, countries and organization worldwide are rapidly raising their, solutions to the above problems, trying to capture a leading chance for development and business [6]. The above drives plus several local drives specified for local countries or local areas promote the research and deployment of the Smart Grid.
2.4 Smart Grid Scope Design Procedure.
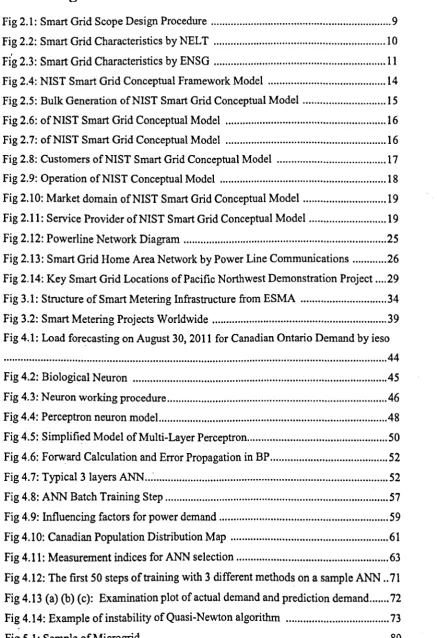
Different Smart Grid scopes or landscapes are published by various organizations. E.g. [17] introduces scope from Department of Energy (DOE) in US while [18] introduces a scheme for UK Smart Grid development. In the scope reports it is easy to find out description of multiple types of technologies and standards. But it is difficult to find out a systematic reflection from technologies to the national development aims. For other nations or organizations that prefer to form up a scope oftheir own, it is better to organize all the researches together into a procedure revealing the way to sketch the scope other than just show up what the scope is. This section selects Smart Grid scope from DOE as example to introduce a scope procedure.
Fig 2.1 reveals the procedures. One nation should use their national development object to guide its Smart Grid scope. From the national developments, summarize characteristics on what power system should look like. Then based on these characteristics, finding out what technologies and standards could satisfy them. Finally the scope is formed. National developments relate to power system are list below:
• Aim
1:
less carbon emit and pollution to protect global environment.• Aim 2: Spend less for every energy unit generation.
• Aim 3: Increase energy consumption security and reliability.
SMART GRID FRAMEWORK ANALYSIS AND ART/HCIAI NEURAL NETWORK IN LOAD FORECAST
Characteristic 1
Characteristic 2
Object
Characteristic n
(T=~~
(Tech
standard' And MetrIc 2J
[image:25.541.51.497.69.384.2]Tech
Standardj
And Metric mFig 2.1: Smart Grid Scope Design Procedure [14]
2.4.1 Smart Grid Characteristics
Scope
To better understand the objects and classification for new technologies and services in Smart Grid, a classification of characteristics of Smart Grid is a fundamental support. One should summarize out their own Smart Grid Characteristics basing on their development object and the current situation. These characteristics are further description of smart grid definition and they provide guidance for the smart grid new technologies.
~~ ... --~ .... ~-, -
--,---
.. -.~-.---_
... --~. ~.-. -~,-.-...-....-
.-.-'-""-'''' ~ .. -. '~--.--., r - -.... ' Enables Informed Participation by Customers~-+ Accoomodates All Generation and Storage Options .. '-"-""'-- ---,,~ .. '."--.
.-. - -.-..-..-..-. Enables New Products.-. Services.-. and Markets Smart Grid -' , - - - I
1---+ Provides the Power Quality for the Range of Needs
- . '~--"-'''""'-='''~'-,-.. -.~-.... -~ .. -.--~.""",>-...,--~. ~"""" ... ~ .. ~ ---~'>-'-.. --.,,~'~ - . - - . - . i Operates Resiliently to Disturbances. Attacks. and
L...-_+
I Natural Disasters
Fig 2.2: Smart Grid Characteristics by NELT [14]
From Fig.2.2, each characteristic are based on their national development aims:
• Enable Informed Participation by Customers (C 1): This characteristic
introduces bi-directional information flow and energy flow between utilities and
consumer. This two-way flow not only saves cost of utilities through appliances
like Metering Automation, but also suggests a greener consumption style to
customers by dynamic pricing. Therefore, this characteristic reflects incentive from
Aim 1 and Aim 2.
• Accommodate All Generation and Storage Options (C2): This characteristic
introduces new types of generations, like renewable bulk generation and
distributed generation, which may reduce carbon emit and the traditional
, generation cost. Moreover, requirement of new types of generations may create
new market and provide new motivation for economic development. So this
characteristic reflects incentive from Aim 1, Aim 2 and Aim 4.
• Enable New Products, Service and Markets (C3): This characteristic covers new
consumption like EV, new service like dynamic pricing. All these new products
and service brings new markets and change traditional market feature. It does not
only promote greener consumption but also produce new incentives for economic
grow. So this characteristic reflects incentive from Aim 1, Aim 4.
• Provide Power Quality for Range of Needs (C4): This characteristic covers
solutions to Power Quality disturbance which may increase the cost from reliability.
SMART GRlD FRAMEWORK ANALYSIS AND ARTIHCIAL NEURAL NETWORK IN WAD FORECAST
• Optimize Asset Utilization and Operation Efficiency (C5): This characteristic stands for the efficiency increasing and asset optimal utilization by the real-time information communication in all section of power system. It directly leads to lower cost and higher reliability. So this characteristic reflects incentive from Aim
2 and Aim 3.
• Operates Resiliently to Disturbances, Attacks, and Natural Disasters (C6): This characteristic covers the Smart Grid solutions that reduce the harms from disturbances, attacks and natural disasters. In other words, enhance the security and reliability so as to save cost from the harms. This characteristic reflects incentive from Aim 2 and Aim 3.
Though nations may have similar development, but their Smart Grid Scope should be
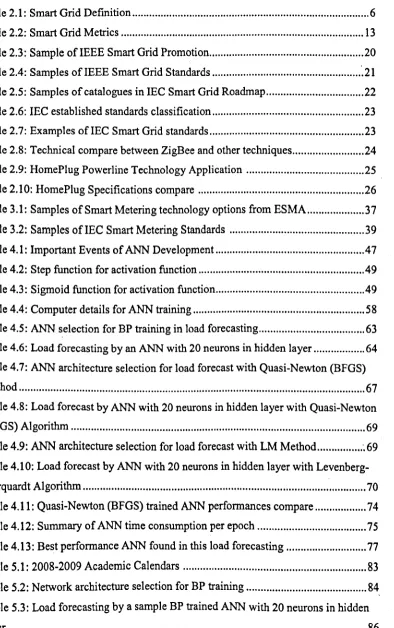
based on their own situations. Comparing to DOE's Smart Grid characteristics, Electric Network Strategy Group (ENSG) has summarized their own characteristics
for UK Smart Grid development in Fig 2.3.
Smart Grid
Facilitate connection and operation of generators of all sizes and technologies
Enable the demand side to playa part in optimising the operation of the system
."
._-Extend system balancing into distribution and the home
Provide consumers with greater information and choice of supply
Significantly reduce the environmental impact of the total electricity supply system
[image:27.540.57.458.367.634.2]Deliver required levels of reliability, flexibility, quality and. se.curity of supply
Fig 2.3: Smart Grid Characteristics by ENSG [18]
The six characteristics in Fig 2.3 reflect the 4 national development aims as well.
While the characteristics from DOE mentioned the reliability and security in 3 items, the one from UK_only mentioned this in one item. This is because US suffer much
in the largest blackout worldwide which affecting more than 30 millions people, there are 2 from US but non from UK. In these blackouts which affect at least 1 million person*hour in the passed 5 years, US suffered more than 25 but UK only takes 10. The different situation suffered by US and UK influence their characteristics making of Smart Grid.
2.4.2 Smart Grid Technologies Metrics
With the characteristics, the next step in procedure is to find out technologies and standards that satisfy all the characteristics. So technologies in Smart Grid should reflect the Smart Grid characteristics.
Set US as example. U.S. Department of Energy (DOE) established a wqrkshop for identifying metrics of measuring progress toward implementation of smart-grid technologies, practices, and services with 140 experts on June 20, 2008. At last over 50 metrics was hand in for smart-grid progress, in which 20 are for smart grid deployment [15]. Table 2.2 shows these 20 metrics.
Metric Title Characteristic
Reflection
Area, Regional, and National Coordination Regime
1 Dynamic Pricing C 1, C3
2 Real-time System Operations Data Sharing C 5, C 6 3 Distributed-Resource Interconnection Policy C2,C5
4 Policy/Regulatory Progress C 1 to C 6
Distributed-Energy-Resource Techno logy 5 Load Participation. Based on Grid Conditions: C 1,
6 Load Served by Microgrid C 1, C 5
7 Grid-Connected Distributed Generation C2 (renewable and non-renewable) and Storage
8 EVs and PHEVs C3
9
Grid-Responsive Non-Generating Demand- C5Side Equipment
SMART GRID FRAMEWORK ANALYSIS AND ARTIFICIAL NEURAL NETWORK IN LOAD FORECAST
10 T &D System Reliability C4, C 5, C6
11 T &D Automation C4,C 5, C6
12 Advanced Meters C 1, C 5
13 Advanced System Measurement C5,C6
14 Capacity Factors C5
15 Generation and T &D Efficiencies C5
16 Dynamic Line Ratings C4,C5
17 Power Quality C4
Infonnation Networks and Finance
18 Cyber Security C6
19 Open Architecture/Standards C 1 to C 6
[image:29.541.47.468.72.331.2]20 Venture Capital C 1 to C 6
Table 2.2: Smart Grid Metrlcs
Each metric is corresponding to one or more characteristics in Table 2.2. Column 'Characteristics Reflection' introduce the characteristics relate to the metrics ..
2.5 Smart Grid Scope
With the analysis on characteristics and metrics, following the scope design procedure,
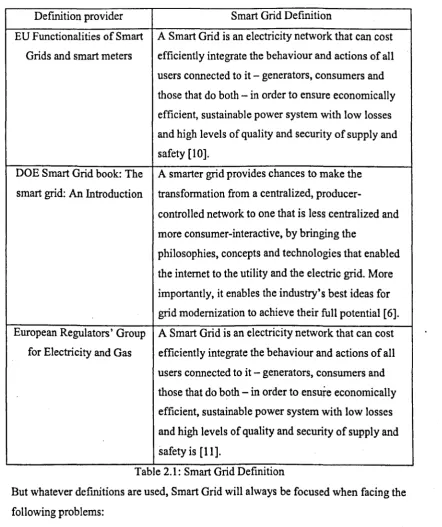
the Smart Grid Scope could be revealed. Various new technologies and standards satisfying the characteristics make the Smart Grid advanced and obviously different from traditional power grid. The following section introduces one scope sample from NIST of DOE, revealing the new component of Smart Grid.
O\s1ribution
Fig 2.4: NIST Smart Grid Conceptual Framework Model [17]
"The National Institute of Standards and Technology (NIST) Smart Grid Conceptual
Model provides a high-level framework for the smart grid that defines seven
important domains: Bulk Generation, Transmission, Distribution, Customers,
Operations, Markets and Service Providers [16]. All the 7 domains construct a sub-system of their own, though not completely separated. A communication and
monitoring network are established covering all the above domains, aiming to provide a bi-directional information flow between related domains.
2.5.1
Bulk Generation
Smart Grid accommo ates all generations and storage options. As centralized generations still plays a critical role, this domain mainly integrates all kinds of centralized power generation, storage types and specified monitoring and management for each generation and the whole generation systems. Traditional generations, e.g. Coal and large hydro, are definitely included. Renewable energy, including intermittent renewable energy, like solar and wind, and un-intermittent renewable energy, like wave energy and biomass, are also covered in this domain for they are the optimal choice in taking place of high polluted and carbon-emitted generations.
Comparing to tradition power system, the advanced areas are placed at: • New types of generation seize larger percentage to traditional generation. • New generations, Storage and their associate device create new market chances.
[image:30.541.16.530.25.730.2]SMART GRlD FRAMEWORK ANALYSIS AND ARTIFICIAL NEURAL NETWORK IN LOAD FORECAST
Fig 2.5 reveals the Bulk Generation structure:
J 1
1 ,
,
,
Renewable,
NDn-Variable.
J I
I ;J
Non-Renewable, Non-Variable
,
"Fig 2.5: Bulk Generation ofNIST Smart Grid Conceptual Model [17]
2.5.2
Transmission
To transport the energy from Bulk Generation to load centre, power transmission grid
is still the necessary consideration of Smart Grid. In traditional case, large
transmission grid swallows more than 10% energy of generation. Smart Grid aims to
apply new technologi s and management, e.g. HYDC, FACTS, Transmission
Dispatch Automation, Communication Network, to reduce the consumption and
enhance the efficiency and stability in this domain.
Comparing to tradition power system, the advanced areas are placed at:
• New types power delivery technologies reduce the line lost.
• Wide Area Communication platform encourage data transmission and sections
communication that helps in better power dispatch and problems diagnosis.
• Substation Automation improves the operational efficiency and asset utilization.
Fig 2.6: ofNlST Smart Grid Conceptual Model [17]
2.5.3 Distribution
Smart Grid Distribution not only achieves the ability in traditional power grid but also
integrate several new technologies including:
• Distributed Generation: Another generation type other than Bulk Generation.
• Real time monitoring, data analysis and management.
• Optimization and automation on power dispatch and grid protection.
• Various Power Quality selections.
Fig 2.7 reveals the Distribution domain ofNIST Smart Grid Conceptual Model.
SMART G/uD FRAMEWORK ANALYSIS AND AR71FI IAL NEURAL NETWORK IN WAD FORECAST
2.5.4
Customer
The Customer domain represents a new structure of load status in Smart Grid other
than traditional power grid. The end-user of electricity, including
home/industry/commercial building, connects to power distribution grid with the
following new functional systems:
• Smart Metering (Advanced Metering Infrastructure) that promote demand response.
• Demand Side Management through bi-directional information flow and power
flow.
• Micro-grid that promotes DG and grid resilient.
• Communication Network for home area network promotes new consumption
style and creates new service & markets.
Fig 2.8 reveals the Customers domain ofNIST Smart Grid Conceptual Model
Home Galeway
{£SIJ
I
O\'tnlllt&dCo·Gtneration _. tid
UgllIlng
Fig 2.8: Customers ofNIST Smart Grid Conceptual Model [17]
2.5
.5 Operations
The Operations domain is constructed by most of controls, analysis and management
of all other domains based on the bi-directional communication network in the Smart
Grid. This domain deals not only the monitoring and management problem but also
provide intelligent upport for decision making.
• New types of equipment and services, like renewable generation, distributed
generation, HVDC and dynamic pricing, require specified operations.
• Communication platform establishment has brought larger information sharing,
so as have change the operation towards traditional sections in power system.
Fig 2.9 reveals Operation domains ofNIST Conceptual Model.
Fauh _ '
-Analysis tanral
I I
I I I
l.cIad Conttol ~19 & AnalySI'
StallAlics
Transmission
()omnlLWcatktll Secutlly
t.t Ilf R ding HllIwor1l Man tillent &Con1rol ~
Fig 2.9: Operation ofNIST Conceptual Model [19]
2.5.6
Markets
As described in [20], he Markets domain operates and coordinates all the participants
in electricity markets within the Smart Grid. This domain covers all type of market
behaviours, such as wholesaling, retailing, energy services trading and market
management. It also relates to other relevant market to Smart Grid, like Electric
Vehicles. What's more, it deals with most relevant information to Smart Grid [20].
The description to this domain also includes "the Markets domain interfaces with all
other domains and make sure they are coordinated in a competitive market
environment". This will be the ability of a power grid with permitting competition.
Some monopolized or market-unopened power grid should establish their own rules
to maintain a health market operations other than this Conceptual Model introduced.
Comparing traditional power market, new types of consumption like EV and DG
require new market behaviours to maximize their contribution to Smart Grid. Fig 2.10
[image:34.543.19.527.19.520.2]SMART GRID FIUMEWORK ANALYSIS AND AR71FIClAI, NEURAL NEDVORK IN LOAD FORECA T
I
I
I
Wholesaling
Rctalling
Ancilary Cps
Bulk Gtntmlion
Fig 2.10: Market domain ofNIST Smart Grid Conceptual Model [20]
2
.5
.7 Service
Provider
The Service Provider domain of the Smart Grid handles all third-party operations
among the domains. This section covers all requirements for establishment and
maintenance for other sections. Fig 2.11 reveals the structure of Service Provider of
NIST Smart Grid Conceptual Model [21].
2.6 Smart Grid Related Organization and Standards
As Smart Grid is promoted, organizations and companies worldwide gradually place their attention into this area, including sever:;tl technical organizations and industrial alliances.
International academic and industrial organizations, usually profit and non-governmental, are merged by experts and engineers from one or more areas. Through communication, analysis, cooperation and coordination, these organizations formulate compatible area standards; manage conformity assessment system; promote
conferences and other activities and provide several authority publications. Facing smart grid, numerous international organizations assign resources to this new coming deployment with enormous investment and complicated technologies.
Smart Grid development is driven by various requirements from market and technology fields. For a few requirements, more than one solution could be
discovered. To avoid the standards chaos from casual selection, companies and other relevant organizations start to unite together for supporting one possible optimal choice, promoting the nativity of alliance. The standards and policies supported by a large alliance are usually standing for widely accepted and influencing.
2.6.1 Institute of Electrical and Electronics Engineers (IEEE) and Its
Smart Grid
Through the Smart Grid Working Group and other relevant societies, IEEE promotes activities on Smart Grid research, education, popularization and communications in various types, including a specific Smart Grid Website, Smart Grid journal and Smart Grid conferences. Table 2.3 provides a sample of the mentioned activities.
IEEE Smart Grid Promotion
Smart Grid Website . http://smartgrid.ieee.org/
Smart Grid Journal IEEE Transactions on Smart Grid [24]
Smart Grid IEEE International Conference on Smart Grid Conference Communications
Table 2.3: Sample of IEEE Smart Gnd PromotIOn
SMART GRID FRAMEWORK ANALYSIS AND ARTIFICIAL NEURAL NETWORK IN LOAD FORECAST
smart grid, including the over 20 IEEE standards named in NIST Framework and Roadmap for Smart Grid Interoperability Standards, Release 1.0. Facing the interoperability brought by Smart Grid, IEEE raise a standards series, 2030 Smart Grid Interoperability Series of Standards, as compensation for interoperability support. The approving standards from 2030 share the common goal of interoperability
supported by interrelated and complementary technologies [26] Samples of IEEE Smart Grid Standards are list in Table 2.4 [25].
Series Working Title Status
No. Group Approving
1547.3- SCC21 Guide For Monitoring, Information Exchange, and Approved 2007 Control of Distributed Resources Interconnected
With Electric Power Systems.
802.11- IEEE 802 IEEE Standard for Infonnation Technology - Approved 2007 Telecommunications and Information Exchange
Between Systems - Local and Metropolitan Area Networks - Specific Requirements ~ Part II: Wireless LAN Medium Access Control (MAC) and Physical Layer (PHy) Specifications
P2030 SCC21 Guide for Smart Grid lnteroperability of Energy Approving Technology and Information Technology Operation
with the Electric Power System (EPS), and End-Use Applications and Loads
P802.11 IEEE 802 IEEE Standard for Information Technology - Approving Telecommunications and Information Exchange
Between Systems - Local and Metropolitan Area Networks - Specific Requirements - Part II: Wireless LAN Medium Access Control (MAC) and Physical Layer (PHY) Specifications
Table 2.4: Samples of IEEE Smart Gnd Standards
2.6.2 International Electrotechnical Commission (IE C) and Its Smart Grid
into several clauses for specific areas. For each clause, the document describes systematically in the following structure:
~ Area Description. ~ Requirements. ~ Existing Standards.
~ Gaps between the existing standards and the requirements. ~ Recommendations.
Basing on the describing structure mentioned above, IEC specifies a catalogue with about 20 items including 3 general items highly related to others. Table 2.5 selects some of the catalogues in IEC Smart Grid Roadmap [28].
Title Content
1 Smart transmission Including description of FACTS, HVDC, Cable systems, Transmission Transmission and Long-distance transmission. Level Application
2 Distributed Energy Including description of Energy Management
Resources System (EMS), forecasting system.
3 Advanced Metering for Including Advanced Meter Infrastructure and Billing and Network the bidirectional communication network Management between the smart grid and metering devices
and business systems.
Table 2.5: Samples of catalogues In IEC Smart Gnd Roadmap
Based on the Smart Grid Roadmap, IEC has established more than 100 standards relevant to Smart Grid. By classification, they can be put into 13 categories as Table 2.6 reveals [29]. Unlike IEEE Smart Grid standardization, IEC does not satisfy with only a standard compensation. The standards in roadmap form up a well organized standard framework that specified for Smart Grid.
Communication Distribution Distributed Energy Automation (DA) Resources (DER)
Distributed Demand Response Energy Management
Management (DR) System (tech.) (EMS)
System (OMS)
SMARTGRJD FIUMEWORK ANALYSIS AND ARTIFICIAL NEUIUL NETWORK IN LOAD FORECAST
System (FACTS)
Substation Storage Smart home
Automation (SA)
Table 2.6: IEC estabhshed standards classIficatIon
Under these categories, examples oflEC Smart Grid standards are list in Table 2.7.
Reference Topic Title
IEC 61970-2 Common Energy management system application program Information interface (EMS-API) - Part 2: Glossary.
~
Model
ISO/IEC Information Information technology - Home electronic system 14543-3-3 Technology - (HES) architecture - Part 3-3: User process for
HES network based control of HES Class 1. lEC 60633 HYDC - High Terminology for high-voltage direct current
Voltage (HVDC) transmission. Direct Current
IEC 61400- Wind Wind turbines - Part 24: Lightning protection.
24 Turbines
Table 2.7: Examples oflEC Smart Gnd standards
2.6.3 ZigBee Alliance and Its ZigBee Communication Tech for Smart
Grid
ZigBee is a standard-based wireless technology for the requirement of cost, low-power wireless sensor and control networks, which is interested by Smart Grid communication platform establishment. The communication platform from Smart Grid requires a communication technology that covers large network size, long battery life but do not necessary a too high data rate. ZigBee will be one of the best choice compare to Bluetooth and Wi-Fi as shown in Table 2.8.
Basing on IEEE 802.15.4 for Wireless Personal Area Networks (WPAN), ZigBee establishes an easy-used mesh network which mainly works around 2.4 GHz radio frequencies. The possible application areas are listed below [30]:
»
Commercial building management.»
Energy management.>
Health care and fitness.>
Residential management.>
Retail management.ZigBee delivers unprocessed metadata at the rate of 250Kbs at 2.4 GHz (16 channels) for global utilizations, 40Kbs at 915 MHz (10 channels) for Americas and 20Kbs at 868 MHz (10 Channel) for Europe. Its low-power solution ranging from 10 to 1600 meters are used for transmission with dependence on the environmental conditions and the power output. A low-power feature could be seen in Table 2.8, a technical compare between ZigBee and other wireless communication techniques [31].
Market Name ZigBee GSMlGPRS Wi-Fi TM Bluetooth
Standard 802.15.4 CDMA/l*RTT 802. lIb TM
802.15.1
Application Monitoring Wide Area Web, Cable
Focus & Control Voice & Data Email, Replacement Video
System 4KB-32KB 16MB+ IMB+ 250KB+
Resource
Battery Life 100-1000+ 1-7 0.5-5 1-7
(days)
Network Size Approximate 1 32 7
to Unlimited (64K)
Maximum 20 - 250 64-128+ 11,000+ 720
Data Rate
Transmission 1-100+ 1000+ 1-100 1-10+
Range (meters)
Success Reliability, Reach, Quality Speed, Cost,
Metrics Power, Cost Flexibility Convenience
Table 2.8: TechnIcal compare between ZlgBee and other technIques
2.6.4 HomePlug Powerline Alliance and Its HomePlug Powerline Tech
for Smart Grid
SMART GRlD FRAMEWORK ANALYSIS AND ARTIFICIAL NEURAl, NETWORK IN LOAD FORl'XAST
been attempted for several decades and is achieved with a complex amalgam of signal
processing technologies and new modulation techniques.
Network using povvertines in your- home
----~----
~
Up to
;no
Mbps!(milfion-bits-per-second)
Broadband Internet modem I router
P
C
1m age:; coune:;y of dE" 010 AG (w\w/.dP.'l.'olacJe)
Fig 2.12: Powerline Network Diagram [34]
The popularization of technology also comes from the ubiquitous power outlets. The
maturing area power wiring system provides a ready-made platform for powerline
communication which leads to convenient installation. HomePlug powerline networks
can also be used to extend wireless coverage by plugging access points into the
powerline network at optimum points. A large number of applications by this
technology are reveals in Table 2.9 [33].
Areas
1 Whole-home broadband internet
2 HDTV Networking
3 Gaming
4 Smart Grid / Smart Energy
5 Whole-Home Audio
Table 2.9: HomePlug Powerline Technology Application [33]
After founded in 2000, the HomePlug Powerline Alliance keeps providing
specification for Powerline networking standardization. Table 2.10 has shown a
Title Time Peak Speed Description Published
HomePlug 2001 14 Mbitls In 2008 Telecommunication
1.0 Industry Association (TIA)
announced the new TIA-II13 International Standard has deeply considered the HomePlug 1.0 Technology
HomePlug 2005 200 Mhitls (PHY) Provides solution for high quality
AV video distribution with secure
80 Mbitls (MAC) connectivity and build-in Quality-of-Service. It is fully interoperable with other HomePlug
specifications and IEEE 1901 except HomePlug 1.0.
HomePlug Scheduled Gigabit level HomePlug A V2 is designed to AV2 2011 (pHY) reliably deliver multiple streams of
HD video throughout the home as +600 Mbitls well as next generation low
(MAC) latency content such as 3D and 4K HD video.
HomePlug 2010 3.8 Mbitls (PHY) Developed as Smart Grid
Green PHY Communications protocol for
[image:42.543.47.451.75.432.2]1 Mbitls (MAC) connecting home appliances like HVAC and Smart Meters. Table 2.10: HomePlug SpecificatIOns compare [33] [35] Other than a splendid communication solution for entertainment distribution, HomePlug Powerline network will also allow Home Area Network (HAN) to communicate with smart meters and provide energy management for consumers. By working with ZigBee Alliance, HomePlug Powerline Alliance is helping to set up HAN ecosystem that enables intelligent energy management and efficiency in local area [36].
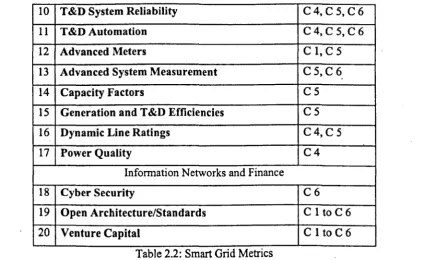
SMART GRID FRAMEWORK ANALYSIS AND ARTIFICIAL NEURAL NETWORK IN LOAD FORECAST
Smart Grid considers Home Plug Power Line as one of its communication
technologies candidates as it utilize the existing network instead of invest to build a new one. This feature will reduce the initial investment but the network access is limited to the existing network sockets, which has less flexibility than the choice of wireless network.
2.7 Smart Grid Benefit
Power grid smartening and modernization, like any investment, does not come for free. But the benefits go far beyond the costs. Almost all the new technologies are born for new requirements with compatibility of new developments. So Smart Grid development covers the following benefits [37]:
• Improvements in Reliability.
~ Major Reduction in Outage Duration and Frequency. ~ Far Fewer Power Quality Disturbances.
~ Virtual Elimination of Regional Blackouts • Improvements in Security and Safety.
~ Significantly Reduced Vulnerability to Terrorist Attack And Natural Disasters. ~ Improved Public and Worker Safety.
• Improved Economics.
~ Reduction or Mitigation of Prices. ~ New Options for Market Participants.
• Improved Efficiency.
~ More Efficient Operation and Improved Asset Management at Substantially Lower Costs.
• More environmentally friendly.
~ Much Wider Deployment of Environmentally Friendly Resources. ~ Electrical Losses Reduced.
If targeting on stakeholder angle, Smart Grid contributes its advantages as follow items reveals [38]:
Moreover, the enhanced reliability will help to reduce the risk and price by limit the risk of outage for specially needed people.
• Large Customers: Smart Grid provides more informatics and reliable power supply with multi Power Quality (PQ) Options.
• Local Governments: Including the consumer benefits, local governments could also gain advantages on the reduction of accidents or disaster. The more
informatics ability from Smart Grid will help to provide a faster and more accurate decision making and action enforced.
• Utility/Grid Operators: A more efficient communication platform and data analysis system could increase the automation and the operation efficiency of the utility, so as to reduce the cost.
• State and Local Economies: The Smart Grid affordability ensures the power supply for economic development. Moreover, Smart Grid exploits the traditional market and introduces new markets, providing business chances and jobs. In power utilization angle, Smart Grid integrates much more renewable energy, supporting a sustainable economic development.
2.8 Smart Grid Demonstration Projects
Though Smart Grid appears to contain significant advantages, in specific environment, how excellent each Smart Grid advantage will be become an urgent question to
answer before deployment. There is still requirement on proves and evidences for Smart Grid abilities. So demonstration projects or test-beds are applied for examining the Smart Grid abilities and working status.
2.8.1 Pacific Northwest Smart Grid Demonstration Project
The Pacific Northwest Smart Grid Demonstration Project is a regional project funded through a competitive process by the DOE under the American Recovery and
SMART GRlD FRAMEWORK ANAI.YSIS AND ARTIFICIAL NEURAL NEnVORK IN LOAD FORECAST
[image:45.548.14.527.23.815.2]validate new smart grid business models at a scale that can readily be adapted and replicated nationally [39].
Fig 2.14: Key Smart Grid Locations of Pacific Northwest Demonstration Project [39] The primary objectives of this $178M cost project are listed as follows [39]:
~ Develop and validate an interoperable distributed communication and control
infrastructure using incentive signals.
~ Measure and valiuate smart grid costs and benefits for end-users, utilities
regulators, and others thereby laying the foundations of business cases for future smart grid investments.
~ Contribute to the development of standards and control methodologies.
Apply smart grid capabilities to support the integration of renewable resources.
This five-year project formally started on February I, 20 I
o.
With its influence, up to 1,500 jobs created or retained at the peak of the project. New technology helps to update the aging electricity delivery system infrastructure and enhance reliability. The cost-benefit analysis will guide utility decisions on their future investments. Thedistributed energy source and the interoperability of the network will help to optimise
the system efficiency and reduce the greenhouse gas emission. Customers will have more information about their own energy consumption so that they can become more
This project is one of the largest Smart Grid projects focusing on demand side issues. It provides a comparatively framework test to:
~ General Distributed Generation, like wind and solar. ~ New appliances, like smart appliances and EV. ~ Reliability
~ Demand Side Management Issues, including metering, communications, data analysis and control.
This project is mainly related to customer side and distribution in power system. Test bed for Smart Grid appearance when deploying general DG, 'Smart Metering, new consumption like EV and bi-directional information flow are the main concern of this project. Though it is difficult to evaluate this project with details as it is still in process, it is still doubtable to deploy a large project before several small experimental test as the impact is huge once fail. Moreover, the reliability and
security of Smart Grid is inter-influencing among each sections of power system. It is
in doubt that if a major work in customer side could reflect the entire Smart Grid ability on solution to Power Quality and disasters. Also, local feature may promote special DG type. Focusing on general DG type may miss the optimal generation plan.
2.8.2 EPRI Smart Grid Demonstration Initiative
"The EPRI Smart Grid Demonstration Initiative is a multi-year international
collaborative initiative demonstrating the integration of Distributed Energy Resources (DER) in large scale demonstration projects. DERs integrated include demand
response, storage, distributed generation, and renewable generation to advance widespread, efficient, and cost-effective deployment of utility and customer-side technologies in the distribution system and to enhance overall power system operations [41].
This Demonstration ID.itiative contains several Host-Site Demonstration Projects, with new structures ofDER and several control & management methods. This Host-Site Demonstration Projects include: [41]
• American Electric Power (AEP) Smart Grid Demonstration Project.
• Consolidated Edison Smart Grid Demonstration Project.
• Duke Energy Smart Grid Demonstration Project
SMART GRlD FRAMEWORK ANALYSIS AND ARTIFICIAL NEURAL NETWORK IN LOAD FORECAST
• ESB Networks Smart Grid Demonstration Project
• Exelon Smart Grid Demonstration Project.
• The FirstEnergy Smart Grid Demonstration Project.
• KCP&L Smart Grid Demonstration Project
• PNM Resources Smart Grid Demonstration Project
• Southern California Edison (SCE) Smart Grid Demonstration Project
• Southern Company smart Grid Demonstration Project.
The EPRI Smart Grid Demonstration Initiative is a large Smart Grid project promoting plan:
~ Technologies Promotion: Projects from EPRI Smart Grid Demonstration Initiative cover most areas in DER, including DG, EV, DR, Pricing, and Communications and so on. They provide inspections on DER framework integration and each project focuses on one core task of Smart Grid.
~ Market Promotion: Most of projects are supported by one or more Smart Grid relevant utilities. The cooperation with industry not only relieves the pressure of government but also increases the industrial participation. Prepare of Smart Grid
deployment is on the way.
~ International Cooperation Promotion: Some of the projects do not locate in the
U.S. only. Like 'Electricite de France (EDF) Smart Grid Demonstration Project' is a French project by EDF.
All the projects in EPRI Demonstration Initiative have placed their target or a part of target into customer side. So Smart Grid development in consumers section is a general point of all the projects. E.g. all projects contain Demand Response
Technology. But due to the aim difference, different projects may contain distinct task. For example, project with EDF is targeting to optimize the integration of distributed generation, storage and energy efficiency measure for providing load relief and reduce carbon emission. So this project includes Distributed Generation as it is a main
2.9 Conclusion
Smart Grid is a framework of multi-types of technologies and various stakeholders. This chapter is written aiming to introduce a generally Smart Grid scope design procedure which reveals the way of organizing various research work into scope establishment. It also attached Smart Grid details information on Standardization and demonstration worldwide. The procedure is introduced as follows.
1) Summarize the aims of national development to form an object for Smart Grid. 2) Based on the object, find out the new contributions to these aims from new
power system, then the contribution forms up the characteristics. So each characteristic could reflect the aims.
3) With the characteristics, find out what technologies and standards could help to achieve these characteristics.
4) With the above three steps, a scope design finished.
Considering the necessity of compatibility among segments in Smart Grid, Section 2.6 introduces the current Smart Grid standardization situation worldwide. A variety of demonstration projects for Smart Grid are revealed as well in Section 2.8.
SMART GRID FRAMEWORK ANALYSIS AND ARTIFICIAL NEURAL NETWORK IN LOAD FORECAST
Chapter 3
Smart Metering Infrastructure
3.1 Smart Metering Introduction
As high speed development of technologies today, more and more problems occur in power utilizations, such as:
• High cost energy consumption.
• Lack of equitable collocation of multi-energy-resources. • Low fault detecting speed.
• Pollution and green house gas emit.
Facing these problems, smart grid, a topic recently attracted much attention, is one of the best choice to improve the situation. And Smart Metering, which is an important part of Smart Grid, is the closest way for energy user to be affected by the advantage of smart grid technology.
![Fig 2.1: Smart Grid Scope Design Procedure [14]](https://thumb-us.123doks.com/thumbv2/123dok_us/1602678.113127/25.541.51.497.69.384/fig-smart-grid-scope-design-procedure.webp)
![Fig 2.3: Smart Grid Characteristics by ENSG [18]](https://thumb-us.123doks.com/thumbv2/123dok_us/1602678.113127/27.540.57.458.367.634/fig-smart-grid-characteristics-ensg.webp)
![Fig 2.4: NIST Smart Grid Conceptual Framework Model [17]](https://thumb-us.123doks.com/thumbv2/123dok_us/1602678.113127/30.541.16.530.25.730/fig-nist-smart-grid-conceptual-framework-model.webp)

![Fig 2.13: Smart Grid Home Area Network by Power Line Communications [36]](https://thumb-us.123doks.com/thumbv2/123dok_us/1602678.113127/42.543.47.451.75.432/smart-grid-home-area-network-power-line-communications.webp)
![Fig 2.14: Key Smart Grid Locations of Pacific Northwest Demonstration Project [39]](https://thumb-us.123doks.com/thumbv2/123dok_us/1602678.113127/45.548.14.527.23.815/fig-smart-grid-locations-pacific-northwest-demonstration-project.webp)
