Wind Power Plant Behaviour in a Pay-as-bid
Curtailment Market
G.S. Hawker, L. Kane, K.R.W. Bell
Department of Electronic and Electrical Engineering,University of Strathclyde Glasgow, United Kingdom
Abstract— A pay-as-bid curtailment market, where Wind Power Plants (WPPs) may offer prices to have their output reduced in the event of network balancing or stability constraints, is one approach towards the market integration of a high proportion of wind energy onto a power system. Such a market aims to procure curtailment at a cost close to the marginal value of the electricity plus renewable subsidies and incentives, reducing risks for WPPs while minimising costs to the Independent System Operator (ISO). Through the use of game theory and market modelling, a key set of bidding strategies are identified that may evolve within such a market, which may act in opposition to the goals of the ISO. These are applied to a variety of network conditions in order to determine their likely impact and the resulting bidding signals provided to market participants. Bidding behaviours and market fluidity may also be affected by factors particular to wind power plants. Through analysis of both ex ante and ex post case studies, the existence of these behaviours is demonstrated, illustrating that a pay-as-bid curtailment market may not be efficient at price discovery in practice.
Keywords: Power generation dispatch; power system economics; wind energy; game theory.
I. INTRODUCTION
As the proportion of energy derived from wind generation increases in response to legislation on emissions targets, economic operation of power systems has to take into account the uncertainty related to wind power and the additional difficulties and costs required in balancing generation and demand. The inherent variability of wind power combined with locational inter-dependence means that there is a significant requirement for effective management of network congestion through wind power curtailment on systems with high wind energy penetration targets [1]. As wind power plants (WPPs) are not dispatchable in the same manner as conventional generators, with a stochastically variant power output, the Independent System Operator (ISO) may have a reduced ability to control WPP output in maintaining a system balance between load and generation [2].
Connection agreements for WPPs may be divided into two categories: firm connections, where the ability to export power up to a given limit is guaranteed and compensated for by the ISO where not available; and non-firm connections, where the ability to export power is not guaranteed and
subject to local network conditions. Normally, the availability of a firm connection right is dependent on necessary network reinforcement works being completed, both for the connection to the main interconnected system and any deeper reinforcements deemed to be required within it, whereas non-firm connections permit the connection of additional generation to the network prior to, or during, network reinforcement. In Britain, the requirements for network reinforcement in respect of transmission connections are primarily determined by the design rules within the ‘Security and Quality of Supply Standard’ (SQSS). Up to August 2010, connection before the network was fully compliant with the stipulations of the SQSS was possible in accordance with ‘customer choice’ rules but would grant only non-firm rights. In August 2010, under an arrangement known as ‘connect and manage’, firm rights would be granted even before the deeper reinforcements have been completed [3].
Where the forecast or actual output of WPPs exceeds demand or network capacity, actions may have to be taken by the Independent System Operator (ISO) to curtail the output of WPPs. A number of mechanisms for allocating curtailment volumes to WPPs have been used in different energy markets [4], and one class of mechanisms involves the use of market principles in order to induce efficient dispatch and the discovery of real costs. This also ensures that the merit order is not subject to discrimination by the ISO, in keeping with the competitive aims of a deregulated energy market.
II. BALANCING MARKET ANALYSIS
A. Market Description
One feature of a balancing market is that it permits the ISO to reduce the energy exported by each WPP in a fixed time period, equating to a market round, where the total generation of all WPPs exceeds the local network capacity. Each WPP may submit volumes (MWh) and prices (£/MWh), for each time period, that would be paid by the ISO to curtail output from that WPP. There is only one round of bids per time interval. Market closure is sufficiently near to the dispatch horizon that it may be assumed that each WPP has perfect knowledge of its uncurtailed power output. If the ISO purchases curtailment volumes from multiple WPPs, it pays the price of each (pay-as-bid) as opposed to a common pool or marginal price.
Curtailed energy can be treated as a homogenous good, and because each WPP has a fixed uncurtailed output for each market round, the competition is based on price rather than quantity. The participants within the market will be defined by the network topology and resultant transfer constraints, and so the list of WPPs in the market will vary on a significantly longer timescale than the market rounds. Thus, for the purposes of modelling strategies, the market has a constant set of players.
Suppose that there are independent WPPs with constant marginal costs, , based on the value of uncurtailed energy when sold to an off-taker. The capacity of WPP is , and the instantaneous uncurtailed power output of WPP is , considered to be constant for the duration of a market round. The ‘footroom’, or amount by which a WPP may reduce its output, is considered equal to , i.e. it may curtail output to zero.
Curtailment demand by the ISO, , is a random variable independent of price and bid quantity according to a probability distribution , reflecting a continuous range of network scenarios. It is assumed that curtailment demand can always be met by the WPPs participating within the market, [ ] where ∑ . Following the
submission of bids, WPPs are ranked in bid price order
with WPP as the marginal WPP:
∑
∑ .
B. Player Behaviours
The strategy space is the set of strategies available to WPP , and a strategy combination is a set of strategies, one for each WPP. denotes the strategy in of WPP , with the subset of which includes the
strategies of all WPPs excluding . The utility to WPP of playing strategy is given by . An equilibrium set of strategies is given by , and an equilibrium in pure Nash strategies is a strategy combination such that , and
. In other words, the market will reach an equilibrium wherever no increase in a WPP’s utility will result from a change in its strategy.
As the WPPs can only set their bid prices and not their uncurtailed power, if is a pure strategy it must be a bid price, or a probabilistically determined bid price if a mixed strategy. Precommitment of quantity in a price-based Bertrand competition may bring about an oligopoly outcome similar to that of a Cournot competition where pricing
exceeds marginal costs for a homogenous good [7]. The utility of each WPP is given by
{
∑
For a set of pure strategies that result in the same rank position for a WPP, the dominating strategy will be the one that maximizes . Similarly the set of pure strategies which result in any rank position are dominated by the strategy with the maximum value of , and the dominant strategy is for . The set of pure strategies which result in any rank position may be dominated by either the strategy which maximizes for or
dependent on the values of and ∑ . Any strategy resulting in rank position is completely dominated.
In assessing the competitive nature of WPPs in the market, the interaction between two WPPs will be characterized and generalized to the WPP market. It is assumed for any WPP pair in a market round that
and , i.e. that each generator has a unique output in each market round and unique marginal cost. In such a case, only one WPP will define the pure-strategy equilibrium bid price for all WPPs, as any WPP which is going to be curtailed which may incrementally increase its bid without reducing the probability of being curtailed will do so. Conversely, if a WPP increases its bid beyond that of another WPP such that it reduces the probability of dispatch (i.e. by submitting a price above the marginal cost of the marginal WPP) then it may increase its profit by slightly undercutting the marginal WPP.
Under a curtailment scenario, a WPP may reasonably determine that in a given market round the other market players will have a similar proportionate output to their own, , and the market is hence modelled with each WPP having perfect knowledge of all . This assumption is discussed further in section C. There exist 3 curtailment demand scenarios, and each is analysed in turn.
a) :
Only one of the WPPs will be curtailed, as each has sufficient footroom to meet the ISO’s total curtailment requirement in the trading period. Each WPP will increase its payoff by undercutting the other until the greater marginal cost is reached, and the equilibrium bid for both WPPs will be ( ) . In the WPP market, the WPP with the lowest marginal cost will be dispatched at a bid value with the second lowest WPP marginal cost as an upper limit.
b) ( ) :
market, however, any WPP may increase its bid to that of the marginal cost of without altering its rank position, whereas incrementally exceeding the marginal cost of will allow to undercut resulting in a greater dispatched capacity for a given bid value. Hence the dominant pure strategy is the maximum bid giving rank
, and the equilibrium bid is where the WPPs are ranked in marginal cost order.
c) :
Both WPPs will be curtailed, and may hence increase their payoffs by increasing their bid irrespective of the other bid value. Both WPPs have an effective monopoly as the ISO must purchase curtailment volumes from them both. In the WPP market, if the demand for curtailment is not high enough that all WPPs are guaranteed to be dispatched i.e.
∑ , then the same equilibrium results
as for scenario 2), with the dominant pure strategy being the maximum bid giving rank , and the equilibrium bid is
where the WPPs are ranked in marginal cost order.
C. Market Knowledge and Power
The previous analysis demonstrates that even with complete knowledge, real price discovery is not achieved by the ISO, and costs of curtailment are highly sensitive to the difference in marginal costs between WPPs. However, due to the stochastic nature of both demand and wind power profiles, as well as the geographic variance in wind speed between WPP locations, it may be difficult for a player to identify the likely marginal player in a constraint scenario and bid accordingly. This may result in a subset of players electing to artificially raise their price, in order to capitalize on infrequent high curtailment events where they can be sure of dispatch, as opposed to risking near marginal pricing which will reduce their gains in high curtailment scenarios while not guaranteeing dispatch in low curtailment scenarios.
Network topologies may also mean that the number of participants in a given constraint scenario may be very low, and this increases the opportunities for collusion between operators, particularly where multiple WPPs are owned by single generation companies, or are selling energy to a single off-taker.
D. Extraneous Costs
The above analysis assumes that the only contributing cost towards the price set by the WPP is the unit value of the energy. However, there may be additional costs to the WPP of curtailing energy, which may disincentivise the WPP from participating in the market at or near marginal cost. The WPP will have a contractual agreement with an energy off-taker which may guarantee the provision of per-unit subsidies, such as Renewable Obligation Certificates in the UK, or Production Tax Credits in the US. The WPP may also be contracted into a profit-sharing arrangement with maintenance parties or landowners based around the value of generated energy, and so may be restricted from voluntarily reducing output. Participation in the market may also require significant technical overheads, such as automated dispatch of instructions, or 24 hour monitoring and response capability, which generates a cost which must be recouped through curtailment payments. While it may be possible for any WPP to create a single marginal cost which adequately compensates for these factors, there will be a
sensitivity to scale for operational costs, as well as interdependency on the market to determine the volume of curtailment payments across which extraneous costs should be spread. Determining this marginal cost introduces uncertainty to the WPP against which they may hedge by further increasing the bid price.
III. EX ANTE CASE STUDY:FUTURE OPERATION OF THE SHETLAND ISLANDS NETWORK
The Northern Isles New Energy Solutions (NINES) project being developed on the Shetland Islands distribution network aims to introduce Active Network Management (ANM) concepts to an islanded network with a wealth of potential renewable energy resources [8],[9]. There is currently one wind farm with a firm connection for 3.7MW. The NINES project aims to increase the total capacity of WPP connected to the distribution network, and, at time of writing, there are connection applications for approximately another 14.5MW of WPPs.
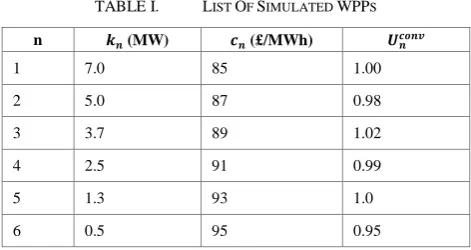
[image:3.595.309.545.348.473.2]Table 1 shows an illustrative future scenario for a total of 20MW of WPP with firm connection agreements. It is assumed that, due to economy of scale, the greater the capacity of the WPP, the lower the energy price negotiated with the off-taker, and hence the lower the marginal price for curtailment of energy.
TABLE I. LIST OF SIMULATED WPPS
n (MW) (£/MWh)
1 7.0 85 1.00
2 5.0 87 0.98
3 3.7 89 1.02
4 2.5 91 0.99
5 1.3 93 1.0
6 0.5 95 0.95
The wind resource model involves the use of an exponentially decaying autocorrelation function based on a Markov random walk [10]:
[ ] [ ]
where is the initial probability distribution function (pdf), is the probability vector equivalent to the limiting pdf, [ ] is the initial probability distribution function matrix, and [ ] is the decay matrix.
The limiting probability distribution function is set as a Rayleigh distribution (a Weibull distribution with shape parameter equal to 2) with the average value set as the mean wind speed for the wind resource location, .
This wind resource is then linearly scaled to each wind WPP according to their own scaling parameter, assuming that the geographical separation between WPPs is not significant enough to create a time lag between sites on an hourly timescale:
This wind speed is converted to the power output of the site by conversion through a generic wind farm power curve and scaling to .
The power demand model consists of 8 diurnal distributions, covering 4 seasons split between weekends and weekdays derived from historical demand data, and a random noise parameter calculated from residuals.
The maximum total amount of wind generation which can be exported by WPPs onto the network is constrained by a linear system stability limit particular to Shetland. This is defined as a fixed proportion of demand, , which must be supplied by conventional generation, and so any available wind power in excess of the difference between total demand and the output of conventional generation must be curtailed:
∑
For the purpose of this discussion and as an illustration of a possible future arrangement for managing generation on Shetland, it is supposed that there is a curtailment market that is conducted on a hourly schedule, with each WPP aware of all values of and prior to submitting closed bids in each market round. After each round, the bids are shared as common knowledge in order for each WPP to amend its strategy.
Agent-based modelling is used to amend the bidding behaviour of the WPPs between each round. Each WPP attempts to determine the optimum bid for each of the 3 cases described in Section II of this paper, using the following algorithm, which describes the iterative evolution of prices for each WPP :
1. Initialisation: set the initial bid triplet to the
marginal cost: [ ]
2. Before each market round, determine the constraint scenario, and bid the appropriate value.
3. After each market round, given the bids of the other WPPs, determine the bid value to the nearest £0.01 in the range [ ]that would have resulted in the greatest return, and replace the corresponding bid triplet entry, to be used in the subsequent round, with this value if the return would be greater than for the existing bid.
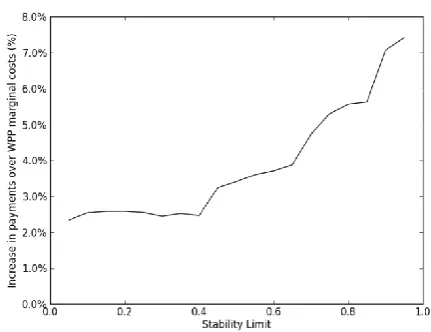
[image:4.595.326.542.63.229.2]The simulation is run for a year for a range of stability limits, and the increased cost to the ISO compared to paying WPP marginal costs is shown in fig. 1. As the stability limit increases, the proportion of time where curtailment demand is high enough to for additional WPPs to sell a curtailment service (scenarios 2 and 3) increases, and so WPPs with a positive probability of being curtailed may increase their bid to a higher equilibrium price, defined as the marginal cost of a higher-priced WPP. An increase in from 0.2 to 0.3 does result in a small decrease in cost to the ISO, however, as this increases the number of WPPs able to compete in the scenario where there is competition by capacity as well as price.
Figure 1. Total curtailment payments made by the ISO over marginal cost for different linear stability limits based on 20MW of rated wind capacity on Shetland.
The overall magnitude of the increased cost to the ISO is defined by the difference in magnitudes between the marginal costs of the various WPPs, weighted towards the differences between the consecutive WPPs with lowest marginal costs. This means that while the illustrated maximum cost increase is 7.5%, this is purely a reflection of the relative difference between the generators with the lowest and highest marginal cost, and the increased pricing level is highly sensitive to the relative pricing of generators, with the potential for far higher cost increases.
IV. EX POST CASE STUDY:WPPBEHAVIOUR IN THE GB BALANCING MECHANISM
In the electricity network of Great Britain (GB), National Grid plc (the ISO) operates a market termed the Balancing Mechanism (BM), into which generators and consumers may supply bids (reductions in generation / increases in demand) and offers (increases in generation / reductions in demand) for volumes of energy above and below the planned level of output or consumption [11]. If the ISO needs to increase or reduce generation or consumption as a final balancing measure, either due to a local transmission constraint or the need to maintain a system-wide balance of generation and demand, it will select volumes of energy from the set of applicable generators or consumers on a price merit order. Only generators connected under a Bilateral Embedded Generation Agreement (BEGA) or as a directly-connected Balancing Mechanism Unit (BMU) participate in the BM, which excludes the majority of distribution-connected WPPs.
energy transfer would exceed the B6 capacity, requiring constraints to be enacted. Under the 2020 ‘Gone Green’ scenario with a greatly increased level of wind generation, this would increase to around 40% in the absence of reinforcement [13]. While the B6 transfer capacity will be increased to 4.4GW by 2015 [14], and subsequently to around 8GW in 2020, constraint management is likely to be a present and continuing requirement of the management of this boundary.
At 11am on 3rd of February 2013, the ISO reported an all-time peak of system wind generation at 5GW. This was hence a period where participants could reasonably have expected curtailment instructions to be issued. The bid curve for WPPs for this time is shown in fig. 2. The bid prices for WPPs ranged between -74 £/MWh and the maximum -9999 £/MWh.
The bids can be broadly divided into three categories: 1. 2GW of nearmarginal bids (74 £/MWh to
-140 £/MWh), from WPPs seeking to capitalize on the ability to generate frequent small returns 2. 2GW of ‘opportunistic’ bids (150 £/MWh to -350 £/MWh) which seek to generate infrequent large returns under occasional conditions of high curtailment
3. 1GW of ‘sleeper’ bids (-700 £/MWh to -9999 £/MWh) which aim to avoid curtailment altogether
Although participants in the BM can review bids and amend their own at a half-hourly resolution, no WPP was found to have amended their bid during the rest of the month of February 2013, despite a variety of wind and constraint conditions. This indicates that WPP bids have a high inertia, and this is likely a result of the impact bid acceptance has upon the Power Purchase Agreement with the off-taker. If a bid is accepted, then the Renewable Obligation Certificates (ROCs) associated with the curtailed energy are lost, and a mechanism for recouping lost ROC revenue would have to exist between the WPP and off-taker. As a result, the WPP may be contractually restricted in altering its bids and the market will have low fluidity.
The data also demonstrates that bids may appear which are below the marginal cost to the WPP (taken as the value of the wholesale energy plus ROCs), and this may be because WPPs do not wish to be seen publicly as profiting from what may be perceived as a failure to generate during favourable wind conditions.
V. CONCLUSION
[image:5.595.312.529.62.228.2]Application of Nash equilibria analysis to a pay-as-bid wind curtailment market demonstrates that even under a scenario of perfect player knowledge, real price discovery will not occur, and WPPs may be able to take advantage of high constraint periods to benefit from curtailment pricing significantly above marginal costs. This finding is supported by modelling of the islanded distribution network supplying the Shetland Isles, as well as from historical data of WPP curtailment in an existing pay-as-bid balancing mechanism in the Great Britain electricity market.
Figure 2. WPP bid curve from the GB Balancing Mechanism at 11am on 3rd February 2013. A single bid of -9999 £/MWh is omitted for clarity.
Additionally, there are a number of contractual issues particular to wind power which may disincentivise the wind power plant’s operator to act as an efficient market player, and which may act in opposition to any market-based approach to wind curtailment.
ACKNOWLEDGMENT
The authors would like to acknowledge Scottish Hydro Electric Power Distribution and Ofgem for their support of this research under the Northern Isles New Energy Solutions (NINES) project. The views expressed in this paper are those of the authors.
REFERENCES
[1] D. J. Burke and M. J. O'Malley, "Factors influencing wind energy curtailment," IEEE Transactions onSustainable Energy 2.2 (2011): 185-193.
[2] E.A. DeMeo, G.A. Jordan, C. Kalich, J. King, M.R. Milligan, C. Murley et al, "Accommodating wind's natural behavior," Power and
Energy Magazine, IEEE, vol.5, no.6, pp.59,67, Nov.-Dec. 2007
[3] Connect and Manage Guidance, March 2013. National Grid Electricity Transmission plc UK.
[4] S. Fink, C. Mudd, K. Porter and B. Morgenstern, “Wind energy curtailment case studies,” NREL subcontract report, NREL/SR-550-46716, October 2009.
[5] N.M von der Fehr and D. Harbord, "Spot Market Competition in the UK Electricity Industry," The Economic Journal, Royal Economic
Society, vol. 103(418), pages 531-46, May 1993.
[6] M. Saguan, N. Keseric, P. Dessante and J-M. Glachant, "Market Power in Power Markets: Game Theory vs. Agent-Based Approach,"
Transmission & Distribution Conference and Exposition: Latin
America, 2006. TDC '06. IEEE/PES , vol., no., pp.1,6, 15-18 Aug.
2006
[7] D.M. Kreps, and J.A. Scheinkman, “Quantity precommitment and Bertrand competition yield Cournot outcomes,” The Bell Journal of
Economics, 326-337, Autumn 1983.
[8] M. J. Dolan, G. W. Ault, D. F. Frame, S. Gill, et al, “Northern Isles
New Energy Solutions: Active Network Management Stability Limits”, IEEE Power and Energy Society Innovative Smart Grid Technologies (Europe) 2012, Paper No, 376.
[9] M.J. Dolan, S. Gill, G. Ault, M. Barnacle, C. Foote, and G. Bell, “Modelling and delivery of an active network management scheme for the Northern Isles new energy solutions project,” CIRED 2013, 22nd International Conference on Electricity Distribution, Stockholm, Sweden.
[11] The Grid Code, Issue 5, Revision 3, 2013. National Grid Electricity Transmission plc UK.
[12] UK Wind Energy Database, Renewable UK.
[13] RIIO Electricity Transmission Workshop, 15th November 2013.
National Grid Electricity Transmission plc UK.