Abstract — We report an optofluidics based variable optical attenuator (VOA) employing a tapered, side-polished single-mode optical fiber attached to an electrowetting-on-dielectric (EWOD) platform. The side-polishing of the fiber cladding gives access to the evanescent field of the guided mode, while the EWOD platform electrically controls the stepwise translation of a liquid droplet along the variable-thickness, polished cladding of the fiber. The penetration of the evanescent field into the droplet leads to tunneling of optical power from the fiber core to the droplet, from where it is radiatively lost. As a result of the variable cladding thickness, the position of the droplet along the length of the polished fiber determines the degree of penetration of the evanescent field into the droplet. The droplet position can be electrically changed, thus controlling the optical power loss from the fiber. This approach has been used to demonstrate an optofluidic continuous-fiber VOA typically providing up to 26 dB of broadband attenuation in the 1550 nm transmission window, with a wavelength dependent loss less than 1.1 dB. In this paper, we present the theoretical modeling and experimental characterization of the system, discussing the influence of the design parameters on the performance of this VOA.
Index Terms—Variable optical attenuator, Electrowetting, Single mode optical fiber, Optical fiber devices
I. INTRODUCTION
HE adoption of single-mode optical fiber devices in optical fiber telecommunication networks and optical fiber measurement and sensing systems, together with the continuous drive for miniaturization of optical components motivates researchers to examine new approaches for manipulating optical signals. Optical fiber based variable optical attenuators (VOAs) are required for regulating optical power in optical fiber communication networks, optical fiber test and measurement equipment, and optical fiber sensors. In optical communications the VOA is used to dynamically control the optical power level from light sources, the gain equalization of amplifiers, and manage the optical power in receiver front-ends to avoid overload. In the field of optical
Manuscript received October 2, 2014.
A. Dudus, R. Blue, M. Zagnoni, G Stewart and D. Uttamchandani are with the Centre for Microsystems and Photonics, University of Strathclyde, Glasgow, Scotland, UK.
(corresponding author email: [email protected]).
test and measurement, VOAs are used to evaluate photoreceivers for dynamic range and linearity, and for avoiding saturation of optical detectors during optical sensitivity measurements. A desirable VOA attenuation range is at least 20 dB optical attenuation, broadband optical operation around 40 nm and wavelength dependent loss around 1 dB.
Through the 1990s researchers took advantage of micro-electro-mechanical systems (MEMS) technologies and applied these to create miniaturized optical fiber VOAs such as moving fiber [1, 2], shutter [3, 4, 5]and mirror types [6, 7, 8]. Although MEMS VOAs are well-known, these devices can have reliability issues associated with the usage of moving micromechanical mechanisms [9]. More recently, optofluidics technologies, which combine micro-photonics/micro-optics with microfluidics on a common physical platform, have been applied to yield a range of miniaturized optical devices with applications in optical sensing and imaging [10, 11, 12] as well as in optical communications [13]. Optofluidics offers the advantages of enabling miniaturization and optical device integration, and of yielding low-power-consumption devices using low-cost production techniques. To date, there have been relatively few fiber optic VOAs presented using optofluidics. Of those devices reported, different methods have been employed to actuate the fluidic VOA.
Liou and Yu [14] applied optical tuning to a photonic crystal fiber (PCF) impregnated with a photosensitive liquid crystal. The irradiation time of an external blue laser was used to give a variable optical attenuation up to 26 dB for a four second duration irradiation. Martincek and Pudis [15] also used a liquid-filled (liquid refractive index close to that of the fiber cladding) 3 mm length hollow core silica fiber, but used thermal tuning via a 2mW laser beam focused onto a tapered region of the fiber. Due to the difference in temperature coefficients of refractive index of the silica fiber and the liquid within the core, changes in temperature resulted in the guidance conditions of the fiber not being satisfied and thus a variable attenuation up to 60 dB was demonstrated. Konstantaki et al. [16] employed a magnetic liquid (ferrofluid) and used actuation via a magnetic field to translate the ferrofluid along the external surface of a long period grating (LPG) fiber, thereby producing narrowband optical attenuation of 6.5 dB at a center wavelength of 1587 nm. The most common method for fluid actuation in optofluidic applications
Modeling and characterization of an
electrowetting based single mode fiber
variable optical attenuator
A. Duduś, R. Blue,
Member
,
IEEE
, M. Zagnoni, G Stewart and
D. Uttamchandani,
Senior Member
,
IEEE
has relied on the use of electric fields. For example, Mathews et al. [17] applied a variable voltage of up to 310 Vpp perpendicularly to a photonic crystal fiber (PCF) filled with a
nematic liquid crystal to achieve up to 40dB attenuation through the change in photonic bandgap transmission of the fiber. Similarly, Gu et al. [18] employed a liquid crystal as an overlay material to a side-polished fiber so that the fluid was in contact with the optical evanescent field of the fiber. Application of a variable voltage changed the orientation of the liquid crystal molecules (and thus the fluid refractive index) causing variable optical loss from the fiber with an attenuation up to 25 dB.
The phenomenon of electrowetting, applied in free-space optics for obtaining adaptive lenses [19], has also been applied in guided-wave optics for the demonstration of fiber optic VOAs. Müller et al. [20] demonstrated a bistable optical attenuator with a single attenuation up to 47 dB using electrowetting induced displacements of fluid interfaces to switch between water and opaque oils situated between two GRIN-lensed optical fibers. Similarly, Reza and Riza [21] used a commercial variable focus liquid lens (Varioptic, France) positioned between two lensed fibers. Their electrowetting actuated variable attenuator produced a dynamic range up to 40 dB. In terms of a continuous-fiber VOA actuated by electrowetting, this has been demonstrated by Hsieh et al. [22] who used a photorefractive fiber with a long period grating (LPG). This LPG fiber was inserted in a channel and surrounded by a movable plug of an aqueous solution of sodium dichromate as a high-index fluid. As well as this fluid being toxic, the device was narrowband with a FWHM (full width at half maximum) of 10 nm around 1538 nm and a dynamic attenuation range of 20 dB. However, by subsequently engineering the refractive index characteristics of the LPG, the attenuation of 20 dB could be extended to a 40 nm bandwidth [23].
Recently, we have reported the initial modeling and experimental characteristics of a novel, continuous side-polished single-mode fiber based optofluidic VOA actuated by electrowetting-on-dielectric (EWOD) and using non-toxic fluids [24]. In contrast to some of the fiber VOAs described above, our VOA used a non-photorefractive fiber, (i.e. standard, off-the-shelf single mode optical fiber), and achieved broadband optical attenuation (40 nm bandwidth) with an optical attenuation range up to 26 dB. Moreover, our approach used a single, continuous optical fiber, thereby not having any fiber-gaps, nor using GRIN lenses or fiber lenses needed for accurate and constant alignment between fibers. Fiber-gaps create unwanted optical reflections, while using GRIN lenses or fiber lenses generates extra component cost and higher production cost due to the time-consuming alignment steps needed. Here, we provide a detailed account of the design, fabrication and operational characteristics of the device so that the key design parameters may be identified to allow the device performance to be tailored to particular requirements. Section II describes the fiber VOA design and operation, including aspects of liquid droplet translation using EWOD. Section III develops and applies the theory governing the
optical behavior of the device while Section IV presents the experimental measurements obtained from the fiber VOA. Finally, Section V presents a summary and conclusions.
II. DEVICE DESCRIPTION AND OPERATION
A. Overview
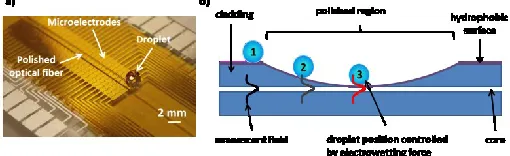
The proposed fiber optic broadband VOA consists of a side-polished single mode fiber positioned on a EWOD platform on which is also resting a fluid droplet, Fig 1a. The fiber is positioned on the EWOD platform with the polished cladding region orientated perpendicular to the platform surface. The side-polished fiber is characterized by the profile of the polished cladding region. When the polished cladding thickness reduces to a few microns, the optical evanescent field of the fiber can be accessed externally. This occurs over a total length of around 8-10 mm along the polished fiber axis. This is referred to as the “active” length of the polished fiber. The remaining polished region of the fiber, where the cladding thickness is greater than a few microns, does not significantly impact on the device behavior. The fluid used (a solution of glycerine and water) is in the form of a droplet whose refractive index is selected for optimal performance of this specific device (i.e. the refractive index is chosen to be close to the index of the fiber core). As the droplet is translated along the “active” polished region of the fiber cladding by the EWOD platform, the droplet-to-core separation is varied and the optical evanescent field increasingly penetrates the droplet, thereby allowing variable optical power loss from the fiber to be achieved, Fig. 1b.
Fig. 1 a) EWOD platform used to translate liquid droplets along the polished face of an optical fiber. b) The topology of a side-polished fiber allows a droplet to increasingly interact with the optical evanescent field dependent on the droplet position.
B. EWOD Platform Fabrication
[image:2.612.314.569.426.504.2]methoxy propyl acetate solvent in ratio 5:2) was spun on the slide at 5000 rpm for 30 sec. Finally, a 0.1 μm hydrophobic layer of Teflon AF was spun on the resist layer at 1000 rpm for 1 min and baked at 160°C for 10 minutes.
Fig. 2 Schematic representation of: a) the assembled EWOD platform. A side-polished fiber is positioned on the microelectrode array region of the EWOD platform with the polished region orientated perpendicularly to the microelectrode surface. Contact pads to apply an electric potential to the microelectrodes are left exposed to air; b) photolithographic fabrication steps used to create the EWOD platform.
C. Fabrication of Side-Polished Fiber
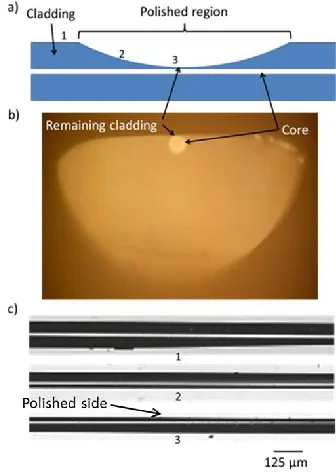
Side-polished single mode fibers (SMF-28, Corning Inc.) were fabricated in-house using a 150 mm diameter polishing wheel (Silverline Tools Ltd., UK) operating at around 100 rpm in conjunction with 9 µm aluminum oxide and 0.5 µm cerium oxide powders in water to give a polished region of approximately 20 mm total length. The optical power transmitted through the fiber was continuously monitored during polishing and the fiber cladding thickness was gradually decreased until the optical transmission changed, indicating that the evanescent field could be accessed externally. This occurred as expected when the cladding was reduced to a few microns above the core of the fiber [25]. Fig. 3a shows a schematic profile of the topology of the side-polished fiber, together with a photographic cross-section image of a polished fiber cleaved perpendicular to the polished surface (Fig. 3b).
As discussed later in the paper, the profile of the polished region has a significant effect on the attenuation characteristics of the device. The effect of polishing on the fiber was examined directly using an optical microscope and
the sequence of photographs are shown in Fig. 3c, while Fig. 4 shows a plot of the fiber diameter measured from these photographs as a function of distance along the fiber axis indicating the profile of the polished region.
After polishing the fiber, this was rendered hydrophobic by applying a commercially available water repellent solution (Aquapel Glass Treatment, PPG Industries Inc., USA) to prevent adhesion of water/glycerine to the fiber surface, forming a hydrophobic layer of a few nanometers thickness. During the duration of the experiments, no change in the hydrophobic condition of the substrate was observed.
Fig. 3 a) Schematic representation of the side polished fiber topology. b) Microscopy image of the cross section of a cleaved side polished fiber. c) Photomicrographs of three regions along the axis of the polished fiber corresponding to positions 1,2 and 3 in Fig. 3a. The photomicrographs show a gradual reduction of the fiber diameter (decreasing cladding thickness) obtained using a 150 mm diameter polishing wheel.
0 2 4 6 8 10 12
70 80 90 100 110 120 130
3
1
core - cladding interface
Fiber diameter
(
m
)
Distance along the fiber (mm)
full cladding thickness
[image:3.612.354.522.186.422.2]2
Fig. 4 Profile of the polishing fiber cladding measured using an optical microscope. Polishing wheel diameter is 150mm. The figure shows one half of the polished fiber profile. The numbers 1 to 3 refer to Fig. 3c.
D. Droplet Translation by Electrowetting Actuation Along the Polished Fiber
[image:3.612.333.532.501.641.2]contact line, with such forces able to distort the liquid-gas interface. This physical phenomenon is called electrowetting and can be mathematically described by the Lippman-Young equation [26] for a static droplet:
𝑐𝑜𝑠𝜃 = 𝑐𝑜𝑠𝜃0+2𝛾𝐶
𝐿𝐺𝑉
2 (1)
where θ0 is the zero-voltage contact angle between the droplet interface and the flat microelectrode surface, θ is the contact angle when a voltage is applied to the droplet, C is the capacitance of the dielectric and hydrophobic layers separating the electrode from the liquid, 𝛾𝐿𝐺 is the surface tension
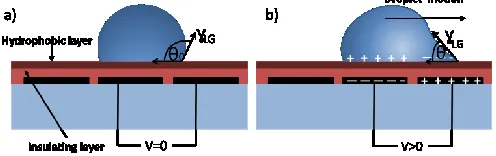
between liquid and gas phases, and V is the voltage applied between the droplet (through an electrode directly in contact with the droplet) and the electrode resting between the droplet and an insulating layer. This equation is applicable to conductive liquids forming a body upon a solid (typically hydrophobic) interface and characterizes a system where an increasing voltage decreases the contact angle of the droplet, thereby increasing the wettability of the surface.
[image:4.612.50.298.378.456.2]In the particular condition where a linear array of insulated microelectrodes are used, by applying a voltage between any two adjacent electrodes, an aqueous droplet overlapping such electrodes will experience an unbalanced dielectric force that causes the droplet to move towards the region of higher electric field (Fig. 5).
Fig. 5 Schematic of the electrowetting operation principle. a) Droplet in static condition and b) droplet movement due to the application of a voltage between adjacent electrodes. For a suitable electric field strength, the asymmetric distortion between the advancing and receding interfaces of the droplet results in the motion of the droplet due to its internal molecular cohesive forces.
Exploiting this electrowetting principle in our system, a droplet is moved along the polished cladding of the fiber in a stepwise manner using a series of electrically addressed adjacent microelectrodes (Figs. 2 and 5). For this movement to occur in the desired manner, several conditions must be satisfied, which depend mainly on the dimension of the droplet, the electrode size and the magnitude of the applied voltage. First, it is desirable that the droplet remains in a spherical shape during static condition. This can be expressed by defining the balance between gravity and surface tension forces using the Bond number (Bo):
𝐵
𝑜=
𝜌𝑔𝑅2𝛾𝐿𝐺 (2) where R is the droplet radius, g=9.8 m/s2 is the acceleration due to gravity, ρ is the droplet density and 𝛾𝐿𝐺 is the liquid –
gas interfacial tension. When Bo > 1 the liquid is no longer in a spherical shape and, consequently, can easily spread over the surface of more than 2 electrodes, impacting on the controlled motion of the droplet using the EWOD platform.
In addition, when the droplet is in motion, the balance between electrowetting and inertial forces against surface tension forces must be considered. This can be considered through the Weber number (We) and the electrowetting number (η). We is defined as the ratio between inertial and surface force [26, 27]:
𝑊𝑒 =
𝜌𝑣2𝑙𝛾𝐿𝐺 (3) where ρ is the density (glycerine-water solution 93%, 1243 kg/m3), v is the velocity of motion, l is the drop contact radius and 𝛾𝐿𝐺 is the surface tension between the liquid and gas
phases. η is defined as the ratio between the electric and surface force:
𝜂 =2𝛾𝑐𝑉2
𝐿𝐺 (4) where c is the capacitance per unit area of the dielectric layer (F/m2). Typically, when We < 1.1 droplet breakup does not occur and when η > 1 droplet motion is successfully initiated [26]. The combination of these two conditions ensures the correct droplet motion using the described EWOD platform. In our experiments, Bo was ~0.1, We ~0.3, and η ~2.0, satisfying all of the above mentioned requirements.
III. THEORETICAL ANALYSIS OF A SIDE-POLISHED FIBER AND EXTERNAL OVERLAY
As discussed in Section IIA, the proposed VOA is a continuous fiber device where an overlay dielectric material (in this case a liquid droplet) is translated along the polished region and the fiber transmission is reduced as more of the evanescent field is exposed to the droplet as a consequence of the reduction in cladding thickness along the polished fiber axis. The fiber is characterized by the core diameter of 8 μm and core refractive index of 1.46. The output power of the fiber can be described through a simple ray optics model giving the fiber transmission as:
𝑃𝑜𝑢𝑡
𝑃𝑖𝑛
= 𝑅
𝜂𝑧 (5)
where R is reflectivity, η is the number of reflections of the ray at the upper boundary per unit length, and z is the propagation direction (Fig. 6). The reflectivity for frustrated total internal reflection can be calculated from [28]:
𝑅 =
𝑒2𝛾𝑠+𝑒−2𝛾𝑠+2cos(𝜑21−𝜑13)𝜑
21= −2𝑡𝑎𝑛
−1(
𝛾𝛼
)
(7)𝜑
13= 𝜋 − 2𝑡𝑎𝑛
−1(
𝛾𝜌
)
(8)where 𝛼 = 𝑘0√𝑛22− 𝑛𝑒2, 𝛾 = 𝑘0√𝑛2𝑒− 𝑛12, 𝜌 = 𝑘0√𝑛32− 𝑛𝑒2,
n1, n2, n3 are the refractive indices of the fiber cladding, fiber core, and the external medium respectively, ne is the effective index of the guided mode and 𝑘0=2𝜋𝜆. The effective index of
the mode is described by 𝑛𝑒=𝛽𝑘𝑚
[image:5.612.53.298.63.288.2]0, where βm is the propagation constant.
Fig. 6 Illustration of a side-polished fiber showing a single reflected ray. The model is valid for an infinitely long polished cladding of constant thickness.
From the above equations, there are four factors that influence the performance of the VOA: cladding thickness, refractive index, wavelength and contact length between the droplet and the fiber. Hereafter, we will consider the effects produced by these parameters separately as a function of the cladding thickness, where we assume that an infinitely long polished fiber with a cladding of constant thickness is used. According to our model, the presence of a hydrophobic layer (of a few nanometers thickness and refractive index 1.436) on top of the polished fiber surface has a negligible impact on the attenuation level.
Contact length. The attenuation of the light in the fiber can be predicted as a function of the remaining cladding thickness over the polished region and the contact length between the droplet and the fiber. As can be seen in Fig. 7 this contact length between droplet and fiber has a strong impact on the performance of the device, with a longer contact length producing higher maximum attenuation.
-1.0 -0.5 0.0 0.5 1.0 1.5 2.0 2.5 3.0 3.5 20 22 24 -60
-55 -50 -45 -40 -35 -30 -25 -20 -15 -10 -5 0 5
Atten
auti
on (
dB)
Cladding thickness (m) Refractive index 1.4602 contact length:
0.8 mm 1.0 mm 1.2 mm 1.6 mm 2.4 mm
Fig. 7 Attenuation from a side-polished fiber versus cladding thickness for different contact lengths of the droplet over the fiber for a wavelength of 1550 nm and a constant external refractive index of 1.4602.
Refractive index. The attenuation of the light in the fiber also depends strongly on the refractive index of the external liquid. The droplet used in our device is created from a glycerine/water solution whose refractive index can be adjusted by changing the concentration of glycerine in water. Fig. 8 shows the optical attenuation for various refractive indices of the external medium for a fixed droplet contact length of 1.2 mm. It can be seen from Fig. 8 that the condition for maximum optical attenuation is reached when the refractive index of the droplet matches that of the core (1.46).
-1.0 -0.5 0.0 0.5 1.0 1.5 2.0 2.5 3.0 3.5 20 22 24 -40
-35 -30 -25 -20 -15 -10 -5 0 5
Atten
ua
tion
(d
B)
Cladding thickness (m) Contact length 1.2 mm refractive index:
1.4596 1.4600 1.4602 1.4606
Fig. 8 Effect on attenuation of the external refractive index of a droplet when in close proximity to the fiber core for a wavelength of 1550 nm and a constant droplet contact length of 1.2 mm.
Wavelength. For practical applications, it is desirable for a VOA to have a broad bandwidth of operation. For the VOA system presented, the theoretical attenuation calculated from equations (6), (7), (8) is wavelength dependent through the k0 term. However, ∆𝑘0
𝑘0 ≃
∆𝜆
𝜆 <3% over the 1520 - 1560 nm range
and therefore the effect on the attenuation will be small as evidenced by the theoretical results shown in Fig. 9.
0.0 0.5 1.0 1.5 2.0 20 22 24
-40 -35 -30 -25 -20 -15 -10 -5 0
Atten
ua
taio
n (
dB)
Cladding thickness (m)
refractive index 1.46 wavelength:
1520 nm 1540 nm 1560 nm
0.0500 0.0501
-35.48 -35.47 -35.46
Att
enaution (dB)
Cladding thickness (m)
[image:5.612.320.545.216.387.2] [image:5.612.331.538.521.694.2] [image:5.612.57.270.543.711.2]Cladding thickness. From the above theoretical equations it can also be noted that the value of the cladding thickness after polishing has a strong impact on the attenuation characteristics of the VOA. For example, as seen in Figs. 8 and 9, noticeable attenuation only starts when the cladding thickness is reduced to a value less than 2 µm.
Profile shape. The above analysis is based on a droplet moving over a polished cladding of constant thickness. However, in practical applications, this condition will not be easily achieved and the polished profile will depend on the method used for polishing the fiber. Therefore, in addition to the above parameters, the topology of the polished profile of the fiber cladding should also be examined. To illustrate the effect on attenuation due to the profile shape, we consider the examples of a linear, quadratic and polynomial profiles (Fig. 10) along a polished half-length of around 5 mm starting from 6 µm cladding thickness and ending at the thinnest part of the polished fiber (where the polished cladding thickness is close to 0 µm).
0 1 2 3 4 5 6
0 1 2 3 4 5 6
Clad
din
g th
ic
kn
es
s
(
m
)
Distance (mm)
cladding profile: linear quadratic polynomial
Fig. 10 Arbitrary models of different cladding profiles obtained after polishing: linear, quadratic, third order polynomial.
Fig. 11 shows the attenuation characteristics of the VOA for each of these three profiles shown in Fig. 10. The linear and quadratic profiles have a low initial sensitivity of attenuation with distance, followed by a rapid change in attenuation with distance as the center of the polished fiber is approached.
-1 0 1 2 3 4 5 6
-25 -20 -15 -10 -5 0
refractive index 1.4602 polynomial quadratic linear
Atten
ua
tion
(d
B)
Distance (mm)
Fig. 11 Theoretical approximation of the attenuation versus droplet position
along the fiber for different polished cladding profiles (droplet contact length of 1.2 mm, wavelength 1550 nm).
The polynomial profile presents instead a quasi-linear decrease in attenuation over distance. Therefore, the polynomial profile could be considered a desirable topology as the droplet displacement over the polished cladding region produces an almost proportional attenuation.
It is clear from the above results that to achieve larger attenuation, one can either increase the polishing depth or increase the contact length between the droplet and the fiber (i.e. by placing a bigger droplet in contact with the polished fiber). However the fiber cannot be polished beyond the thickness of the cladding to avoid exposing the core surface, otherwise the fiber will have a large insertion loss. When the fiber polishing depth is increased then the surface quality has greater impact on the insertion loss as the evanescent field is larger at the polished surface and hence is more sensitive to scattering from the irregularities (i.e. roughness) or contamination on the surface.
IV. EXPERIMENTAL EVALUATION OF FABRICATED VOA
A. Experimental Setup
For the experimental evaluation, two types of fiber were utilized. The first fiber (described as “Fiber 1”) was a commercially obtained side-polished fiber acquired from Phoenix Photonics Ltd (UK) while the second side-polished fiber (described as “Fiber 2”) was produced in-house using the fiber polishing process described in Section II. As stated previously, the polished fiber was placed on the EWOD platform with the polished face perpendicular to the EWOD surface, while the liquid droplet was positioned so that it made contact with the EWOD platform electrodes and the polished fiber cladding. Adjacent electrodes on the EWOD platform were connected to an amplifier (A400, FLC Electronics) connected to a waveform generator (Agilent 3228A) which produced a square wave voltage of frequency 1 kHz that was amplified to an amplitude of 180 V. This voltage waveform was applied sequentially between adjacent electrodes generating step-wise displacement of the droplet along the polished face of the fiber (parallel to the fiber axis) with the step-length determined by the electrode width. The droplet moves from one electrode to the next in a straight line due to the symmetric pattern of the microelectrodes (i.e. the electrowetting force on the droplet has a cancelling effect along the perpendicular direction of motion). If the droplet is initially positioned in contact with the fiber, a moving droplet will remain in contact with the polished surface during its motion. In addition, the droplet size has been chosen (at least 4 times bigger than the fiber diameter) to account for possible misalignment of the fiber with respect to the electrodes.
[image:6.612.56.278.294.445.2] [image:6.612.55.275.556.713.2]time of approximately 400 ms in switching the attenuation from one level to the next. The recorded data was uploaded onto a computer for analysis. The refractive index of the single mode fiber core was 1.46. A range of glycerine/water solutions (from 92% to 94% by weight glycerine in water) was prepared which yielded solutions having refractive indices varying from 1.4596 to 1.4606. The refractive index of the droplet used during each experiment was measured with an Atago Master-RI refractometer. Different volumes of droplet were manually dispensed onto the surface of the electrodes close to the start of the polished region of the fiber. The droplet–fiber contact length varied from 0.8 to 1.6 mm when the volume of the dispensed droplet varied from 0.7 µL to 3 µL. To estimate the contact length, the EWOD platform with fiber and droplet was placed under an upright microscope and images were acquired of the droplet making contact with the polished fiber (Fig. 12). The contact length was then determined using AutoCad software to analyze the images.
Fig. 12 Microscopy image showing a glycerine-water droplet on top of the microelectrode array and contacting the polished fiber, providing a means to measure the droplet contact length.
B. Experimental Results
The theoretical analysis of Section III showed the effect of the contact length and droplet refractive index on the achievable optical attenuation. Fig. 13 presents experimental results of how the droplet contact length affected the performance of the VOA. When the contact length increased from 0.8 mm to 1.2 mm, the attenuation also increased as expected. The expectation that the attenuation would continue to increase when the droplet contact length increased from 1.2 mm to 1.6 mm was not observed from the experimental results. This is believed to be due to the sloping profile of the polished region and the ratio of lengths of the polished region and the droplet, resulting in the longer droplet extending into the region of thicker cladding where, as we have shown, there is much lower evanescent wave penetration and optical attenuation. However, as expected, the rate of increase in attenuation over distance is consistently greater for larger droplets (Fig.13). In addition, there is also a trade-off between the number of attenuation steps achievable and the maximum attenuation obtained from the VOA. Wider electrodes on the EWOD platform are needed to move larger (i.e. longer contact
length) droplets. Since the “active” length of the polished fiber is fixed, there will be a smaller number of wider electrodes spanning the active length, and it follows that fewer attenuation steps will be obtained. From Fig. 13 it can be seen that there are more attenuation steps produced with the 400 µm electrodes giving a maximum attenuation of 17 dB, while there are fewer attenuation steps produced with the 1000 µm electrodes but a maximum attenuation of 32 dB is achieved.
-1 0 1 2 3 4 5
-35 -30 -25 -20 -15 -10 -5 0 5
Atten
ua
tion
(d
B)
Distance (mm)
refractive index 1.4602
interaction length (electrode width): 0.8 mm (400m)
1.0 mm (600m) 1.2 mm (600m) 1.6 mm (1000m)
Fig. 13 Experimental results of attenuation as a function of droplet position for different contact lengths between droplet and polished region (average of 7 experiments using Fiber 2)
The theoretical analysis also showed that the VOA performance is highly dependent on the droplet refractive index. The experimental results obtained using droplets of different refractive indices are shown in Fig. 14. The results for Fiber 1 are obtained with three refractive indices, one below and two above the core refractive index. The highest attenuation was obtained using a droplet of 1.4602 refractive index, thus verifying the theoretical prediction that the maximum attenuation will be achieved when the droplet refractive index is closest to the fiber core refractive index (1.46). Similarly, this droplet refractive index of 1.4602 also produced the highest value of attenuation for experiments performed using Fiber 2. The difference in maximum attenuation obtained from the two fibers is due to the different polished cladding thicknesses. Fiber 2 was determined to have a deeper polished cladding compared with Fiber 1. From Fig. 15, the maximum experimental attenuation using Fibre 1 was 22 dB corresponding to a theoretical cladding thickness of 0.30 µm, while the maximum attenuation using Fiber 2 was 26 dB corresponding to a theoretical cladding thickness of 0.13 µm.
[image:7.612.323.554.155.318.2] [image:7.612.76.270.278.423.2]0 1 2 3 4 5 6 -25
-20 -15 -10 -5 0
Atten
uat
io
n (d
B)
Distance (mm)
fiber 1 experimental results: refractive index 1.4596 refractive index 1.4602 refractive index 1.4606 fiber 3 experimental result:
[image:8.612.333.543.51.217.2]refractive index 1.4602
Fig. 14 Experimental impact of the different droplet refractive indices on the VOA performance (droplet contact length 1.2 mm, wavelength 1550 nm, electrode width 600 µm ).
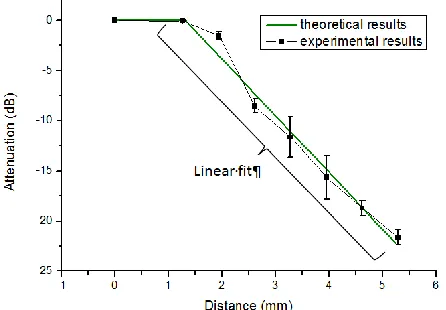
Fig. 15 Linear best fit to the experimental results for the VOA with Fiber 1 and droplet of 1.4602 refractive index (droplet contact length 1.2 mm, wavelength 1550 nm, electrode width 600 µm ).
A good approximation is obtained from a linear fit for the attenuation (A) of the form A(s) =m*x + c, where x is the distance along the fiber, m is slope or sensitivity of the system and c is the intercept. From equations (5) and (6) we can compute the attenuation as a function of the remaining cladding thickness, A(s), and hence, combining this with the linear fit and computing the cladding profile (x as a function of s) from:
𝑥 = 𝐴(𝑠)−𝑐𝑚 (9)
Fig. 16 shows the polished cladding profile computed from equation (9) using experimental values of m=-5.66 dB/mm and c=7.49 dB from Fig. 15. A comparison of the fitted linear attenuation function with the one derived theoretically using a range of cladding profiles (Figs. 10&11) indicates that the fiber used in our experiments will have a cladding profile approaching that of a third order polynomial, thus emphasizing the importance of the cladding profile on the VOA performance.
1 2 3 4 5 6
0 1 2 3 4 5 6
Cladd
ing
thickn
ess (
m)
Distance (mm)
Fig. 16 Profile of the central polished region of the fiber estimated from Eq. 9.
As noted earlier, a fundamental desirable feature of a VOA is broadband operation, preferably over the telecommunications wavelengths of 1520 to 1560 nm. To investigate its wavelength dependence, our VOA was connected to a broadband EDFA while an optical spectrum analyzer (Agilent 86140B) was used to measure the wavelength dependent loss (WDL) as shown in Fig. 17. The WDL for the highest attenuation for Fiber 1 reaches 1.1 dB for a droplet refractive index of 1.4602 which is within the acceptable limits of such a device.
1520 1530 1540 1550 1560
-20 -15 -10 -5 0
Atten
ua
tion
(d
B)
[image:8.612.58.289.54.220.2]Wavelength (nm)
Fig. 17 Broadband spectrum for the VOA with an external droplet of 1.4602 (droplet contact length 1.2 mm, electrode width 600 µm).
V. CONCLUSION
[image:8.612.63.286.270.425.2] [image:8.612.328.552.377.544.2]control over the profile shape of the polished cladding, environmentally sealing the device, and implementing automatic computer controlled translation of the droplet.
REFERENCES
[1] A. Unamuno and D. Uttamchandani, “MEMS variable optical attenuator with vernier latching mechanism,” IEEE Photonic Tech. Lett., vol.18, no. 1, pp. 88-90, 2006.
[2] X. Dai, X. Zhao, G. Ding, and B. Cai, “Micromachined electromagnetic variable optical attenuator for optical power equalization,” J. Microlith. Microfab. Microsyst., vol 4, no. 4, p. 041304-1, 2005.
[3] J. Zawadzka, L. Li and D. Uttamchandani, “Characterisation of a nanostepper driven optical shutter for application in free-space microoptics,” IET Sci. Meas. Technol., vol 151, no. 2, pp. 61-66, 2004. [4] J. C. Chiou and W. T. Lin, “Variable optical attenuator using a thermal
actuator array with dual shutters,” Opt. Commun., vol. 237, no. 4, pp. 341-350, 2004.
[5] R. R. A. Syms, H. Zou, J. Stagg, and H. Veladi, “Sliding-blade MEMS iris and variable optical attenuator,” J. Micromech. Microeng., vol. 14, no. 12, pp. 1700-1710, 2004.
[6] H. Cai, X. M. Zhang, C. Lu, A. Q. Liu, and E. H. Khoo, “Linear MEMS variable optical attenuator using reflective elliptical mirror,” IEEE Photonic Tech. Lett., vol. 17, no. 2, pp. 402-404, 2005.
[7] C. Lee, “Variable optical attenuator using planar light attenuation scheme based on rotational and translational misalignment,” Microsyst. Technol., vol. 13, no. 1, pp. 41-48, 2007.
[8] K. H. Koh, Y. Qian, and C. Lee, “Design and characterization of a 3D MEMS VOA driven by hybrid electromagnetic and electrothermal actuation mechanisms,” J. Micromech. Microeng., vol. 22, no. 10, pp. 105031-105044, 2012.
[9] O.Tabata, T. Tsuchiya, O. Brand, G. K. Fedder, C. Hierold J. G. Korvink (eds), Reliability of MEMS: Testing of Materials and Devices
(Wiley-VCH., Weinheim, 2008).
[10] Y. Yang, A. Q. Liu, L. K. Chin, X. M. Zhang, D. P. Tsai, C. L. Lin, C. Lu, G. P. Wang and N. I. Zheludev, “Optofluidic waveguide as a transformation optics device for lightwave bending and manipulation,”
Nat. Commun., vol. 3, no. 651, pp. 1-7, 2012.
[11] X. Heng, D. Erickson, L. R. Baugh, Z. Yaqoob, P. W. Sternberg, D. Psaltis and C. Yang, “Optofluidic microscopy-a method for implementing a high resolution optical microscopeon a chip,” Lab Chip, vol. 6, no. 10, pp. 1274-1276, 2006.
[12] C-C Cheng, J. Andrew Yeh, “Dielectrically actuated liquid lens”,Optics Express, vol. 15, no 12, pp. 7140-7145, 2007.
[13] A. J. Chung and D. Erickson, “Optofluidic waveguides for reconfigurable photonic systems,” Opt. Express, vol. 19, no. 9, pp. 8602-8609, 2011.
[14] J. Liou and C. Yu, “Optically tunable fiber attenuators based on photonic liquid crystal fibers,” 2012 17th Opto-Electronics and Communications Conference (OECC 2012) Technical Digest, Busan, Korea, pp. 787-788, July 2012.
[15] I. Martincek and D. Pudis, “Variable liquid-core fiber optical attenuator based on thermo-optical effect,” J. Lightwave Technol., vol. 29, no. 17, pp. 2647-2650, 2011
[16] M. Konstantaki, A. Candiani, and S. Pissadakis, “Optical fibre long period grating spectral actuators utilizing ferrofluids as outclading overlayers,” J. Eur. Opt. Soc.-Rapid, vol. 6, pp. 11007-110013, 2011.
[17] S. Mathews, G. Farrell, and Y. Semenova, “Experimental demonstration
of an all-fiber variable optical attenuator based on liquid crystal infiltrated photonic crystal fiber,” Microw. Opt.l Techn. Lett. , vol. 53, no. 3, pp. 539-543, 2011.
[18] C. Gu, Y. Xu, and Y. Liu, “Fiber based devices for dwdm optical communication systems, information optics and photonics technology,” edited by G. Mu, F. T. S. Yu, S. Jutamulia, Proc. SPIE, vol. 5642 (SPIE, Bellingham, WA, 2005).
[19] Ren, H., Xianyu, H., Xu, S. & Wu, S.-T. “Adaptive dielectric liquid lens”. Opt. Express, vol. 16,no. 19, 14954–60 (2008).
[20] P. Müller, A. Kloss, P. Liebetraut, W. Mönch and H. Zappe, “A fully integrated optofluidic attenuator,” J. Micromech. Microeng., vol. 21, no. 12, pp. 125027-125041, 2011.
[21] S. A. Reza and N. A. Riza, “A liquid lens-based broadband variable fiber optical attenuator,” Opt. Commun., vol. 282, no. 7, pp. 1298-1303 (2009).
[22] J. Hsieh, P. Mach, F. Cattaneo, S. Yang, T. Krupenkine, K. Baldwin and J. A. Rogers, “Tunable microfluidic optical-fiber devices based on electrowetting pumps and plastic microchannels,” IEEE Photonic Tech. Lett., vol. 15, no. 1, pp. 81-83, 2003.
[23] B. R. Acharya, T. Krupenkine, S. Ramachandran, Z. Wang, C. C. Huang and J. A. Rogers, “Tunable optical fiber devices based on broadband long-period gratings and pumped microfluidics,” Appl. Phys. Lett., vol. 83, no. 24, pp. 4912-4914, 2003.
[24] A. Duduś, R. Blue, M. Zagnoni, G. Stewart, and D. Uttamchandani, “In-line single-mode fiber variable optical attenuator based on electrically addressable microdroplets,” Appl. Phys. Lett., vol. 105, no. 2, 2014. [25] Z. Chen and C. Bai, “Effect of overlaid material on optical transmission
of side-polished fiber made by wheel side polishing,” 2008 1st Asia-Pacific Opt. Fiber Sensors Conf., vol. 6, no. 4, pp. 1-4, Aug. 2008. [26] J. Berthier, Microdrops and digital microfluidics. William Andrew Inc.,
2008.
[27] B. Shapiro, H. Moon, R. Garrell, C-J. Kim, "Equilibrium Behavior of Sessile Drops under Surface Tension, Applied External Fields, and Material Variations," J. Appl. Phys., 2003, 93, 5794-5811.
[28] G. Stewart and B. Culshaw, “Optical waveguide modelling and design for evanescent field chemical sensors,” Opt. Quantum Electron., vol. 26, pp. 249-259, 1994.
[29] M. Born and E. Wolf, Principles of optics: electromagnetic theory of propagation, interference and diffraction of light, 7th ed., vol. 53, no. 10. NY: Cambridge University Press, 1999, p. Chapter 1.
Anna Duduś received the MSc degree in Electronics (specialization in
microsystems) from the Wroclaw University of Technology, Poland in 2010. She is currently working toward the PhD degree at the Dept. of EEE in the Centre for Microsystems and Photonics of the University of Strathclyde, Glasgow, UK. Her research areas include optofluidic devices and applications.
Robert Blue received the Ph.D. degree in optical electronics from
the University of Strathclyde, Glasgow, U.K., in 1996. He is currently at the Centre for Microsystems and Photonics, University of Strathclyde. His current research interests span chemical and biomedical sensors using optical and electrical measurement techniques.
Michele Zagnoni received the Dr Eng degree in electronic engineering and the PhD degree in electronic engineering and computer sciences from the University of Bologna, Italy, in 2002 and 2006, respectively. From 2006 to 2010, he worked as a postdoctoral researcher in the Department of Electronics first at the University of Southampton and then at the University of Glasgow, working on the development of microfluidic platforms. In 2010, he was appointed lecturer at the University of Strathclyde where he currently leads a research group focussed on developing microfluidic and lab-on-a-chip systems for biological applications. His research interests and activities include miniaturised technologies in the field of synthetic biology for protein studies, 3D cancer models and cancer drug screening, microfluidics for the study of central nervous system disorders and single-cell targeted nanomedicine.
George Stewart was awarded a BSc Degree with First Class Honours in 1974
and the PhD degree in 1979 for research on integrated optics, both from the University of Glasgow, Scotland, UK. He continued research on integrated optics at the University of Glasgow until 1985 and then joined the University of Strathclyde, Glasgow, where his research has been in the areas of fibre optic components, evanescent wave devices, optical sensors, fibre lasers and laser spectroscopy. Professor Stewart is the author or co-author of 180 technical & scientific papers in photonics and is a member of the Optical Society of America and the Institute of Physics.
Deepak Uttamchandani is Head of the Centre for Microsystems and