Journal Name
Cite this: DOI: 10.1039/c0xx00000x
www.rsc.org/xxxxxx
Dynamic Article Links
►
ARTICLE TYPE
Determination of metal ion concentrations by SERS using 2,2’-bipyridyl
complexes
Julie Docherty,
aSamuel Mabbott,
aW. Ewen Smith,
aJohn Reglinski,
bKaren Faulds
a, Christine
Davidson
band Duncan Graham*
aReceived (in XXX, XXX) Xth XXXXXXXXX 20XX, Accepted Xth XXXXXXXXX 20XX
5
DOI: 10.1039/b000000x
Surface enhanced Raman scattering (SERS) can generate characteristic spectral “fingerprints” from metal complexes, thus providing the potential for the development of methods of analysis for the identification and quantitation of a range of metal ions in solution. The advantages include sensitivity and the use of one ligand for several metals without the need for a specific chromophore. Aqueous solutions of Fe(II), Ni(II),
10
Zn(II), Cu(II), Cr(III) and Cd(II) in the presence of excess 2,2’-bipyridyl (bipy) were analysed using SERS. Specific marker bands enabled the identification of each metal ion and the limit of detection for each metal ion was estimated. Two of the ions, Zn(II) and Cu(II), could be detected below the World Health Organisation’s (WHO) recommended limits for drinking water at levels of 0.22 and 0.6 mg L-1,
respectively.
15
Introduction
The identification and detection of metal ions in solution is important in environmental monitoring, industrial process monitoring and biomedical diagnostics.1 There are several
analytical techniques that are available for metal ion
20
determination, such as inductively coupled plasma atomic emission and mass spectrometry (ICP-AES and ICP-MS), atomic absorption spectroscopy (AAS), ultraviolet-visible (UV-Vis) spectroscopy and fluorescence spectroscopy. Of these, ICP-AES and ICP-MS are the most commonly used techniques due to their
25
high sensitivity and throughput capabilities.2
UV-Vis and fluorescence spectroscopy are less expensive and more flexible to apply. Using them requires a chromophore to detect metal ion concentrations and relies on detecting the absorption or emission of metal complexes. Among the many
30
examples of the use of absorption spectroscopy are the colourimetric determination of nickel with dimethylglyoxime and arsenic determination using silver diethyldithiocarbamate.3, 4
Fluorescent sensors have also been developed for the detection of many metal ions.5-11 These sensors are usually designed by
35
linking a receptor molecule, which has a selective affinity for the metal ion of interest, to a fluorophore which exhibits changes in emission on binding to the ion.
Surface enhanced Raman scattering (SERS) can also be used for the detection of metal ions by forming metal complexes. The
40
major advantage of SERS is that it can provide molecularly specific data enabling a range of metals to be identified from the complexes formed with one ligand. There is no need for a chromophore, although one can be present, enabling the use of a much wider rage of ligands. As a result, SERS has significant
45
potential to develop methods to unambiguously detect a range of
metal ions with the same ligand using the same analytical procedure for each. SERS analysis can also provide lower detection limits than UV-Vis spectroscopy and the sensitivity can be comparable to that of fluorescence spectroscopy.12 Another
50
benefit of SERS is the wide availability of portable Raman spectrometers, which are becoming better, smaller and cheaper, making it an effective detection technique for the sensing of metal ions in field applications.13
SERS sensors using a reporter ligand for the analysis of a
55
single metal ion species have been reported.14-21 However, the
discrimination of different metal ions using SERS has also been published.22-24 For example, Kim et. al. have used cyanide for the
detection of Cr(III), Fe(III), Fe(II), Ni(II) and Mn(II).25 The shift
in the C-N stretch on complexing was monitored using SERS. In
60
the presence of trivalent ions, this band blue-shifted by up to 64 cm-1, whereas for divalent metal ions, it was blue-shifted by
26-35 cm-1. A low detection limit of 1 fM was reported making this
method potentially useful for the detection of metal ions in environmental samples. Tsoutsi et. al. have reported the use of
65
terpyridine for the simultaneous detection of Cu(II) and Co(II) at ultratrace levels.1 The terpyridine was attached to silver
nanoparticles and used as a SERS substrate via the dithiocarbamate unit. Complexation with either Co(II) or Cu(II) produced changes in the vibrational SERS spectra of the
70
terpyridine.
Here we report the use of the chelating ligand 2,2-bipyridyl (bipy) as a reporter as it is known to form complexes with many metals and therefore, one method could be used to detect many different metal ions. The technique is demonstrated using the
75
as a standard test but for other ions, the complexes formed are either colourless, or are only weakly coloured due to d to d transitions.26
Experimental
Chemicals
5
All reagents were purchased from Sigma-Aldrich and used as received.
Nanoparticle Synthesis and Characterisation
Silver citrate nanoparticles were prepared using a modified
10
version of the Lee and Meisel method.27 Briefly, 90 mg of silver
nitrate, dissolved in 10 mL water, was added to 500 mL of water and heated to boiling under vigorous stirring. A 1% aqueous solution of sodium citrate was added slowly and the solution boiled for a further 20 – 30 min before being left to cool to room
15
temperature.
The quality of the colloid was assessed using UV-Vis spectroscopy. Silver colloid made in this way should have a λmax
of approximately 400 nm and a full width at half maximum (FWHM) of less than 100 nm in order to be as reasonably close
20
to being monodisperse. The extinction spectrum obtained for the colloid used in this work demonstrated a λmax of 401 nm and a
FWHM of approximately 90 nm.
Preparation of Samples
25
Tris(N,N'-bipyridyl)zinc nitrate, Bis(N,N'-bipyridyl) O,O'-nitrato-zinc nitrate and (N,N'-bipyridyl)zinc bromide were prepared using reported methods.28
A stock solution of bipy (5 mM) was prepared by dissolving 78 mg in 100 mL methanol, before dilution with water to reach a
30
concentration of 400 μM. 10 mM stock solutions of the metal nitrate salts were also prepared by dissolving the appropriate amount in water. These were subsequently diluted to give the desired concentrations.
For SERS measurements, 25 μL of each metal ion was added
35
to 25 μL of 400 μM bipy, which was left overnight to allow the complex to form completely. However, leaving the samples for less time also allows discrimination between the metal ions. The bipy-metal complex was then added to 200 μL of Ag citrate colloid before addition of 10 μL of 0.1M NaCl to induce
40
aggregation. Three replicates of each sample were then analysed using SERS. Metal nitrate salts were used with the exception of Fe(II) where the chloride salt was used instead as no nitrate salt of this metal was commercially available.
45
Instrumentation
UV-Vis spectra of a 1 in 10 dilution of the colloid in a 1cm cuvette were collected using a Varian, Cary Win UV 300, dual beam scanning UV-Vis spectrometer (Agilent, Santa Clara, CA) in the wavelength range 200 – 800 nm.
50
Raman spectra of the solid bipy complexes were obtained using a WITec Alpha 300 R confocal microscope (WITec, Ulm, Germany) with 532 nm excitation wavelength.
Rapid SERS analysis was conducted using an Avalon
Instruments Ltd. RamanStation compact benchtop spectrometer
55
(PerkinElmer, Waltham, MA). The system uses a 532 nm diode laser with a laser power of 100 mW. All measurements were carried out using a 10 s exposure time and a resolution of 0.5 cm-1
in the range 250–2000 cm-1. The instrument is fitted with a
motorised x-y-z sample stage, which accepts 96-well microtitre
60
plates and the instrument’s software was used to automatically drive the stage to each well in turn. The instrument was calibrated using an ethanol standard to ensure optimum distance between the sample and the laser aperture.
65
Results and Discussion
Choice of bipy:metal ratio
Bipy can react with a wide range of metal ions to form mono-, bis- or tris-complexes depending on the metal ion and ligand concentration. SERS is sensitive to geometrical changes,
70
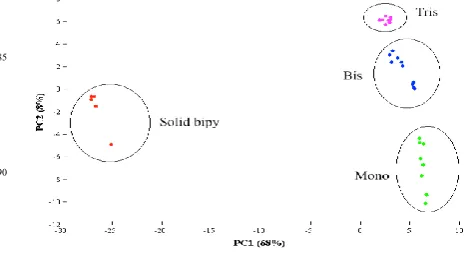
consequently this must be taken into account when developing methods for the identification and detection of metal ions. For example, solid Zn(II)-bipy complexes, in each of the mono, bis and tris forms, were synthesised and their Raman spectra obtained (see SI). Principal Component Analysis (PCA) was
75
applied to determine if each of the three forms were statistically different from one another, and the scores plot demonstrates that each complex can be successfully separated (Figure 1). To develop a method to identify and quantify several metal ions, an excess of bipy is maintained ensuring that all complexes are
80
present as the tris form.29, 30
85
90
95
To determine the concentration required to produce the tris complex, SERS was recorded from a series of solutions with
100
equal volumes of between 10 to 100 μM bipy added to a 10 μM Zn(II) solution (see SI). The intensity of the aromatic stretches (1400 – 1600 cm-1) increases with concentration, with the ring
breathing mode (1010 cm-1) being the most intense band in the
spectrum at low concentrations. Another change is the
105
appearance of a second peak at 1022 cm-1 close to the ring
breathing mode at higher concentrations. It is thought that the band at 1010 cm-1 is due to the adsorption of bipy to the NP
surface via the nitrogen atoms whereas the second band appearing at 1022 cm-1 is due to the Zn(II) complex of bipy. The
110
[image:2.595.297.534.396.523.2]tris complex forms between 40 μM and 30 μM, above which the
Figure 1: Scores plot following PCA analysis of the Raman spectra of the solid bipy-Zn(II) complexes in the mono (green), bis (blue) and tris (pink) states. The uncomplexed ligand is also depicted (red) yellow
spectrum is relatively stable (Figure 2). A bipy:metal ratio of 4:1 was chosen for the method development as this excess forms tris complexes and good discrimination from the uncomplexed ligand.
5
10
15
20
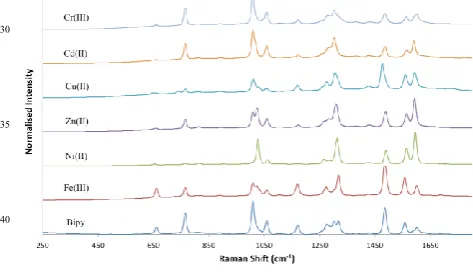
SERS of 4:1 solutions of bipy with Fe(II), Ni(II), Zn(II), Cu(II), Cd(II) and Cr(III) are shown in Figure 3. Both intensity and
25
frequency changes were observed. The frequencies of the main bands are listed in Table 1 along with their assignments.31, 32
30
35
40
45
First Row Transition Metals: Iron to Zinc
50
Fe(II) forms a red coloured complex with bipy, which has an absorption maximum at 522 nm.26 This maximum occurs close to
the exciting wavelength of 532 nm and consequently, molecular resonance will produce greater SERS enhancement for Fe(II) compared to the other metal ions.33 Therefore, with a
55
concentration of 10 μM Fe(II), signal saturation occurs. As a result, a lower concentration (i.e. 1 uM) is displayed in order to compare iron with the other ions. The main difference between Fe(II) and the other ions is the peak ratios of the aromatic stretches. It is evident that the band at 1484 cm-1, attributed to a
60
C=N stretch + C-H in-plane deformation, is the most intense whereas for the other metal ions, it is the bands at around 1010 or 1600 cm-1 which are most dominant. The difference in intensities
is probably due to molecular resonance. As a result, these bands
can be used to discriminate Fe(II) from Ni(II) and Zn(II). Whilst
65
the ratio of the intensities of the Fe(II) aromatic bands are similar to those of the uncomplexed bipy ligand, they are greatly enhanced in the presence of Fe(II) as the stretch at 1484 cm-1
becomes the most intense band in the spectrum, compared to the ring breathing mode at 1010 cm-1 for uncomplexed bipy. As the
70
metal ions interact via the lone pair of electrons on the nitrogens, it is reasonable for the aromatic stretches, which have C=N character, to be affected by the coordination of metal ions. The Fe(II) spectrum also shows unique changes in the inter-ring stretches (~1300 cm-1) that can also be used to help discriminate
75
Fe(II) from the uncomplexed bipy and the other metal ions with greater confidence. Three inter-ring stretches are present in the free ligand spectrum whereas for Fe(II), only two, well-separated bands are observed at 1279 and 1309 cm-1. Finally, a shoulder
appears at the ring breathing stretch at 1022 cm-1 which assists in
80
differentiating Fe(II)-bipy complexes from the uncomplexed ligand.
Zn(II) and Ni(II) give similar SERS profiles, however there are some differences which discriminate between the two ions. One difference occurs in the ring breathing mode, which is attributed
85
to the physisorption of the nitrogen atoms on the NP surface in the uncomplexed ligand.31 For Ni(II), this peak occurs at 1026
cm-1, a relatively large blue-shift of 16 cm-1 due to the nitrogen
atoms coordinating to Ni(II) ions and not physisorbing on the surface of the NP. For Zn(II) however, it is clear that two bands
90
can be observed in the spectrum at 1010 and 1022 cm-1. The
difference in the intensity of the band at 1010 cm-1 may be due to
excess uncomplexed ligand binding to the surface of the NP due to weaker surface attachment of the Zn(II)-bipy complex, whereas the 1022 cm-1 stretch is due to the Zn(II)-bipy complex.
95
Nevertheless, this one band can be used to distinguish Zn(II) and Ni(II) from each other, and from the uncomplexed ligand. However, the shape of the bands associated with the inter-ring stretches also differ and therefore, can be used to identify of either Ni(II) or Zn(II).
100
Copper
Copper is subject to the Jahn-Teller effect and forms complexes with distorted geometries. Consequently, the SERS spectrum of
105
the Cu(II)-bipy complex is significantly different from the other first row metals (Figure 3). The main marker band used for Cu(II) identification is the aromatic stretch at 1474 cm-1. This band
occurs between 1484 and 1488 cm-1 for all other complexes. The
ratio of these aromatic stretches are also characteristic of Cu(II),
110
and the shape of the inter-ring stretches also changes with two stretches observed at 1275 cm-1 and 1312 cm-1. Finally, the ring
breathing mode slightly differs from that observed in the SERS spectrum of the free ligand as a slight shoulder appears at 1030 cm-1.
115
Other Metals: Cadmium and Chromium
SERS of cadmium, a main group element, and chromium III, were also obtained (Figure 3). The inter-ring stretches are the main distinguishing feature for the Cd(II)-bipy complex, with a
120
strong band 1302 cm-1 and slight shoulders at 1262 and 1280 cm
-Figure 2: Comparison of the SERS spectra obtained from 10 uM Zn(II) added to 40 uM (top, green) and 30 uM (middle, red) of bipy. The SERS spectrum of the uncomplexed bipy ligand is also shown (bottom, blue) (λex =
[image:3.595.48.282.106.231.2]532 nm, acc. time = 10s)
[image:3.595.46.283.338.478.2]1. The aromatic stretches are also a useful indicator for Cd(II)
5
coordination as the ratio of these bands differ from those of the uncomplexed bipy ligand and, although they are in a similar ratio to Ni(II) and Zn(II), their intensities are reduced greatly compared to these ions. The ratio of the aromatic stretches, along with the decreased intensity is a good indication of Cr(III)
10
coordination. The inter-ring stretches change with only two bands visible at 1279 cm-1 and 1302 cm-1. As a result, Cd(II) and Cr(III)
can also be identified by SERS.
Principal Component Analysis
15
PCA was a used to extract the data and statistically highlight the differences between the samples, allowing the identification and differentiation of the various complexes. Figure 4 displays the scores plot for each of the six metal ions, along with uncomplexed bipy. Each sample forms well-separated clusters,
20
demonstrating that each metal-bipy complex has different spectroscopic features, which allow them to be unambiguously identified.
25
1
30
35
40
Concentration Relationships
The concentration dependence of each complex was determined (Figure 5) and the detection limits calculated.
45
50
55
60
65
The graphs for Ni(II), Zn(II) and Cu(II) were obtained by using a band which was discernible by eye and also specific to each of these ions (1026, 1022 and 1474 cm-1, respectively). The
intensities of these bands were plotted against concentration, and the lowest observable detection limit for these species are listed
70
in Table 2, along with the recommended WHO level in drinking water.34 The uncertainty associated with each metal ion were also
calculated by multiplying the %RSD by the LOD. It can be seen
Wavenumber (cm-1) Assignment
Free bipy
Fe(II) Ni(II) Zn(II) Cu(II) Cd(II) Cr(III)
1010 1010,
1022
1026 1010,
1022
1010 (sh: 1030)
1010 1010 Ring breathing
1275 1279 1267 1268 1275 1279 (sh:
1258)
Ring str. C-C,C-N + C-C inter-ring str. +
C-H i.p. def.
1302 1283 1283 1302 (sh:
1280, 1262)
1302 C-C inter-ring str.
(trans)
1317 1309 1309 1309 1312 C-C inter-ring str.
(cis) 1485,
1558, 1600
1488, 1562, 1593
1488, 1565, 1594
1488, 1565, 1593
1474, 1559, 1590
1485, 1565, 1590
1484, 1562, 1600
[image:4.595.67.526.88.327.2]Aromatic stretches
[image:4.595.64.524.89.327.2] [image:4.595.297.542.401.584.2]Table 1: Frequencies of the main bands in the SERS spectra of each metal ion along with their assignments
Figure 4: PCA scores plot of all the metal-bipy complexes studied (3 replicates). Free bipy, dark blue; Fe(II), light green; Cu(II), red; Zn(II),
purple; Ni(II), light blue; Cr(III), dark green; Cd(II), yellow.
Figure 5: Concentration Relationships for all metal ions. Top left: Ni(II) (I1026 vs conc.); top right: Zn(II) (I1022 vs conc.); middle left: Cu(II) (I1474 vs conc.);
from this table that the observable limits for Zn(II) and Cu(II) are below the WHO guideline, suggesting that this system would be capable of detecting hazardous levels of these metal ions in drinking water. However, the limit of Ni(II) would have to be improved in order to detect Ni(II) at the levels necessary, as the
5
level this system can detect is higher than the WHO recommendation.
For Fe(II), Cd(II) and Cr(III), peak ratios were used to determine the observable detection limit as intensity changes were the most unique indicator for the presence of these species.
10
From the graphs, it can be seen that a good linear response is obtained, until a point where the ratios plateau. Again the observable limits are compared to the recommended limits in Table 2. Fe(II) does not have a recommended limit as Fe(II) salts in drinking water are insoluble and therefore precipitate out as
15
insoluble Fe(III) hydroxide.35 From the comparisons shown in the
table, it is evident that the levels for Cd(II) and Cr(III) would also have to be improved to meet WHO limits.
Conclusions
20
In conclusion, it has been shown that different metal-bipy complexes have unique and characteristic SERS spectra, illustrating the potential of this method for metal ion analysis. Fe(II), Ni(II), Zn(II), Cu(II), Cr(III) and Cd(II) all show specific changes in the SERS spectrum of bipy, enabling the
25
discrimination of these species. PCA was used to group the results according to the variation in their spectra, and each metal ion complex formed distinct clusters proving that they are statistically different from one another. Finally, concentration dependence studies were conducted to determine the sensitivity
30
for each metal ion. A detection limit of 0.22 mg L-1 was
calculated for Zn(II) and for Cu(II), 0.6 mg L-1, both of which are
lower than the recommended limits set out by the WHO. Therefore, this system is sensitive enough for the detection of these ions in environmental water samples, however testing real
35
samples, e.g. fresh or marine waters, will have to be completed in order to test the system with more realistic environmental conditions. However, the detection limit for the other species are not sensitive enough to be used directly for environmental monitoring and any method would require a pre-concentration
40
step or further method improvement. Although the detection limits for this system are not as low as for some other reported methods, a wide range of metal ions can be detected using a simple ligand. A number of changes were detected in the spectrum of each complex enabling the discrimination of each
45
complex with greater confidence.
Acknowledgements
This work was supported by the Royal Society of Chemistry’s Analytical Chemistry Trust Fund and the Natural Environment
50
Research Council (NERC) [NE/J01771X/1]. DG thanks the Royal Society for support from a Wolfson Research Merit Award. The research data associated with this paper has the
following DOI:
10.15129/38671508-b630-4276-820c-2fc6bdbe6fae
55
Notes and references
a Centre for Molecular Nanometrology, WestCHEM, Pure & Applied
Chemistry, University of Strathclyde, Technology & Innovation Centre, 99 George Street, Glasgow, G1 1RD, UK. E-mail:
b WestCHEM, Pure & Applied Chemistry, University of Strathclyde, 295
Cathedral Street, Glasgow, G1 1XL, UK.
† Electronic Supplementary Information (ESI) available: [details of any supplementary information available should be included here]. See DOI: 10.1039/b000000x/
65
1. D. Tsoutsi, L. Guerrini, J. M. Hermida-Ramon, V. Giannini, L. M. 70
Liz-Marzan, A. Wei and R. A. Alvarez-Puebla, Nanoscale,
2013, 5, 5841-5846.
2. O. T. Butler, W. R. L. Cairns, J. M. Cook and C. M. Davidson, Journal of Analytical Atomic Spectrometry, 2015, 30, 21-63.
3. A. M. Mitchell and M. G. Mellon, Industrial & Engineering
75
Chemistry Analytical Edition, 1945, 17, 380-382.
4. A. G. Howard and M. H. Arbab-Zavar, Analyst, 1980, 105, 338-343.
5. H.-H. Wang, Q. Gan, X.-J. Wang, L. Xue, S.-H. Liu and H. Jiang, Organic Letters, 2007, 9, 4995-4998.
6. J. Y. Kwon, Y. J. Jang, Y. J. Lee, K. M. Kim, M. S. Seo, W. Nam 80
and J. Yoon, Journal of the American Chemical Society, 2005,
127, 10107-10111.
7. P. Jiang and Z. Guo, Coordination Chemistry Reviews, 2004, 248, 205-229.
8. C.-C. Huang and H.-T. Chang, Analytical Chemistry, 2006, 78,
8332-85
8338.
9. R. Metivier, I. Leray and B. Valeur, Chemical Communications,
2003, 996-997.
10. E. M. Nolan and S. J. Lippard, Journal of the American Chemical Society, 2003, 125, 14270-14271.
90
11. F. A. Abebe, C. S. Eribal, G. Ramakrishna and E. Sinn, Tetrahedron
Letters, 2011, 52, 5554-5558.
12. Y.-X. Yuan, L. Ling, X.-Y. Wang, M. Wang, R.-A. Gu and J.-L.
Yao, Journal of Raman Spectroscopy, 2007, 38, 1280-1287.
13. A. Hakonen, P. O. Andersson, M. Stenbæk Schmidt, T. Rindzevicius 95
and M. Käll, Analytica Chimica Acta.
14. Ž. Krpetić, L. Guerrini, I. A. Larmour, J. Reglinski, K. Faulds and D. Graham, Small, 2012, 8, 707-714.
15. Y. Xue, H. Zhao, Z. Wu, X. Li, Y. He and Z. Yuan, Analyst, 2011,
136, 3725-3730.
100
Metal Ion Detection limit (mg L-1)
WHO guideline (mg L-1)
Cd(II) 0.77 ± 0.07 0.003
Cr(III) 2.4 ± 0.2 0.005
Cu(II) 0.6 ± 0.06 2
Fe(II) 0.02 ± 0.0002 -
Ni(II) 0.087 ± 0.009 0.02
Zn(II) 0.22 ± 0.02 3
16. J. Li, L. Chen, T. Lou and Y. Wang, ACS Applied Materials & Interfaces, 2011, 3, 3936-3941.
17. W. Ren, C. Zhu and E. Wang, Nanoscale, 2012, 4, 5902-5909.
18. J. Yin, T. Wu, J. Song, Q. Zhang, S. Liu, R. Xu and H. Duan, Chemistry of Materials, 2011, 23, 4756-4764.
5
19. Y. Wang and J. Irudayaraj, Chemical Communications, 2011, 47,
4394-4396.
20. M. Mulvihill, A. Tao, K. Benjauthrit, J. Arnold and P. Yang, Angewandte Chemie, 2008, 120, 6556-6560.
21. Y. Chen, L. Wu, Y. Chen, N. Bi, X. Zheng, H. Qi, M. Qin, X. Liao, 10
H. Zhang and Y. Tian, Microchimica Acta, 2012, 177, 341-348.
22. L. Guerrini, I. Rodriguez-Loureiro, M. A. Correa-Duarte, Y. H. Lee, X. Y. Ling, F. J. Garcia de Abajo and R. A. Alvarez-Puebla, Nanoscale, 2014, 6, 8368-8375.
15
23. L. Szabó, K. Herman, N. E. Mircescu, I. S. Tódor, B. L. Simon, R. A.
Boitor, N. Leopold and V. Chiş, Journal of Molecular
Structure, 2014, 1073, 10-17.
24. L. Szabó, K. Herman, N. E. Mircescu, A. Fălămaş, L. F. Leopold, N.
Leopold, C. Buzumurgă and V. Chiş, Spectrochimica Acta
20
Part A: Molecular and Biomolecular Spectroscopy, 2012, 93, 266-273.
25. K. Kim, J. W. Lee and K. S. Shin, Analyst, 2013, 138, 2988-2994.
26. M. L. Moss and M. G. Mellon, Industrial & Engineering Chemistry
Analytical Edition, 1942, 14, 862-865. 25
27. P. C. Lee and D. Meisel, The Journal of Physical Chemistry, 1982,
86, 3391-3395.
28. G. H. Eom, H. M. Park, M. Y. Hyun, S. P. Jang, C. Kim, J. H. Lee, S. J. Lee, S.-J. Kim and Y. Kim, Polyhedron, 2011, 30, 1555-1564.
30
29. R. A. Palmer and T. S. Piper, Inorganic Chemistry, 1966, 5, 864-878. 30. W. W. Brandt, F. P. Dwyer and E. D. Gyarfas, Chemical Reviews,
1954, 54, 959-1017.
31. D. P. Butcher, S. P. Boulos, C. J. Murphy, R. C. Ambrosio and A. A. Gewirth, The Journal of Physical Chemistry C, 2012, 116, 35
5128-5140.
32. Z. Luo, B. H. Loo, X. Cao, A. Peng and J. Yao, The Journal of Physical Chemistry C, 2011, 116, 2884-2890.
33. T. J. Dines and R. D. Peacock, Journal of the Chemical Society, Faraday Transactions 1: Physical Chemistry in Condensed 40
Phases, 1988, 84, 3445-3457.
34. WHO, WHO Guidelines for drinking-water quality, World Health
Organization, Geneva, 2011.
35. WHO, Iron in Drinking-water, World Health Organisation, Geneva,