RESEARCH ARTICLE
Ligand exchange method
for determination of mole ratios of relatively
weak metal complexes: a comparative study
Mokhtar Mabrouk
1,2, Sherin F. Hammad
1, Mohamed A. Abdelaziz
1,3and Fotouh R. Mansour
1,2*Abstract
Ligand exchange method is introduced as an alternative to Job’s and mole ratio methods for studying the stoichiom-etry of relatively weak metal complexes in solutions. The method involves adding varying amounts of a ligand (L) to an excess constant amount of a colored complex (MX) with appropriate stability and molar absorptivity. The absorb-ance of each solution is measured at the λmax of the initial complex, MX, and plotted against the concentration of the studied ligand, L. If the newly formed complex ML does not absorb at the λmax of the initial complex, then attenuation of the absorbance of the initial complex on adding varying quantities of the investigational ligand gives an inverse calibration line that intersects with the calibration curve of initial complex at a given point. If a line parallel to the ordi-nate is drawn from this point to the x-axis, the ratio of the two parts of the x-axis to the left and to the right (α/β) gives the metal to ligand molar ratio in the complex formed, ML. The new method has been applied to the study of the composition of iron (III) complexes with three bisphosphonate drugs: alendronate, etidronate, and ibandronate. The mole ratio was found to be 1:1 with the three investigated bisphosphonates and results were further confirmed by Job’s and mole ratio methods. The ligand exchange method is simpler, quicker, easier to perform and more accurate than Job’s and mole ratio methods for studying weak and relatively weak complexes.
Keywords: Ligand exchange method, Mole ratio method, Job’s method, Bisphosphonates, Relatively weak complexes
© The Author(s) 2018. This article is distributed under the terms of the Creative Commons Attribution 4.0 International License (http://creat iveco mmons .org/licen ses/by/4.0/), which permits unrestricted use, distribution, and reproduction in any medium, provided you give appropriate credit to the original author(s) and the source, provide a link to the Creative Commons license, and indicate if changes were made. The Creative Commons Public Domain Dedication waiver (http://creat iveco mmons .org/ publi cdoma in/zero/1.0/) applies to the data made available in this article, unless otherwise stated.
Introduction
The mole ratio is the proportion of number of moles of any two chemical entities involved in a compound or a chemical reaction. Studying the mole ratio is important to calculate the reaction yield, determine the stoichiometry and monitor the reaction kinetics. Several spectropho-tometric methods were developed for the determination of the molar ratio of metal complexes. The first method goes back to the contributions of Ostromisslensky [1] and Job [2], and was widely known as Job’s method of contin-uous variations. In this method, a series of solutions are prepared by mixing varying proportions of the metal and ligand, keeping the sum of the total molar concentrations
constant. The absorbance of each solution is then plotted against the mole fraction of either the ligand or metal. The position of the maximum in the resulting curve, or minimum in some cases [3], gives the mole fraction. The simplicity of the method made it widely applied for the study of various metals and association complexes [4–9], in spite of its limitations. For instance, strong complexes give triangular plots from which the position of the maxi-mum is easily determined, while the plots of weak com-plexes are highly curved leading to unreliable results. Normalized absorbance plots (A/Amax vs. mole fraction)
gave sharper plots at the maxima and allowed for better location of the mole ratio [10], but for weak complexes, these normalized Job plots were still highly curved.
Besides the method of continuous variations, the mole ratio method has been used frequently since its intro-duction by Yoe and Jones [11]. In this method, a series of solutions are prepared by varying the amount of ligand
Open Access
*Correspondence: [email protected]
2 Pharmaceutical Services Center, Faculty of Pharmacy, Tanta University,
Tanta 31111, Egypt
uncertain. As a result, several chemical [12] and math-ematical modifications [13–15] have been made to the basic mole ratio method so that it can reliably be applied to study the composition of weak complexes. However, these modifications make the method relatively more complicated and are only applicable when the ligand has significant absorbance which is not always the case.
A recent method based on ligand exchange has been introduced by Mansour and Danielson [16]. The method involves adding varying amounts of the ligand (L), whose combining ratio with metal (M) is being studied, to an excess constant amount of a colored complex (MX) with appropriate stability and molar absorptivity. The absorbance of each solution is meas-ured at the λmax of the initial complex, MX, and plotted
against the concentration of the studied ligand, L. If the
of Mansour-Danielson’s method is shown in Additional file 1.
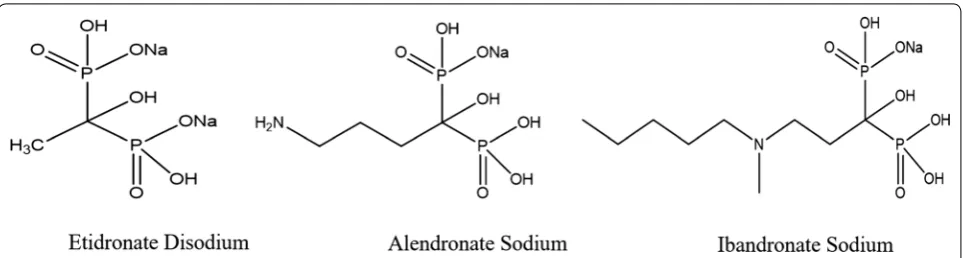
In our previous work, the ligand exchange method has been applied for determination of mole ratios other than 1:1 [16]. In this work, we present the mathemati-cal proof of the ligand exchange method for the first time and apply it for determination of relatively weak complexes of selected bisphosphantes (Fig. 2) with ferric ion [9]. The ferric complexes of bisphospho-nates are used for the spectrophotometric determina-tion of bisphosphonates in pharmaceutical tablets [9]. Determination of the mole ratios of these complexes is important to adjust the amount added of the ferric salt in the experimental part. The ligand exchange method was also compared with Job’s and mole ratio methods; its advantages over these commonly employed methods are discussed.
Theory of Mansour–Danielson’s method of ligand exchange
Suppose that MX and ML are two complexes of a metal M with two ligands, X and L, where MX is a colored com-plex, ML is a colorless complex and MX is less stable than ML. For a certain concentration of the complex MX, the absorbance depends on the molar absorptivity of MX (εMX) and the concentration (CMX) according to the equation:
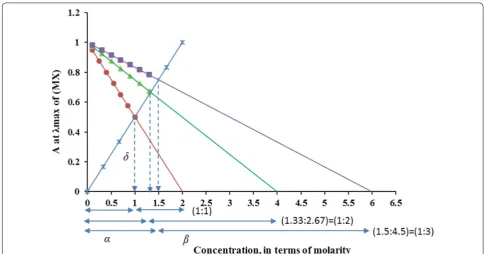
If a certain amount of ligand L was added to the previ-ous MX solution, a displacement reaction will take place and the absorbance will decrease as shown in Fig. 1. The decrease in the absorbance depends on the concentration of the ligand L (CL) and the mole ratio of the ML complex (n) according to the equation:
From Eq. 2, we get:
Equation 3 is a straight line equation (y = a ± bx) with
an intercept equals εMX·CMX and a slope equals −n·εMX. If A was plotted against CL, a straight line with a nega-tive slope will be obtained as shown in Fig. 1. The mole ratio can be determined graphically from the overlay of the two calibration curves as follows:
A straight line parallel to the y-axis is drawn from the intersection point of the calibration curves to divide the x-axis into two parts: α and β. The length of both parts (α and β) can be calculated from the length of the parallel line (δ) and the slopes of the calibration curves where:
while,
(1)
A=εMX·CMX
(2)
A=εMX·(CMX−nCL)
(3)
A=εMX·CMX−nεMX·CL
(4)
α= δ
Slope of Eq1 = δ εMX
(5)
β=
δ
Slope of Eq2 =
δ nεMX
From Eqs. 4 and 5, we get:
Experimental
Instrumentation
Jenway 3510 (Jenway, UK) and Biochrom libra S80 (Bio-chrom, Cambridge, UK) were employed in all pH and absorbance measurements, respectively.
Materials
Alendronate sodium trihydrate, etidronate disodium, and ibandronate sodium monohydrate of pharmaceuti-cal grade were kindly provided by Sigma Pharmaceutipharmaceuti-cal Industries (Quesna, Menofyia, Egypt). All other chemi-cals and solvents used were of analytical ACS grade, pur-chased from Fisher Scientific (Fair Lawn, NJ, USA) and Sigma-Aldrich (St. Louis, MO, USA).
Standard solutions
Fe(III)-salicylate solution was prepared at 10 mM in water/methanol (50:50, pH 3.2) and was proved to be stable for months when kept refrigerated. Fe(III) chlo-ride stock solution (for the mole ratio and Job’s methods) was prepared at 10 mM in 2 M HClO4. Etidronate
diso-dium stock solution was prepared at 10 mM in two dif-ferent diluents: 2 M HClO4 for both the mole ratio and
Job’s methods and water/methanol (50:50, pH 3.2) for the ligand exchange method. Similarly, stock solutions of alendronate sodium and ibandronate sodium were prepared.
Procedures
Ferric salicylate complex calibration curve
A series of standard solutions of ferric salicylate in the range of 0.1–0.6 mM were prepared by accurately trans-ferring appropriate aliquots of ferric salicylate stock solu-tion (10 mM) into a series of 10 mL calibrated volumetric flasks, then completed to the mark with water/methanol
(6)
α β =n
NaCl). Absorbance at 535 nm was measured and plotted against concentration. A similar procedure was applied to determine the mole ratio of Fe(III)-alendronate and Fe(III)-ibandronate.
Job’s method
Standard nine mixtures of ferric chloride (in 2 M HClO4)
and etidronate (in 2 M HClO4) were prepared by adding
aliquots of Fe(III) equivalent to 1 − 9 µmol into a series of 10 mL volumetric flasks containing aliquots of etidronate equivalent to 9 − 1 µmol so that each flask contains a total number of 10 µmol. Each flask is completed to the mark using HClO4 (2 M). Job’s graph is obtained by
plot-ting absorbance at 300 nm against the mole fraction of Fe(III) ion. The same procedure was repeated with iban-dronate and aleniban-dronate.
Mole ratio method
Standard mixtures of ferric chloride (in 2 M HClO4) and
etidronate (in 2 M HClO4) were prepared by adding
ali-quots of Fe(III) equivalent to 0.4–30 µmol into a series of 10 mL volumetric flasks containing 5 µmol of etidronate. Each flask is completed to the mark using HClO4 (2 M).
The mole ratio graph is obtained by plotting absorbance at 300 nm against the mole ratio (Fe(III)/etidronate). The same procedure was applied to study the stoichiometry of Fe(III)-ibandronate and Fe(III)-alendronate.
Results and discussion
Absorption spectra
The absorption spectra of reacting species, Fe(III) ions and etidronate, together with the absorption spectrum of their complex have been recorded in 2 M perchloric acid in the wavelength range from 200 to 400 nm (Fig. 3). Spectra of iron(III) perchlorate and iron(III)-etidronate complex show an absorption maximum at 239 and 252 nm, respectively. On the other hand, etidronate and the other studied bisphosphonates do not show signifi-cant absorbance in the spectral region indicated above [17]. For Job’s and mole ratio methods, all absorbance measurements were performed at 300 nm where the absorbance difference between the complex and Fe(III) ions approaches maximum, and the absorption of metal
ions is low. For the ligand exchange method, all spectro-photometric measurements were conducted at 535 nm, the wavelength that corresponds to the absorption maxi-mum of iron(III)-salicylate at the conditions employed.
Ligand exchange method using Fe(III)‑salicylate
According to a previously published work that studied the effect of pH and ionic strength on the absorbance of Fe(III)-salicylate complex [18], the absorbance of the complex was found constant over a pH range of (2.5–3.5). After trying several solvents, a 50% methanol at pH 3.2 was chosen owing to the high Fe(III)-salicylate absorb-ance and reasonable plateau that ensures the robustness of the method against small changes in pH. A solution of 0.5 M NaCl was used to adjust the ionic strength and keep it constant over all the following procedures.
An overlay of the direct and inverse calibration curves of ferric salicylate and bisphosphonate, respectively, is used to determine the combining metal to ligand ratio (Fig. 4). The quotient of α/β is equal to the stoichiomet-ric ratio of metal to bisphosphonate ligand and was found to be 1:1 with the three investigated bisphosphonates. Calibration curves of the three studied bisphosphonates were linear in the range (0.02–0.18) mM with correlation coefficients (r) equal − 0.999, − 0.997 and − 0.996 with etidronate, alendronate, and ibandronate, respectively.
Comparison to other mole ratio methods
The 1:1 ratio determined for the Fe(III) complex with alendronate is congruent with the work of Kuljanin and his colleagues [9] that is based on Job’s and mole ratio
Fig. 3 Absorption spectra of (I) etidronate (1 × 10⁻³ M), (II) FeCl 3 (2 × 10⁻⁴M), and (III) FeCl
methods. On the other hand, results of ibandronate and etidronate complexes with Fe(III) have been confirmed by performing Job’s and mole ratio methods. The Job’s plots (Fig. 5) showed a peak at a mole fraction of 0.5, whereas the tangents of straight-line portions of the mole ratio curves intersect at a value of 1 (Fig. 6). Therefore, results of both methods provide a further confirmation of the 1:1 ratio determined by the ligand exchange method. Fig. 4 An overlay of Fe(III)-salicylate calibration curve (×) with inverse
calibration curves of a ibandronate (●), b alendronate (▲), and c
etidronate (■)
Fig. 5 Job plots of Fe(III) complexes with etidronate (■), alendronate (▲), and ibandronate (●) ([Fe(III)] + [bisphosphonate]) = 1 mM
Fig. 6 Molar ratio method: plots of Fe(III) complex with etidronate (■), alendronate (▲) and ibandronate (●) ([bisphosphonate]
cise than Job’s and the mole ratio methods for determina-tion of weak and relatively weak complexes; determining the mole ratio using these methods in this case is sub-jective due to the curved lines. As shown in Additional file 2: Fig. S1, different tangents can be drawn for the same group of points, which may lead to false conclusions while in the ligand exchange method, there is no need to draw tangents which obviates bias and decreases the risk of error. (iv) The ligand exchange method could be used for metals other than ferric, such as Cu(II), and for determi-nation of mole ratios other than 1:1 [16] which indicates the generality of the method and (v) neither Job’s nor the mole ratio methods can be used unless one of the stud-ied reactants or the formed complex are absorbing. In this case, the ligand exchange will be the method of choice.
Conclusion
The ligand exchange method can reliably be used as an alternative to Job’s and mole ratio methods for the deter-mination of formula of complexes with the aid of a sim-ple colorimeter, and could be superior in determining the composition of weak and relatively weak complexes. The method has successfully been applied to the study of the composition of ferric ion complexes with the non-chromophoric bisphosphonates: alendronate, etidronate and ibandronate. The ligand exchange method gives straight lines from which the exact mole ratio can be determined. The method does not require tangent draw-ing which can be subjective and may lead to inaccurate conclusions especially when weak complexes are studied. The ligand exchange method could also be preferable for determining the composition of high ratio complexes and that will be the focus of our future research.
Additional files
Additional file 1: A video that explains the principle of Mansour-Danielson’s method.Additional file 2: Fig. S1. Molar ratio’s plots for Fe(III) complex with ibandronate showing different conclusions for the same results depending on the drawn tangents.
Author details
1 Department of Pharmaceutical Analytical Chemistry, Faculty of Pharmacy,
Tanta University, Tanta 31111, Egypt. 2 Pharmaceutical Services Center, Faculty
of Pharmacy, Tanta University, Tanta 31111, Egypt. 3 Department of
Pharma-ceutical Analytical Chemistry, Faculty of Pharmacy, Kafrelsheikh University, Kafrelsheikh 33511, Egypt.
Competing interests
The author declares that they have no competing interests.
Availability of data and materials
All data and materials are all provided.
Consent for publication
All the authors gave their consent for the publication of this article.
Ethics approval and consent to participate
The experiment was conducted according to the rules of the Ethical commit-tee of the Tanta University, Egypt.
Publisher’s Note
Springer Nature remains neutral with regard to jurisdictional claims in pub-lished maps and institutional affiliations.
Received: 9 May 2018 Accepted: 4 December 2018
References
1. Ostromisslensky I (1911) Über eine neue, auf dem Massenwirkungsgesetz fußende Analysenmethode einiger binärer Verbindungen. Zur Prioritäts-frage. Berichte der Dtsch Chem Gesellschaft 44:1189–1190. https ://doi. org/10.1002/cber.19110 44011 76
2. Job P (1928) Formation and stability of inorganic complexes in solution. Ann Chim 9:113
3. Vosburgh WC, Cooper GR (1941) Complex Ions. I. The identification of complex ions in solution by spectrophotometric measurements. J Am Chem Soc 63:437–442. https ://doi.org/10.1021/ja018 47a02 5
4. Qin Z, Niu W, Tan R (2009) Spectrophotometric method for the determi-nation of telmisartan with congo red. J Anal Chem 64:449–454. https :// doi.org/10.1134/S1061 93480 90500 49
5. Zayed SIM (2009) Two charge-transfer complex spectrophotometric methods for the determination of sulpiride in pharmaceutical formula-tions. Cent Eur J Chem 7:870–875. https ://doi.org/10.2478/s1153 2-009-0091-2
6. Shaalan RA-A (2010) Improved spectrofluorimetric methods for determi-nation of penicillamine in capsules. Cent Eur J Chem 8:892–898. https :// doi.org/10.2478/s1153 2-010-0049-4
•fast, convenient online submission •
thorough peer review by experienced researchers in your field • rapid publication on acceptance
• support for research data, including large and complex data types •
gold Open Access which fosters wider collaboration and increased citations maximum visibility for your research: over 100M website views per year •
At BMC, research is always in progress.
Learn more biomedcentral.com/submissions
Ready to submit your research? Choose BMC and benefit from:
8. Ostović D, Stelmach C, Hulshizer B (1993) Formation of a chromo-phoric complex between alendronate and copper(II) ions. Pharm Res 10:470–472
9. Kuljanin J, Janković I, Nedeljković J et al (2002) Spectrophotometric deter-mination of alendronate in pharmaceutical formulations via complex formation with Fe(III) ions. J Pharm Biomed Anal 28:1215–1220. https :// doi.org/10.1016/S0731 -7085(02)00021 -3
10. Likussar W, Boltz DF (1971) Theory of continuous variations plots and a new method for spectrophotometric determination of extraction and formation constants. Anal Chem 43:1265–1272. https ://doi.org/10.1021/ ac603 04a00 6
11. Yoe JH, Jones AL (1944) Colorimetric determination of iron with disodium-1,2-dihydroxybenzene-3,5-disulfonate. Ind Eng Chem Anal Ed 16:111–115. https ://doi.org/10.1021/i5601 26a01 5
12. Harvey AE, Manning DL (1950) Spectrophotometric methods of estab-lishing empirical formulas of colored complexes in solution. J Am Chem Soc 72:4488–4493. https ://doi.org/10.1021/ja011 66a04 4
13. Diehl H, Lindstrom F (1959) Eriochrome black t and its calcium and magnesium derivatives. Anal Chem 31:414–418. https ://doi.org/10.1021/ ac601 47a02 6
14. Chriswell CD, Schilt AA (1975) New and improved techniques for apply-ing the mole ratio method to the identification of weak complexes in solution. Anal Chem 47:1623–1629
15. Nan Z, Chun-Xiang H (1993) Improved mole ratio method by dual-wave-length spectrophotometry. Analyst 118:1077. https ://doi.org/10.1039/ an993 18010 77
16. Mansour F, Danielson N (2012) Ligand exchange spectrophotometric method for the determination of mole ratio in metal complexes. Micro-chem J 103:74–78
17. Mabrouk M, Hammad SF, Abdelaziz MA, Mansour FR (2018) Determina-tion of etidronate in pharmaceutical formulaDetermina-tions by RP-HPLC method with indirect UV detection. Arab J Med Sci 1:1–4. https ://doi.org/10.5455/ ajms.7