Material plastic properties characterization by coupling experimental
and numerical analysis of small punch beam tests
Xingguo Zhou, Wenke Pan
⇑, Donald Mackenzie
Department of Mechanical Engineering, University of Strathclyde, Glasgow, UK
a r t i c l e
i n f o
Article history: Received 25 June 2012 Accepted 2 July 2012 Available online 31 July 2012
Keywords:
Small punch beam test
Plastic properties characterization Genetic algorithm
Finite element analysis
a b s t r a c t
A novel small punch beam testing (SPBT) system consisting of a top die, a bottom die and a flat punch with semi-circular cross-section head has been designed and tested. The specimen is a small beam with rectangular cross-section. This SPBT method has the advantage over conventional tensile testing for much less material required for testing and also over the traditional small punch testing because not only less material required but also high accuracy to make the punch head. Through coupling the numerical modelling and experimental results, genetic algorithm has been employed to successfully characterize the material plastic properties.
Ó2012 Elsevier Ltd. All rights reserved.
1. Introduction
The small punch testing (SPT) technique was developed to
char-acterize material properties in the late 1970s[1]. In the test, a
cylindrical punch with a hemispherical head deforms a thin disc shape specimen, which is clamped between two co-axial hollow cylindrical dies. The thickness of the sample can be as small as 0.5 mm or 0.25 mm and the diameter is about 6 to 10 mm. Com-parison of SPT results with conventional tensile testing (CTT) method is very encouraging. To date, material properties that have been evaluated by SPT include elastic modulus, plastic deformation
properties such as yield stress and tensile strength [1–5], creep
properties[6–8]and fracture properties[9–11], etc.
Several national associations have considered or are currently investigating testing standards for SPT. The Japan Atomic Energy Research Institute has produced practice recommendations for
small punch (SP) testing of metallic Materials in 1988[12]. CEN
published Small Punch Test Method for Metallic Materials Part A:
A Code of Practice for Small Punch Creep in 2005[13]and Part B:
A Code of Practice for Small Punch Testing for Tensile and Fracture
Behavior in 2006[14]. The American Society for Testing and
Mate-rials has issued a standard test method for small punch testing of ultra-high molecular weight polyethene used in surgical implants
in 2008[15]. The progress[16]of standardization of small punch
test in China was reported in 2010.
One practical advantage of SPT over conventional tensile testing is that the specimen size is relatively small and therefore only
small quantity of material is required for testing. This is particu-larly useful when testing material from operating plants for life extension programs, as the small amount of material required can often be removed from the surface of components without plant shutdown and intrusive welded repairs are not required afterwards. One disadvantage of SPT is the difficulty and expense of manufacturing the 2.5 mm diameter hemi-spherical head punch to the required dimensional accuracy. To overcome this problem, an alternative Small Punch Plane Strain (SPPS) test system with a cylindrical punch contact surface and rectangular test specimen
was proposed[17]. This has been successfully used to characterize
material’s plastic properties, with Ramberg–Osgood constitutive relationship employed. Recently, instead of using rectangular
spec-imens, Sehgal et. al[18]used miniature samples for their punch
tests. The yield strength and fracture toughness of die steel D3 and Chromium steel H11 were evaluated and compared with the values obtained from standard tests. Their simulated load-dis-placement curves were in good agreement with the results ob-tained experimentally, however, as the distance between the lower dies is just a little bit larger than the thickness of the speci-men the deformation in the specispeci-men is quite complex.
To characterize material properties using the small punch test-ing method, trial and error methods, a genetic algorithm method
[17]and neural network method[19], etc. have all been used. In
this paper, a small punch testing system based on a small beam shape specimen and punch similar to that of SPPS is presented. Material properties are evaluated from the deformation through comparison with multi-linear strain hardening Finite Element analysis of specimen deformation and a genetic algorithm utilizing a cost function based on the relative difference between the
0045-7949/$ - see front matterÓ2012 Elsevier Ltd. All rights reserved. http://dx.doi.org/10.1016/j.compstruc.2012.07.002
⇑ Corresponding author.
E-mail address:[email protected](W. Pan).
Contents lists available atSciVerse ScienceDirect
Computers and Structures
experimental and testing forces at the top centre of the beam. The small punch beam testing tool design will be presented in the
Sec-tion2, while experiment procedure will be given in Section3. FEM
modelling is presented in Section4, material property
character-ization using a genetic algorithm method in Section5and results
in Section6.
2. Small punch beam testing tool design
The standard small punch test (SPT) tool employs an upper and a lower hollow cylindrical shape die and a cylindrical punch with hemispherical punch head. To avoid the high cost and low accuracy for manufacturing hemispherical punch head, the new designed
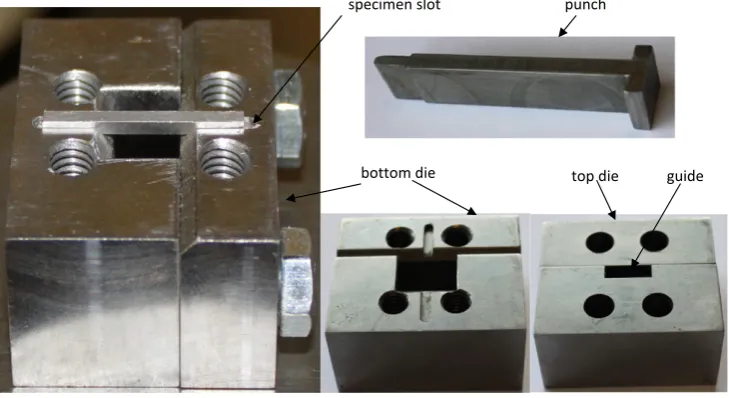
tool testing system shown inFig. 1has been developed. The tool
consists of top and bottom blocks, each having a narrow through slot. The test beam specimen is located in a shallow slot perpendic-ular to the through slot. The punch is a rectangperpendic-ular bar with a half-cylinder profile contact surface, overcoming the manufacturing dif-ficulties associated with a hemispherical punch. The radius of the punch head is 1.25 mm and the width of the punch is 8 mm. The
test specimen shown inFig. 2is a beam with rectangular cross
sec-tion with width of 2mm and height of 1.6 mm. The height of the beam is slightly greater than the depth of the shallow slot, such that when the four fixing screws are tightened the beam sample is fully clamped. The central part of the beam is 8 mm and an addi-tional 4 mm or more of material is included at both ends to hold
the beam. Chamfers with size 0.2 mm⁄45owere created on the
[image:2.595.306.549.69.124.2]bottom slot to avoid stress singularity. The four screws were tight-ened with same torque using a torque wrench to keep the top and bottom surfaces parallel. The punch is guided by the slot in the top block. The bottom block is made of two pieces, making the cham-ber easier to manufacture. The top and bottom blocks and punch are made of stainless steel, while the tested specimen is aluminium AA2024 with chemical composition in weight percentage shown in Table 1. The specimen material Young’s modulus and Poisson’s ra-tio are 73.1 GPa and 0.3, respectively. Lubricant was applied to the punch top surface and the side surface to reduce the friction be-tween the punch and specimen and punch and the top block slot.
3. Experiments
The small punch beam testing tool system was fitted to a Den-ison Mayes material testing machine and the force applied to the
punch and the displacement of the machine movement were re-corded. The maximum speed of the press head was set to 1 mm per minute; therefore, the strain rate of the specimen is small and dynamic effects are not considered. The test was terminated when the press head displacement reached 0.9 mm and then the press head was released.
The recorded force and displacement were the force applied onto the specimen and displacement of the central point on the beam top surface: friction, punch weight and the elastic deforma-tion of punch are assumed to be negligible. The typical punch
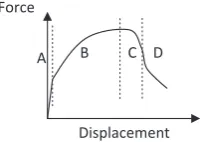
force-displacement is shown inFig. 3. The specimen initially
de-formed elastically in region A, followed by elastic and plastic defor-mation in region B. In region C, when large defordefor-mation occurs, damage is accumulated within the specimen and the material shows softening behavior with the total force decreasing. In the fi-nal region D, specimen fails as the critical crack length is reached.
4. FEM modelling
4.1. Geometry
The aim of the investigation is to characterize material plastic properties through the comparison between numerical and
exper-imental results. The Finite Element Method model shown inFig. 4
[image:2.595.303.552.186.233.2]consists of a specimen, a top block, a bottom block and a punch.
Fig. 1.Small punch beam test tool system.
Fig. 2.Specimen for small punch beam test.
Table 1
Chemical composition of AA2024 in Wt.%.
Component Al Mg Si Cr Mn
Wt.% 90.7–94.7 1.2–1.8 Max 0.5 Max 0.1 0.3–0.9
Component Ti Cu Zn Fe Other
[image:2.595.111.476.542.741.2]The ABAQUS/implicit finite element code was used for the simula-tion. The steel punch is treated as a rigid body as it is significantly stiffer than the aluminium test specimen. The top and bottom blocks were modelled as elastic bodies. The length between the two inner surfaces of the bottom block is 8mm and the width and the height of the beam cross section are 1.6 mm and 2 mm, respectively.
4.2. Material model
As the specimen is aluminium AA2024-T3, an oxide layer was formed on its surface when it was exposed to the atmosphere. As this oxide layer is very thin, its influence on the mechanical prop-erties of specimen was not considered. The multi-linear strain
hardening material model shown inFig. 5was used in the ABAQUS
numerical simulation, with S1, S2 and S3 representing the initial yield stress, proof stress (at 0.2% plastic strain) and ultimate tensile strength, respectively. The material will yield and plastic deforma-tion occurs when von Mises stress reaches the yield surface, which is assumed to be a function of equivalent plastic strain. The von
Mises stress
r
is represented asr
¼ffiffiffiffiffiffiffiffiffiffiffiffiffiffiffiffiffiffiffiffiffiffiffiffiffiffiffiffiffiffiffiffiffiffiffiffiffiffiffiffiffiffiffiffiffiffiffiffiffiffiffiffiffiffiffiffiffiffiffiffiffiffiffiffiffiffiffiffiffiffiffiffiffiffiffiffiffiffiffiffiffiffiffiffiffiffi
1
2½ðr1
r
2Þ 2þ ðr2
r
3Þ2
þ ðr3
r
1Þ2
r
ð1Þ
where
r
1,r
2andr
3are the principle stresses.4.3. Boundary conditions and loading
Both top block and bottom blocks were fully constrained. The punch is assumed to be a rigid body and a reference point assigned to it in ABAQUS, such that only this reference point is required to be constrained. The three rotation degrees of freedom and the two translation degrees of freedom within the horizontal plane were set to 0. The load applied to the specimen was replaced by vertical displacement control of the punch. The reaction force from the ABAQUS model corresponding to this constraint corresponds to the force applied to the specimen.
4.4. Contact and friction coefficient
Contact between the punch head and specimen top surface, specimen and top block and specimen and bottom block were con-sidered in the ABAQUS model. The influence of the friction coeffi-cient on the punch force versus the top surface middle point displacement was investigated. As lubricant was applied to punch top, the friction coefficient was assumed to be zero, while the fric-tion coefficient between the top block and specimen, bottom block and specimen were finally set at 0.3. The default penalty formula-tion in ABAQUS/Standard implicit codes was applied.
4.5. Mesh convergence
The ABAQUS three dimensional brick element C3D20R with re-duced integration was used in the analysis. Four discretisation
cases, as shown in Fig. 6(a) to (d), were investigated. The mesh
used in characterization of material properties by the Genetic Algo-rithm method was selected by considering the CPU requirements
and the accuracy of the analyses, as reported in Section6.2.
5. Material properties characterization using genetic algorithm method
The Genetic Algorithm (GA)[20]optimization method is based
on a simple natural rule: survival of the fittest. The fitter creatures will have more chances to survive and to produce off-spring. The GA method is applied to characterize the material nonlinear plastic parameters. The aim is to use the GA to search for the best values for a set of material parameters by comparing the finite element and experimental results. The total displacement is discretized
uniformly into ‘‘n’’ segments; therefore, without considering the
initial point, there are ‘‘n’’ values of displacementui(i= 1, 2,. . .,n)
and their corresponding force values areFi(i= 1, 2,. . .,n). However,
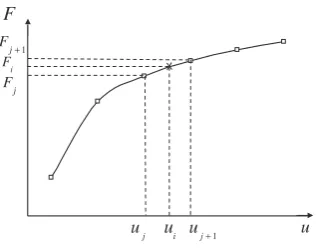
as the experimental and finite element method results may not fall exactly at the discretized displacement point, a linear interpolation method is used to obtain the corresponding force value. Shown in Fig. 7, assuminguifalls within the experimental or finite element
method consecutive pointsujanduj+1, the forceFicorresponding
touican be calculated as
Fi¼Fjþ
uiuj
ujþ1uj
ðFjþ1FjÞ ð2Þ
A flow chart of a general GA optimization procedure is given in Fig. 8. Eq.(3)shows the formulation of the objective function U, which is defined as the square root of the average of the summation of the square of the relative difference between the experimental and numerical results. The fitness is simply chosen as the inverse
of the objective function, i.e.f¼1
[image:3.595.118.220.67.138.2] [image:3.595.112.225.186.280.2]U Fig. 3.Typical small punch testing force vs. displacement curve.
[image:3.595.47.289.578.736.2]Fig. 4.FEM geometrical model.
U
¼ffiffiffiffiffiffiffiffiffiffiffiffiffiffiffiffiffiffiffiffiffiffiffiffiffiffiffiffiffiffiffiffiffiffiffiffiffiffiffiffiffi
1
n
Xn
i¼1
Fcal i F
exp i
Fexp i
!2
v u u
t ð3Þ
whereFexp
i andF cal
i are the experimental and finite element method
punch forces corresponding to theith displacementui. For this case,
the linear interpolation method was used.
Smaller values of the objective function correspond to the larger values of the fitness. The general GA procedure consists of initiali-zation, selection, crossover and mutation, with a higher fitness seed having more chance to be selected and one of the fittest off-spring at each generation always being kept. The GA procedure stops when the convergence criterion is satisfied.
One example of selection, cross over and mutation from gener-ation 0 to genergener-ation 1 of the GA method, is described as follows. As the material properties to be characterized are S1, S2 and S3, the range of their values are set at start. For initialization, S1, S2 and S3 are randomly assigned an integer from 0 to 255. At the start, chromosomes with the integers from 0 to 255 are represented as 8-digit binary strings. At iteration 0, there are 20 seeds for each set of S1, S2 and S3, and each seed can be linearly mapped to the
param-eters S1, S2 and S3 used in the FE models, as shown inFig. 9. These
20 seeds are ranked according to the objective function value cal-culated from the corresponding FE analysis: the seed with the smallest objective function ranks first, while the seed with the largest objective function ranks last. The selection operator is to delete the last seed for preparation of the next procedure cross over. The cross over procedure randomly selects a pair of seeds from seed numbers 1 to 18 and exchanges their genes at a random position. This procedure is continued until all seeds from seed
(a)
(b)
(c)
[image:4.595.121.465.65.258.2](d)
Fig. 6.FEM model with different mesh size near the beam center: (a) 0.4 mm, (b) 0.3 mm, (c) 0.2 mm and (d) 0.15 mm.
u
F
1 + j F
j F
j
u
u
iu
j+1 [image:4.595.80.239.310.434.2]i F
Fig. 7.displacements and their corresponding forces.
0 Φ Φ <
[image:4.595.144.442.561.738.2]number 1 to 18 are selected and crossed-over, giving new seeds numbered from 1 to 18. Finally, three seeds from 0 to 18 are ran-domly selected and mutated at random positions to obtain S1, S2
and S3 respectively and the newly generated seed is numbered as 19. 20 new seeds for the next iteration are then prepared.
6. Results
6.1. Experimental results
[image:5.595.53.285.65.169.2]Two tests were performed and the test results are shown in Fig. 10. Due to the accuracy of the testing machine, the testing re-sults fluctuate. However, from this figure, it can be seen clearly that the test results are quite consistent. In this paper, we aim to pres-ent a novel design and a GA method to characterize material plastic parameters; therefore, only the specimen 2 results were used for this purpose. To make the comparison easier, the average experi-mental results were compared with FEM results.
6.2. Finite element results
Fig. 6(a) to (d) show the meshes with element size of 0.4 mm,
0.3 mm, 0.2 mm and 0.15 mm for the central part of the beam.
Ta-ble 2displays the punch force corresponding to punch vertical dis-placement of 0.9 mm under different element size. The relative difference of the reaction force to the finest mesh is also shown in this table. From this table, it can be concluded that the model
with mesh size of 0.2 mm,Fig. 6(c), gives a good balance between
accuracy and CPU time and the results reported here were based on this mesh.
To investigate the influence of the friction coefficient on the punch force-displacement curve, different friction coefficients be-tween upper die and specimen and lower die and specimen were
assigned to the FE model. The simulation results are shown in
Ta-ble 3, from which it can be seen that the punch force increases with increasing of friction coefficient. By comparing these results, it is found that the maximum relative difference is less than 4.5%. In this paper, friction coefficient of 0.3 is used.
6.3. GA method results
Table 4shows the history of evolution of the minimum
objec-tive function Uof generation varying with iteration number. At
the beginning of the GA procedure, all seeds are randomly gener-ated and the lowest objective function value is 0.0817. The binary string for the best seed is [01011101], [01000100] and [00000011] and their corresponding S1, S2 and S3 values are 103.6 MPa,
239.8 MPa and 401.4 MPa. FromTable 4, it can be seen that
gener-Fig. 9.Mapping parameters from integers to real.
Force, N
[image:5.595.318.556.69.230.2]Displacement, mm
Fig. 10.The two experiment force vs. displacement results.
Table 2
Comparison of punch force at different mesh size.
Case 1 2 3 4
Mesh size (mm) 0.4 0.3 0.2 0.15
Force applied onto specimen (N) 455.12 495.428 500.601 500.398 Relative difference to the finest
mesh (case 4)%
[image:5.595.47.290.215.415.2]9.05 0.99 0.04 NA
Table 3
Influence of friction coefficient on the punch force at top surface middle point displacement of 0.85 mm.
Friction coefficient 0.1 0.2 0.3 0.4
Punch force, N 490.9 500.0 508.7 513.9
Table 4
Objective functionUvaries with iteration number.
Iteration No 0 5 10 15 20
Objective functionU 0.0817 0.0749 0.0731 0.0686 0.0612
0 100 200 300 400 500 600
0 0.2 0.4 0.6 0.8 1
Displacement, mm
P
u
n
c
h
f
o
rce,
N
Experimental results
Numerical results
[image:5.595.42.292.480.534.2] [image:5.595.42.292.607.629.2]ally the minimum value of the objective function decreases as the iteration number increases. The value of the minimum objective function will eventually reach a certain value, leading to the con-vergence of the GA. In this paper, after evolution of 20 generations,
the minimumUreaches 0.0612. The binary strings for this
gener-ation are [01011010], [00100010] and [11101010] and their corre-sponding S1, S2 and S3 values are 102.2 MPa, 219.9 MPa and 509 MPa respectively. The ultimate tensile strength is very close
to the 496 MPa report in Ref.[21].
Comparison of the experimental and finite element punch
force-displacement curves is shown inFig. 11, from which it can
be seen that the predicted results are in good agreement the exper-imental results.
After obtaining the material plastic parameters, the FEM sim-ulation results produced using the optimal parameters values
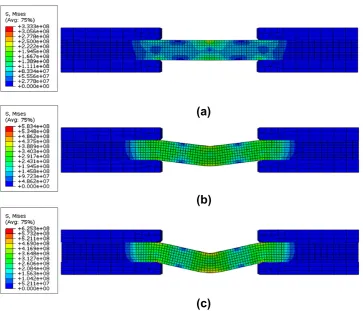
were re-investigated. Fig. 12(a) to (c) show the stress contours
at the top surface middle point displacement of 0.025 mm,
0.5 mm and 0.89 mm, respectively. From Fig. 12(a), it can be
seen that apart from the contact point between punch and spec-imen, the maximum stress was less than the 0.2% proof stress and the high stresses occurred in elements close to the middle points of the top and bottom surfaces. This shows the beam deformation behaviour. By checking the punch force versus spec-imen top surface middle point displacement, it is found that this stage corresponds to linear elastic deformation in the specimen. With higher punch force applied onto the specimen, the maxi-mum von Mises stress exceeded the yield stress and plastic
deformation developed in the specimen. From Fig. 12(b) and
(c), it is clear that the location of high stress in the elements ex-panded from the middle points of the top and bottom surfaces to the centre of the specimen and the areas near the bottom support regions also have high stresses.
7. Conclusions and future work
Based on the above results, it is concluded that:
(1) The novel small punch beam testing tool system presented has an advantage over conventional tensile testing in that much less sample material is required. It also has an advan-tage over the semispherical head small punch test, as the cylindrical shape punch head is much easier to manufacture with high accuracy and low cost.
(2) As the test specimen are smaller than the conventional SPT specimen, the same amount of material removed from an in-service component could make more specimens, or, to produce same number of specimens will require less mate-rial to be removed from components.
(3) The small punch beam testing results are consistent, making the testing method a suitable candidate method for material property characterization.
(4) The GA method has been successfully used to characterize the material plastic parameters. The calculated punch force–displacement results are in good agreement with experimental results.
For future work, beam specimens will be tested to failure and characterization of material damage parameters will be investi-gated. If this can be achieved it would enable numerical estimation of material fracture toughness. The beam dimensions could also be further reduced to thickness of 0.5 mm, width of around 1 mm and length of 6 to 8 mm. This will require less material compared to the beam specimens used in this research. Other methods, such as the neural network method, will also be used to characterize material property parameters.
(a)
(b)
[image:6.595.112.476.63.374.2](c)
Acknowledgements
The author Xingguo Zhou would like to thank the financial sup-port by Scottish Overseas Research Student Awards Scheme and University of Strathclyde.
References
[1] Manahan MP, Argon AS, Harling OK. The development of mininaturized disk bend test for the determination of postirradiation mechanical properties. Journal of Nuclear Materials 1981;103&104:1545–50.
[2] Egan Patrick, Whelan Maurice P, Lakestani Fereydoun, Connelly Michael J. Small punch test: an approach to csolve the inverse problem by deformation shaper and finite element optimization. Comput Mater Sci 2007;40:33–9. [3] Isselin J, Iost A, Golek J, Najjar D, Bigerelle M. Assessment of the conbstitutive
law by inverse methodology: small punch test and hardness. J Nucl Mater 2006;352:97–106.
[4] Steven M, Foulds Jude R, Jewett Charles W, Srivastav Sanjeev, Edidin Avram A. Validation of a small punch testing technique to characterize the mechanical behaviour of ultra-high-molecular-weight polyethylene. Biomaterials 1997;18:1659–63.
[5] Karthik V, Visweswaran P, Vijayraghavan A, Kasiviswanathan KV, Raj Baldev. Tensile-shear correlations obtained from shear punch test technique using a modified experimental approach. J Nucl Mater 2009;393(3):425–32. [6] Milicka Karel, Dobes Ferdonand. Small punch testing of P91 steel. Int J Pressure
Vessels Piping 2006;83:625–34.
[7] Kobayashi Ken-ichi, Tabuchi Masaaki, Stratford Gavin C. Creep Rupture life of welding components in P92 Ferritic steel using small punch creep test. Metal J 2010;LXIII:54–8.
[8] Blagoeva DT, Hurst RC. Application of the CEN (European Committee for Standardization) small punch creep testing code of practice to a representative repair welded P91 pipe. Mater Sci Eng 2009;A 510–511:219–223.
[9] Mao X, Takahashi H. Development of a further-miniaturized specimen of 3 mm diameter for tem disk small punch tests. J. Nucl Mater 1987;150:44–52. [10] Foulds J, Viswanathan R. Small punch testing for determining the material
toughness of low alloy steel components in service. J Eng Mater Technol 1994;116(4):457.
[11] Li Yingzhi, Hurst Roger, Matocha Karel, Cizek Peter, Blagoeva Darina. New approach to determine fracture toughness from the small punch test. Metal J 2010;LXIII:94–102.
[12] Takahashi H, Shoji T, Mao X, Hamaguchi Y, Misawa T, Saito M Oku T, Kodaira T, Fukaya, K Nishi H, Suzuki M. Recommended practice for small punch (SP) testing of metallic Materials, JAERI-M; September 1988: 88–172.
[13] CEN, Small punch test method for metallic materials. Part A: A Code of Practice for Small Punch Creep, 2005.
[14] CEN, Small punch test method for metallic materials. Part B: A Code of Practice for Small Punch Testing for Tensile and Fracture Behavior, 2006.
[15] ASTM F2183–02(2008) Standard test method for small punch testing of ultra-high molecular weight polyethylene used in surgical implants.
[16] Guan Kai-shu, Wang Zhi-wen, Xu Tong, Shou Bi-nan. Development of small punch test in China. Czech Metal J 2010;LXIII.
[17] Pan W, Boyle Jim, Ramlan Mohd, Dun Craig, Ismail Mohd, Hakoda Kenji. Selected for Czech Metallurgical Journal 2010; LXIII:174–9.
[18] Sehgal DK, Husain A, Pandey RK. The Rectangular Shaped Miniature Specimen to study the Mechanical Behavior of Materials. In: 2nd international conference on Mechanical and electronics engineering (ICMEE), vol. 1, Kyoto, 2010; 196–9.
[19] Abendroth M, Kuna M. Determination of deformation and failure properties of ductile materials by means of the small punch test and neural networks. Comput Mater Sci 2003;28:633–44.
[20] Castro CF, Antonio CAC, Sousa LC. Optimisation of shape and process parameters in metal forging using genetic algorithms. J Mater Process Technol 2004;146:356–64.