Accepted manuscript doi:
10.1680/jgele.18.00145
Accepted manuscript
As a service to our authors and readers, we are putting peer-reviewed accepted manuscripts (AM) online, in the Ahead of Print section of each journal web page, shortly after acceptance.
Disclaimer
The AM is yet to be copyedited and formatted in journal house style but can still be read and referenced by quoting its unique reference number, the digital object identifier (DOI). Once the AM has been typeset, an ‘uncorrected proof’ PDF will replace the ‘accepted manuscript’ PDF. These formatted articles may still be corrected by the authors. During the Production process, errors may be discovered which could affect the content, and all legal disclaimers that apply to the journal relate to these versions also.
Version of record
Accepted manuscript doi:
10.1680/jgele.18.00145
Submitted: 08 August 2018
Published online in ‘accepted manuscript’ format: 05 November 2018
Manuscript title: Revisiting Broms and Bennermarks’ Original Stability Number for Tunnel
Headings
Authors: Jim Shiau* and Fadhil Al-Asadi*
Affiliation: *School of Civil Engineering and Surveying, University of Southern
Queensland, QLD 4350, Australia
Corresponding author: Jim Shiau, School of Civil Engineering and Surveying, University
of Southern Queensland, QLD, 4350, Australia. Tel.: 61746312550.
Accepted manuscript doi:
10.1680/jgele.18.00145
Abstract
For undrained clay without volume loss during plastic shearing, stability results are independent of loading directions, and the combination of surcharge, self-weight and internal supporting pressures can produce failure either in collapse or blowout in tunnel stability problems. This paper investigates the use of Broms and Bennermark’s original stability number for tunnel heading problems. The shear strength reduction method is used to obtain rigorous upper bound and lower bound factors of safety for the models under different combinations of pressures. The factor of safetyresults, which are functions of the stability number and depth ratio, are compared and validated by using the finite difference method as well as other existing solutions available in the literature. The dimensionless ratios employed in this study make the design charts suitable to cover a broad range of tunnel geometries and soil parameters. The charts can also be used to provide an estimation of internal tunnelling pressures, making them useful for designers and practising engineers.
Accepted manuscript doi:
10.1680/jgele.18.00145
INTRODUCTION
The stabilility of tunnels and underground openings is most often described by the stability number (N) in Broms and Bennermark (1967). The stability number (N) is defined in the equation (1). s t u H N S
(1)
Where σs is the surcharge on the ground surface and σt is the internal tunnel pressure.H is the
depth of the tunnel axis that is equal to (C+D/2), C is the tunnel cover and D is the tunnel height. Su and γ represent the undrained shear strength and the unit weight of the soil
respectively (Fugure 1).
Following the bottom heave study of strutted excavations by Bjerrum and Eide (1956), it was concluded that failure occurs when the difference between the overburden pressure and the supporting pressure (σs + γH – σt) exceeds the undrained shear strength (Su) by six to eight
times. The value of “six to eight” is Broms and Bennermark’s critical stability number (Nc)
and it is dependent on the shape of the opening and the roughness of the vertical retaining wall. There was no mention of the depth ratio (C/D) effect on the critical stability number (Nc) in their study.
Built upon the earlier definition of Broms and Bennermark’s critical stability number (Nc),
Davis et al. (1980) approached the limit solutions of the problem using a pressure ratio ((σs –
σt)/Su) that is a function of independent parameters such as the depth ratio (C/D) and the
strength ratio (γD/Su), as indicated in equation 2.
,
s t
u u
C D f
S D S
(2)
Instead of using the original critical stability number, a large number of research papers have been published by presenting numerical results using equation (2) (Sloan and Assadi 1994, Augarde et al. 2003, Wilson et al. 2011 and Abbo et al. 2013).
A search of the literature reveals that very few studies used the original stability number (N) for blowout and collapse analyses. In this paper, the shear strength reduction method (SSRM) is used with the finite element limit anaysis (FELA) to obtain factors of safety (FoS) under different stability numbers (N) and depth ratios (C/D). The rigorous upper bound (UB) and lower bound (LB) results are validated using the finite difference (FD) solutions. These FoS results are used to produce comprehensive design charts for tunnel heading stability.
PROBLEM DEFINITION AND MODELLING TECHNIQUE
Figure 1 shows the problem definition of an idealised tunnel heading. The soil medium is considered as undrained and is modelled as a uniform Tresca material. The undrained shear strength (Su) and the unit weight (γ) describe soil properties used, while the tunnel has a
height (D) and cover depth (C) above its crown. The face of the heading is free to move and is subjected to a normal internal pressure σt, while the ground surface is subjected to a
vertical surcharge σs. These pressures, together with soil self-weight, are varied to test the
Accepted manuscript doi:
10.1680/jgele.18.00145
, s t
u H C
FoS f N
D S
(3)
The stability number N can be either positive, zero or negative, depending on the actual
input design parameters (σs , σt , γ, C, D, H and Su). Thus, to cover all possible scenarios of
failure, the present study investigates the stability of tunnel headings by relating FoS to
a broad range of stability numbers (N = -15 to 15) and depth ratios (C/D= 1 to 10). For
example, to generate a value of N = +5 for C/D = 3, the chosen parameters are σs = 0, σt
=153 kPa, γ= 18 kN/m3, C=18m, D=6m, H= 21m, and Su= 45 kPa.
The rigorous upper bound and lower bound factors of safety for the cases being studied are computed by using the shear strength reduction method (Krabbenhoft and Lyamin, 2015 and OptumG2, 2018). The adaptive mesh used in this study is shown in Figure 2. The numerical procedures used are based on the limit theorems of classical plasticity (Lyamin and Sloan 2002a and,2002b). Result verification is normally required in the computational research. For this purpose, the finite difference (FD) method, via the software FLAC with built-in
implementation of the strength reduction technique, has also been used over the same parametric range.
RESULTS AND DISCUSSION
A wide range of stability numbers (N = -15 to +15) and depth ratios (C/D =1 to 10) are investigated to cover all possible situations associated with tunnel heading stability. Figure 3 shows the full range of the results (LB, UB and FD) related to the collapse and blowout of a tunnel heading model with a depth ratio of three (C/D = 3). It can be seen that the curves are hyperbolic, and a pair of asymptote lines exist. The general equation for this graph was found to be Nc = N x FoS. Any combination of N and FoS on this curve yields a unique Nc value,
which is constant for a specific depth ratio. This Nc value is Broms and Bennermarks’
original critical stability number. For the depth ratio C/D = 3, LB solutions give Nc = +5.947
on the collapse side and Nc = -5.947 on the blowout side. Graphically, the two values can be
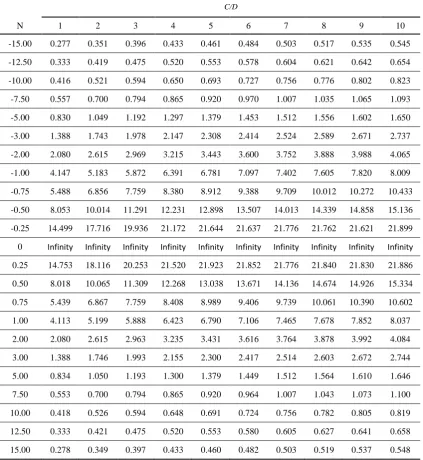
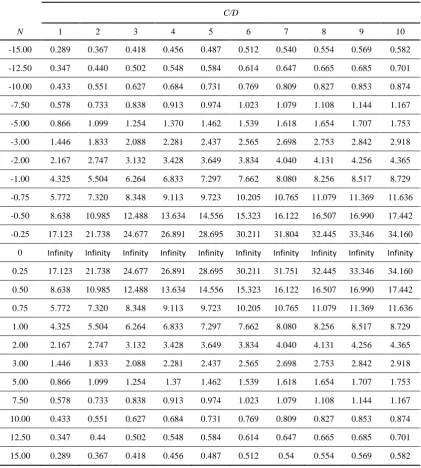
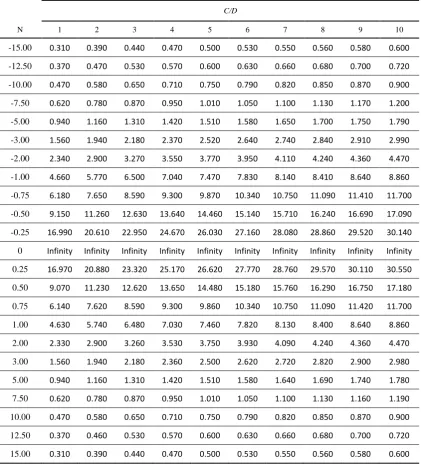
read from the intersection points by drawing a FoS = 1 horizontal line, as can be seen in Figure 3. A complete FoS results are presented in Tables 1 – 3.
Broms and Bennermarks’ stability number (N) consists of two parts: overburden pressure ratio (OPR = (σs +γH)/Su) and supporting pressure ratio (SPR = σt /Su). When the OPR is
equal to the SPR, N is equal to zero, and FoS is at a maximum (infinite). It is noted that a ‘weightless scenario’ exists on the asymptote line where the stability number is approaching zero and the factor of safety is at an infinite value.
When the OPR is larger than the SPR, N is greater than zero. The factor of safety (FoS) gradually decreases as N increases and the soil moves in the “collapse” direction. As N further increases, an incipient collapse is reached where FoS= 1 and the corresponding N is the critical Nc.
When the OPR is less than the SPR, N is less than zero. In this case, the soil moves in the
“blowout” direction. The factor of safety (FoS) gradually decreases as -N increases until
an incipient blowout is reached where FoS= 1. The corresponding -N is the critical -Nc
for blowout failure.
Broms and Bennermark’s original equation (1) can be re-arranged into a form that is more amenable to analysis, as shown in equation (4).
Accepted manuscript doi:
10.1680/jgele.18.00145
Using equation (4), a critical supporting pressure σt can be determined as long as Nc (where
FoS = 1) is known. Note that Nc is a function of the depth ratio C/D regardless of the
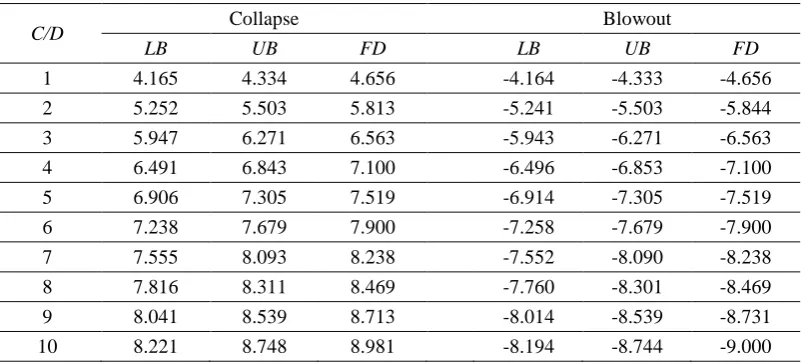
undrained shear strength of the soil. It isimportant to study the effect of C/D on the critical stability number Nc. Figure 4 shows such a relationship between Nc and C/D. The data used
to prepare this figure is shown in Table 4. In Figure 4, the critical stability number (Nc)
increases nonlinearly as C/D increases, and the gradient of the curve decreases for large values of Nc. The area bounded by the collapse and the blowout curves represents the safe
zone where FoS > 1. As the stability number (N) approaches zero (OPR = SPR), the factor of safety becomes infinite.
In general, the finite difference results for the critical stability number Nc are always larger
than the upper bound and lower bound results. It appears that the finite difference approach for this problem is not conservative and the exact solution is somewhere between the limits of the LB and the UB. Since the lower bound theorem offers a safe assessment of the limit pressure for a stability problem, the computed lower bound solutions were chosen for the regression analysis. Equation 5 is an accurate curve-fitting for the relationship between Nc
and C/D with a correlation coefficient r2 = 0.998.
1.79 ln ( / ) 4.06 c
N C D (5)
Substituting equation (5) into equation (4), a critical supporting pressure σt can be computed
using equation (6) with known design parameters such as σs, γ, H, Suand C/D. [1.79 ln ( / ) 4.06 ]
t s H C D Su
(6)
Noting that Nc = N x FoS (Figure 3), a factor of safety can always be computed using
equation (7).
/
c
FoS
N
N
(7)Where N is the “designed” stability number which consists of the following design parameters: σs, σt, γ, H, and Su . Equation (7) is further arranged into the form shown in
equation (8) by substituting Nc from equation (5). 1.79 ln(C D/ ) 4.06
FoS
N
(8)
Equation (8) can be further expanded to equation (9) for collapse analysis, noting that N =(σs
-σt +γH)/Su.
[1.79 ln ( / ) 4.06]
s t
u
C D S
FoS
H
(9)
And equation (10) is used for blowout analysis by substituting the negative value of Nc.
[1.79 ln ( / ) 4.06]
s t
u
C D
S
FoS
H
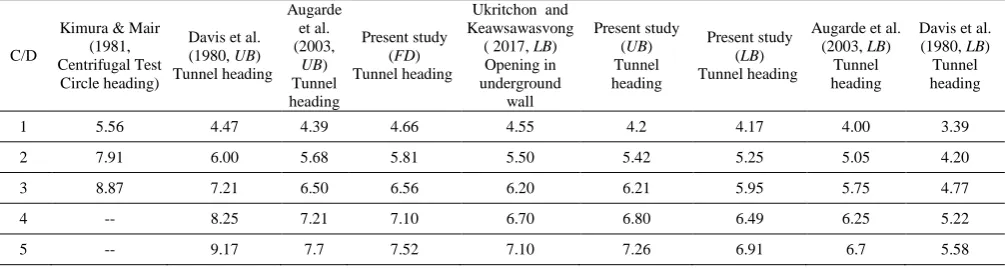
(10) Figure 5 shows a comparison of Nc results. Good agreement was found between this studyand other published solutions (Augarde et al. 2003, Ukritchon and Keawsawasvong 2017). The current UB and LB solutions have been significantly improved owing to the use of adaptive mesh in this paper. It is not surprising to see that the analytical LB yields
Accepted manuscript doi:
10.1680/jgele.18.00145
STABILITY CHART AND PRACTICAL EXAMPLES
The design chart is best demonstrated through some examples which can be broadly
categorised into either analysis or design problems. Since the lower bound theorem offers a safe assessment of the critical stability number, a design contour chart for factors of safety (FoS) has been constructed in Figure 6 based on LB results.
Face support for TBM excavation.
It is proposed to use a TBM to excavate a deep tunnel below the central business district through undrained clay. The designer needs to determine the safe operating range for tunnel face support pressure (σt) provided by the TBM. The given parameters are; σs= 216 kPa, Su =
72 kPa, γ = 18 kN/m3, C = 36 m, and D = 6 m.
1. Given C/D = 6, Nc ≈ 7.24 for LB collapse and Nc ≈ – 7.26 for LB blowout (Table 4 or
Figure 4 or equation (5)).
2. Using equation (9), σt = 394.76 kPa (FoS =1, for collapse, LB).
3. Using equation (10), σt = 1441.24 kPa (FoS =1, for blowout, LB).
4. The safe operating range (FoS ≥ 1) for tunnel face support pressure is: 394.76 kPa (collapse limit) ≤ σt ≤ 1441.24 kPa (blowout limit)
5. Depending on the FoS used in design considerations, this operating range can be further reduced.
6. Using equation (9) with FoS =2.5, σt = 708.70 kPa for collapse side.
7. Using equation (10) with FoS =2.5, σt = 1127.30 kPa for blowout side.
8. The safe operating range for FoS ≥ 2.5 is:
Accepted manuscript doi:
10.1680/jgele.18.00145
CONCLUSION
Broms and Bennermarks’ original stability number combines overburden pressures
Accepted manuscript doi:
10.1680/jgele.18.00145
REFERENCES
Abbo, AJ, Wilson, DW, Sloan, SW & Lyamin, AV 2013, 'Undrained stability of wide rectangular tunnels', Computers and Geotechnics, vol. 53, pp. 46-59.
Augarde, CE, Lyamin, AV & Sloan, SW 2003, 'Stability of an undrained plane strain heading revisited', Computers and Geotechnics, vol. 30, no. 5, pp. 419-30.
Bjerrum, L & Eide, O 1956, 'Stability of strutted excavations in clay', Geotechnique, vol. 6, no. 1, pp. 32-47.
Broms, BB & Bennermark, H 1967, 'Stability of clay at vertical openings', Journal of Soil Mechanics & Foundations Div, vol. 93, p. 71.
Davis, EH, Gunn, MJ, Mair, RJ & Seneviratine, HN 1980, 'The stability of shallow tunnels and underground openings in cohesive material', Geotechnique, vol. 30, no. 4, pp. 397-416.
Kimura, T & Mair, R 1981, 'Centrifugal testing of model tunnels in soft clay', in Proceedings of the 10th International Conference on Soil Mechanics and Foundation Engineering Rotterdam : A.A. Balkema, 1981., Stockholm, pp. 319-22.
Krabbenhoft, K & Lyamin, AV 2015, 'Strength reduction finite-element limit analysis', Géotechnique Letters, vol. 5, no. 4, pp. 250-3.
Lyamin, AV & Sloan, SW 2002a, 'Upper bound limit analysis using linear finite elements and non-linear programming', International Journal for Numerical and Analytical Methods in Geomechanics, vol. 26, no. 2, pp. 181-216.
Lyamin, AV & Sloan, SW 2002b, 'Lower bound limit analysis using non-linear
programming', International Journal for Numerical Methods in Engineering, vol. 55, no. 5, pp. 573-611.
OptumG2, 2018, Optum Computational Engineering, https://optumce.com/
Sloan, SW 2013, 'Geotechnical stability analysis', Geotechnique, vol. 63, no. 7, p. 531.
Sloan, SW & Assadi, A 1994, 'Undrained stability of a plane strain heading', Canadian Geotechnical Journal, vol. 31, no. 3, pp. 443-50.
Ukritchon, B & Keawsawasvong, S 2017, 'Design equations for undrained stability of opening in underground walls', Tunnelling and Underground Space Technology, vol. 70, pp. 214-20.
Accepted manuscript doi:
10.1680/jgele.18.00145
Table 1 FoS results for various values of C/D and N (LB, Collapse and Blowout).
C/D
N 1 2 3 4 5 6 7 8 9 10
-15.00 0.277 0.351 0.396 0.433 0.461 0.484 0.503 0.517 0.535 0.545
-12.50 0.333 0.419 0.475 0.520 0.553 0.578 0.604 0.621 0.642 0.654
-10.00 0.416 0.521 0.594 0.650 0.693 0.727 0.756 0.776 0.802 0.823
-7.50 0.557 0.700 0.794 0.865 0.920 0.970 1.007 1.035 1.065 1.093
-5.00 0.830 1.049 1.192 1.297 1.379 1.453 1.512 1.556 1.602 1.650
-3.00 1.388 1.743 1.978 2.147 2.308 2.414 2.524 2.589 2.671 2.737
-2.00 2.080 2.615 2.969 3.215 3.443 3.600 3.752 3.888 3.988 4.065
-1.00 4.147 5.183 5.872 6.391 6.781 7.097 7.402 7.605 7.820 8.009
-0.75 5.488 6.856 7.759 8.380 8.912 9.388 9.709 10.012 10.272 10.433
-0.50 8.053 10.014 11.291 12.231 12.898 13.507 14.013 14.339 14.858 15.136
-0.25 14.499 17.716 19.936 21.172 21.644 21.637 21.776 21.762 21.621 21.899
0 Infinity Infinity Infinity Infinity Infinity Infinity Infinity Infinity Infinity Infinity
0.25 14.753 18.116 20.253 21.520 21.923 21.852 21.776 21.840 21.830 21.886
0.50 8.018 10.065 11.309 12.268 13.038 13.671 14.136 14.674 14.926 15.334
0.75 5.439 6.867 7.759 8.408 8.989 9.406 9.739 10.061 10.390 10.602
1.00 4.113 5.199 5.888 6.423 6.790 7.106 7.465 7.678 7.852 8.037
2.00 2.080 2.615 2.963 3.235 3.431 3.616 3.764 3.878 3.992 4.084
3.00 1.388 1.746 1.993 2.155 2.300 2.417 2.514 2.603 2.672 2.744
5.00 0.834 1.050 1.193 1.300 1.379 1.449 1.512 1.564 1.610 1.646
7.50 0.553 0.700 0.794 0.865 0.920 0.964 1.007 1.043 1.073 1.100
10.00 0.418 0.526 0.594 0.648 0.691 0.724 0.756 0.782 0.805 0.819
12.50 0.333 0.421 0.475 0.520 0.553 0.580 0.605 0.627 0.641 0.658
Accepted manuscript doi:
10.1680/jgele.18.00145
Table 2 FoS results for various values of C/D and N (UB, Collapse and Blowout).
C/D
N 1 2 3 4 5 6 7 8 9 10
-15.00 0.289 0.367 0.418 0.456 0.487 0.512 0.540 0.554 0.569 0.582
-12.50 0.347 0.440 0.502 0.548 0.584 0.614 0.647 0.665 0.685 0.701
-10.00 0.433 0.551 0.627 0.684 0.731 0.769 0.809 0.827 0.853 0.874
-7.50 0.578 0.733 0.838 0.913 0.974 1.023 1.079 1.108 1.144 1.167
-5.00 0.866 1.099 1.254 1.370 1.462 1.539 1.618 1.654 1.707 1.753
-3.00 1.446 1.833 2.088 2.281 2.437 2.565 2.698 2.753 2.842 2.918
-2.00 2.167 2.747 3.132 3.428 3.649 3.834 4.040 4.131 4.256 4.365
-1.00 4.325 5.504 6.264 6.833 7.297 7.662 8.080 8.256 8.517 8.729
-0.75 5.772 7.320 8.348 9.113 9.723 10.205 10.765 11.079 11.369 11.636
-0.50 8.638 10.985 12.488 13.634 14.556 15.323 16.122 16.507 16.990 17.442
-0.25 17.123 21.738 24.677 26.891 28.695 30.211 31.804 32.445 33.346 34.160
0 Infinity Infinity Infinity Infinity Infinity Infinity Infinity Infinity Infinity Infinity
0.25 17.123 21.738 24.677 26.891 28.695 30.211 31.751 32.445 33.346 34.160
0.50 8.638 10.985 12.488 13.634 14.556 15.323 16.122 16.507 16.990 17.442
0.75 5.772 7.320 8.348 9.113 9.723 10.205 10.765 11.079 11.369 11.636
1.00 4.325 5.504 6.264 6.833 7.297 7.662 8.080 8.256 8.517 8.729
2.00 2.167 2.747 3.132 3.428 3.649 3.834 4.040 4.131 4.256 4.365
3.00 1.446 1.833 2.088 2.281 2.437 2.565 2.698 2.753 2.842 2.918
5.00 0.866 1.099 1.254 1.37 1.462 1.539 1.618 1.654 1.707 1.753
7.50 0.578 0.733 0.838 0.913 0.974 1.023 1.079 1.108 1.144 1.167
10.00 0.433 0.551 0.627 0.684 0.731 0.769 0.809 0.827 0.853 0.874
12.50 0.347 0.44 0.502 0.548 0.584 0.614 0.647 0.665 0.685 0.701
Accepted manuscript doi:
10.1680/jgele.18.00145
Table 3 FoS results for various values of C/D and N (FD, Collapse and Blowout).
C/D
N 1 2 3 4 5 6 7 8 9 10
-15.00 0.310 0.390 0.440 0.470 0.500 0.530 0.550 0.560 0.580 0.600
-12.50 0.370 0.470 0.530 0.570 0.600 0.630 0.660 0.680 0.700 0.720
-10.00 0.470 0.580 0.650 0.710 0.750 0.790 0.820 0.850 0.870 0.900
-7.50 0.620 0.780 0.870 0.950 1.010 1.050 1.100 1.130 1.170 1.200
-5.00 0.940 1.160 1.310 1.420 1.510 1.580 1.650 1.700 1.750 1.790
-3.00 1.560 1.940 2.180 2.370 2.520 2.640 2.740 2.840 2.910 2.990
-2.00 2.340 2.900 3.270 3.550 3.770 3.950 4.110 4.240 4.360 4.470
-1.00 4.660 5.770 6.500 7.040 7.470 7.830 8.140 8.410 8.640 8.860
-0.75 6.180 7.650 8.590 9.300 9.870 10.340 10.750 11.090 11.410 11.700
-0.50 9.150 11.260 12.630 13.640 14.460 15.140 15.710 16.240 16.690 17.090
-0.25 16.990 20.610 22.950 24.670 26.030 27.160 28.080 28.860 29.520 30.140
0 Infinity Infinity Infinity Infinity Infinity Infinity Infinity Infinity Infinity Infinity
0.25 16.970 20.880 23.320 25.170 26.620 27.770 28.760 29.570 30.110 30.550
0.50 9.070 11.230 12.620 13.650 14.480 15.180 15.760 16.290 16.750 17.180
0.75 6.140 7.620 8.590 9.300 9.860 10.340 10.750 11.090 11.420 11.700
1.00 4.630 5.740 6.480 7.030 7.460 7.820 8.130 8.400 8.640 8.860
2.00 2.330 2.900 3.260 3.530 3.750 3.930 4.090 4.240 4.360 4.470
3.00 1.560 1.940 2.180 2.360 2.500 2.620 2.720 2.820 2.900 2.980
5.00 0.940 1.160 1.310 1.420 1.510 1.580 1.640 1.690 1.740 1.780
7.50 0.620 0.780 0.870 0.950 1.010 1.050 1.100 1.130 1.160 1.190
10.00 0.470 0.580 0.650 0.710 0.750 0.790 0.820 0.850 0.870 0.900
12.50 0.370 0.460 0.530 0.570 0.600 0.630 0.660 0.680 0.700 0.720
Accepted manuscript doi:
10.1680/jgele.18.00145
Table 4 – Comparison of Nc results (FoS = 1) in collapse and blowout.
C/D Collapse Blowout
LB UB FD LB UB FD
1 4.165 4.334 4.656 -4.164 -4.333 -4.656
2 5.252 5.503 5.813 -5.241 -5.503 -5.844
3 5.947 6.271 6.563 -5.943 -6.271 -6.563
4 6.491 6.843 7.100 -6.496 -6.853 -7.100
5 6.906 7.305 7.519 -6.914 -7.305 -7.519
6 7.238 7.679 7.900 -7.258 -7.679 -7.900
7 7.555 8.093 8.238 -7.552 -8.090 -8.238
8 7.816 8.311 8.469 -7.760 -8.301 -8.469
9 8.041 8.539 8.713 -8.014 -8.539 -8.731
Accepted manuscript doi:
10.1680/jgele.18.00145
Table 5 – Comparison of Nc with published solutions.
C/D
Kimura & Mair (1981, Centrifugal Test
Circle heading)
Davis et al. (1980, UB) Tunnel heading Augarde et al. (2003, UB) Tunnel heading Present study (FD) Tunnel heading
Ukritchon and Keawsawasvong
( 2017, LB) Opening in underground wall Present study (UB) Tunnel heading Present study (LB) Tunnel heading
Augarde et al. (2003, LB)
Tunnel heading
Davis et al. (1980, LB) Tunnel heading
1 5.56 4.47 4.39 4.66 4.55 4.2 4.17 4.00 3.39
2 7.91 6.00 5.68 5.81 5.50 5.42 5.25 5.05 4.20
3 8.87 7.21 6.50 6.56 6.20 6.21 5.95 5.75 4.77
4 -- 8.25 7.21 7.10 6.70 6.80 6.49 6.25 5.22
5 -- 9.17 7.7 7.52 7.10 7.26 6.91 6.7 5.58
Figure captions
Figure 1 Problem Definition.
Figure 2 A typical adaptive mesh used for the problem.
Figure 3 FoS vs. N for a depth ratio C/D = 3.
Figure 4 Critical stability number Nc (FoS = 1) in collapse and blowout.
Figure 5 Comparison of Nc with published solutions.