Constant Rate of Momentum Change Ejector:
Simulation, Experiments and Flow Visualisation
A thesis submitted by
Mohamed Alsafi, M Eng
For the award of
Doctor of Philosophy
Abstract
An ejector is a momentum-transfer device that requires no external mechanical input
or moving parts. However, ejectors have low performance due to irreversibilities such
as viscous losses and shocks in the primary stream and diffuser. It has previously been
argued that by maintaining a constant rate of momentum change along the ejector
duct, shock losses could be eliminated or at least minimised, and so the Constant Rate
of Momentum Change (CRMC) ejector was introduced. The CRMC configuration
appears to have significant potential, but the CRMC design prescription relies on: (1)
an arbitrary choice for the constant rate of momentum change along the length of the
duct; and (2) complete mixing between primary and secondary streams at the entrance
to the duct. This thesis investigates the themes of shock losses and mixing within a
CRMC ejector using physical experiments and computational simulation.
The CRMC ejector duct and the primary nozzle were manufactured using 3D
print-ing technology and then an experimental test bench usprint-ing air as the workprint-ing fluid
was assembled and successfully tested. The primary nozzle had a throat diameter of
3.2 mm and an exit diameter of 13.6 mm; the CRMC duct had a throat diameter of
25.48 mm. Extensive experimental tests were carried out for primary pressure between
200 kPa and 270 kPa, and secondary pressure between 0.6 kPa and 5 kPa. The results
demonstrate the primary nozzle exit position within the entrainment region has a
lim-ited effect on the ejector performance in terms of the entrainment ratio and critical
back pressures. A gas dynamic model was used to compare the performance of the
present CRMC ejector with different ejector profiles (both conventional and CRMC)
working with different fluids. The CRMC ejector showed a slightly better performance
ii
present CRMC ejector were compared with a conventional ejector at a similar
oper-ating condition, the total pressure of the CRMC ejector remained 15 % larger than
the conventional ejector but this higher performance was due to different primary
flow shock structures, not due to improvements in the compression process within the
diffuser. Differences in the primary flow structure are thought to be caused by the
different contraction angle of the secondary flow area. Higher entrainment ratio and
compression ratio were simulated for the CRMC ejector relative to the conventional
ejector but were not as high as expected from the CRMC design.
To investigate the mixing of the flow within the CRMC ejector, a laser-based
visualisa-tion technique was developed. A transparent CRMC ejector test secvisualisa-tion was designed,
fabricated, and operated in the ejector system using air as the working fluid. The
laser-based flow visualisation used a laser light beam of diameter of 1 mm to
illumi-nate the seeded secondary flow and thus, the unmixed primary flow was defined. The
wall static pressure of the seeded flow agrees well with that of the unseeded flow which
indicates that the seeding has a very small effect on the flow. Analysis of the
im-ages by digital image processing tools enabled identification of the jet core flow length
which was found to lie between 65 mm and 95 mm from the nozzle exit at the selected
operating conditions.
The primary and secondary flows entering the CRMC duct are certainly not fully
mixed as assumed in the CRMC design prescription. Furthermore, enhancement of
the distribution of the wall static pressure and centreline total pressure is not directly
attributable to the CRMC prescription. The modest performance improvements
as-sociated with the present CRMC design relative to the performance of a conventional
duct should be balanced against the added complexity associated with manufacturing
Certification of Thesis
This thesis is entirely the work of Mohamed Al-Safi except where otherwise
acknowl-edge. The work is original and has not previously been submitted for any other award,
except where acknowledged.
Student and supervisors signatures of endorsement are held at USQ.
David Buttsworth
Principal Supervisor
Ray Malpress
Acknowledgments
My deepest gratitude goes first and foremost to my supervisors Professor David
Buttsworth and Dr Ray Malpress, for their constant encouragement and guidance.
They have walked me through all the stages of the writing of this thesis. Without
their consistent and illuminating instruction, this thesis could not have reached its
present form. Their guidance is of great value to me for helping me so much in
build-ing the experimental apparatus and analysbuild-ing the results.
My thanks also goes to Dr Ahmed Sharrifian for his support. I would like to thank Dr
Khalid Saleh for his technical support. I would like to express my gratitude to all those
who helped me during the development of this thesis, including the workshop staff and
library staff. I would also like to express my gratitude to the fellow lab members who
were of so much help in conducting the experiments and providing deep insights and
a comfortable environment.
No words can express my gratitude to my family for their support from the time of
inception of my dream to the day it was fulfilled. I would also like to acknowledge
many who helped me with the thesis both academically and emotionally. I would like
to state my deep appreciation for all my friends and colleagues: their friendship and
advice were much appreciated. I would like to thank the Ministry of Higher Education
in Iraq for this opportunity to accomplish the Doctor of Philosophy degree. Finally, I
would also like to thank the Australian Commonwealth Government’s contribution to
the program fees and for the opportunity to complete my PhD research at USQ.
Contents
Abstract i
Acknowledgments iv
List of Figures xiv
List of Tables xxviii
Chapter 1 Introduction 1
1.1 Ejector history and applications . . . 1
1.2 Ejector operation . . . 2
1.3 Constant rate momentum change design . . . 4
1.4 Design optimisation . . . 4
1.5 Scope of study . . . 5
1.6 Overview of the Dissertation . . . 6
2.2 Ejector analytical models . . . 8
2.3 Operating conditions . . . 10
2.4 Nozzle design . . . 12
2.5 Nozzle exit position . . . 18
2.6 Variable geometry ejectors . . . 22
2.7 CRMC Ejectors . . . 25
2.8 Computational fluid dynamics simulations . . . 31
2.9 Flow visualization studies . . . 35
2.10 Chapter Summary . . . 39
Chapter 3 CRMC Ejector theory and design 41 3.1 Introduction . . . 41
3.2 Theory description . . . 42
3.3 CRMC ejector profile . . . 45
3.4 Analytical study . . . 49
3.5 Chapter Summary . . . 52
Chapter 4 Apparatus design 53 4.1 Introduction . . . 53
4.2 Apparatus layout . . . 54
viii CONTENTS
4.4 Primary flow line . . . 59
4.5 Secondary flow . . . 61
4.6 Secondary inlet . . . 63
4.7 CRMC ejector duct manufacturing . . . 64
4.8 Measurement arrangement . . . 66
4.8.1 Flow meters . . . 66
4.8.2 Pressure transducers . . . 67
4.8.3 Thermocouples . . . 69
4.9 Data acquisition . . . 70
4.10 Chapter summary . . . 70
Chapter 5 Preliminary tests 72 5.1 Chapter Overview . . . 72
5.2 Flow facility . . . 72
5.3 Preliminary test . . . 78
5.3.1 Setting operating conditions . . . 78
5.3.2 Effect of the nozzle exit position on the ejector performance . . . 80
5.3.3 System stability . . . 81
5.3.4 System repeatability . . . 83
5.4 Uncertainty analysis . . . 85
5.6 Chapter Summary . . . 88
Chapter 6 Results, analysis and discussion 90 6.1 Introduction . . . 90
6.2 Operating conditions . . . 91
6.3 Primary pressure effect . . . 93
6.4 Nozzle position effect . . . 97
6.5 Secondary pressure effect . . . 103
6.5.1 On entrainment ratio . . . 103
6.5.2 On achievable back pressure . . . 104
6.6 Wall static pressure . . . 106
6.7 Comparison with previous work . . . 109
6.7.1 Comparison with gas dynamic model . . . 109
6.7.2 Assessment of the validity of the Gas Dynamic Model . . . 112
6.7.3 Comparison of CRMC steam ejectors with the Gas Dynamic Model116 6.7.4 Comparison of CRMC air ejectors with gas Dynamic Model . . . 117
6.8 Chapter Summary . . . 119
Chapter 7 Computational fluid dynamic analysis 122 7.1 Introduction . . . 122
x CONTENTS
7.2.1 Turbulence model k-epsilon . . . 123
7.2.2 Turbulence model sst-k-omega . . . 124
7.3 Dimensionless wall distance . . . 125
7.4 Computational simulation . . . 126
7.4.1 Solution convergence . . . 127
7.4.2 Ejector geometry . . . 127
7.4.3 Boundary conditions . . . 128
7.5 Validation of simulation . . . 129
7.5.1 Static pressure: variation with grid density . . . 129
7.5.2 Static pressure: variation with turbulence model . . . 131
7.5.3 Entrainment ratio: variation with grid density . . . 132
7.5.4 Entrainment ratio: variation with turbulence model . . . 133
7.5.5 Summary . . . 135
7.6 Experimental-theoretical-CFD comparison . . . 136
7.6.1 Variation of entrainment ratio . . . 136
7.6.2 Variation of wall static pressure . . . 138
7.6.3 Variation of Mach number . . . 141
7.6.4 Variation of primary pressure . . . 142
7.6.5 Ejector flow modes . . . 146
7.7.1 Arrangement of conventional ejector . . . 150
7.7.2 Total pressure . . . 152
7.7.3 Critical back pressure comparison . . . 154
7.8 Chapter Summary . . . 156
Chapter 8 Flow Visualisation 159 8.1 Introduction . . . 159
8.2 System main components . . . 160
8.2.1 Transparent duct . . . 160
8.2.2 High speed camera . . . 163
8.2.3 Seeding system . . . 164
8.3 Experimental set up . . . 167
8.4 Operating procedures . . . 170
8.5 Experimental results . . . 171
8.6 Core flow length . . . 183
8.7 Chapter Summary . . . 187
Chapter 9 Conclusion and recommendation 189 9.1 Conclusions . . . 189
9.1.1 CRMC ejector . . . 189
xii CONTENTS
9.1.3 Flow visualization . . . 191
9.2 Summary and future work . . . 192
References 194 Appendix A 203 A.1 Primary nozzle . . . 203
A.2 Primary nozzle holder . . . 204
A.3 Spider . . . 205
A.4 Secondary flow pipe . . . 206
A.5 Orifice plate . . . 207
A.6 Entrainment section . . . 209
A.7 Connection section . . . 210
A.8 Condenser pipe . . . 211
A.9 CRMC ejector part 1 . . . 212
A.10 CRMC ejector part 2 . . . 213
A.11 CRMC ejector part 3 . . . 214
A.12 CRMC ejector part 4 . . . 215
A.13 CRMC ejector part 5 . . . 216
A.14 CRMC ejector part 6 . . . 217
B.1 Pressure transducer calibration . . . 218
B.2 Flow meter calibration . . . 221
List of Figures
1.1 Flow characteristics in a conventional gas or vapour ejector. . . 3
2.1 Schematic illustration of operation modes and variation of entrainment
ratio with the condenser pressure from the work of Pridasawas (2006). . 11
2.2 Variation of system COP with the condensing temperature at different
generator temperatures from the work of Dong, Chen, Wang, Kang &
Ma (2017). . . 12
2.3 Conical and petal nozzles geometry from the work of Chang & Chen
(2000). . . 13
2.4 Effective area and expansion angle in the mixing chamber from the work
of Chunnanond & Aphornratana (2004). . . 14
2.5 Lobed nozzle geometry from the work of Opgenorth, Sederstrom,
Mc-Dermott & Lengsfeld (2012). . . 15
2.6 Different nozzle shapes computationally tested by Yang, Long & Yao
(2012). . . 16
2.7 Conventional and chevron nozzle used by Kong, Jin, Setoguchi & Kim
2.8 Variation of entrainment ratio with ratio of outlet diameter to the nozzle
throat, γd, from the work of Fu, Li, Liu, Wu & Wu (2016). . . 18
2.9 Adjustable nozzle exit position in the conventional ejector from work of
Aphornratana & Eames (1997). . . 19
2.10 Effect of the nozzle exit position on conventional steam ejector
perfor-mance for primary pressure of 270 kPa and temperature of 130◦C and
range of evaporator temperatures from the work of Al-Doori (2013). . . 20
2.11 Effect of nozzle exit position on the conventional steam ejector
perfor-mance from the work of Dong, Ma & Guo (2013). . . 21
2.12 Schematic of a variable area ejector from the work of Kim, Lee,
Se-toguchi & Matsuo (2006). . . 23
2.13 Configuration of steam ejector with spindle (Ma, Zhang, Omer & Riffat
2010). . . 24
2.14 Profile of the CRMC ejector duct from the work of Eames (2002). . . . 26
2.15 Pressure and Mach number variation for CRMC ejector from the work
of Eames (2002). . . 27
2.16 Profile of the convergent-divergent throat jet-pump from the work of
Worall (2001). . . 28
2.17 Velocity profile along the CRMC and CPM ejector axis from the work
of Seehanam, Pianthong, Behnia, Chunnanond & Aphornratana (2007). 28
2.18 Performance comparison of conventional and CRMC ejectors at different
boiler temperatures from work of Chandra & Ahmed (2014). . . 29
2.19 Ejector geometry and movable primary nozzle from the work of Milazzo,
xvi LIST OF FIGURES
2.20 Improved CRMC ejector geometry and its movable primary nozzle from
the work of Mazzelli & Milazzo (2015). . . 30
2.21 Filled contour of Mach number: effect of the condenser pressure on
the ejector performance from the work of Sriveerakul, Aphornratana &
Chunnanond (2007). . . 32
2.22 Variation of entrainment ratio with compression ratio for two CFD
tur-bulence models with comparison to experimental data from the work of
Hemidi, Henry, Leclaire, Seynhaeve & Bartosiewicz (2009). . . 33
2.23 Effect of converging duct angle on the contours of Mach number for
primary pressure of 2.66 bar and secondary pressure of 0.16 bar from
the work of Ji, Utomo, Woo, Lee, Jeong & Chung (2010). . . 34
2.24 Schlieren image of air flowing from the nozzle into the mixing section at
stagnation conditions of 380 kPa and 25◦C from the work of Al-Doori
(2013). . . 36
2.25 Optical device, TSI atomizer and acquisition system used by Desevaux
(2001). . . 37
2.26 Phase averaged PIV flow visualization images showing vortex ring time
evolution by Choutapalli (2006). . . 37
2.27 PIV experimental system used by Bouhanguel, Desevaux, Bailly &
Gi-rardot (2012). . . 38
2.28 Schlieren photographs of shock structures in the mixing chamber. (a)
Pp=0.3 MPa,Ps=0.06 MPa; (b)Pp=0.3 MPa,Ps=0.08 MPa; (c)Pp=0.35 MPa, Ps=0.06 MPa; (d)Pp=0.35 MPa,Ps=0.08 MPa from the work of Zhu & Jiang (2014). . . 38
2.29 Images of shock wave acquired by Nishijimi, Tsuchii & Nakagawa (2016). 39
3.2 Profile of the CRMC ejector duct. . . 47
3.3 Pressure profile along the CRMC ejector duct at the design point. . . . 49
3.4 Velocity profile along the CRMC ejector duct at the design point, the
nozzle exit is at the start of the ejector duct. . . 50
3.5 Mach number profile along the CRMC ejector duct at the design point,
the nozzle exit is at the start of the ejector duct. . . 51
3.6 Flow characteristic into the CRMC ejector. . . 52
4.1 Schematic diagram of the CRMC ejector plumbing and instrumentation. 54
4.2 CRMC ejector arrangement with main parts illustrated using solid
mod-elling. . . 55
4.3 Schematic diagram of the CRMC ejector with main parts illustrated. . . 55
4.4 Profile of the primary nozzle with overall dimensions (all dimensions in
mm). . . 57
4.5 Photograph of the primary nozzle produced by the 3D printer. . . 58
4.6 Holder of the primary nozzle with main dimensions (all dimensions in
mm). . . 59
4.7 Profile of front view and section of side view of the hub with integral
spokes with overall dimensions (all dimensions in mm). . . 60
4.8 Photograph of the centralising hub with integral spokes. . . 61
4.9 Secondary flow pipe, part 2 (all dimension in mm). . . 62
4.10 Secondary flow pipe (part 1) profile of the secondary flow line (all
xviii LIST OF FIGURES
4.11 Profile of front view and section of side view of the entrainment section
with main dimensions (all dimensions in mm). . . 64
4.12 Model of CRMC ejector part 1. . . 65
4.13 Photograph of the assembled CRMC ejector. . . 66
4.14 Correlation between primary stream mass flow rate and primary pressure. 68
4.15 Photograph of assembly of CRMC duct with pressure transducers
con-nected. . . 69
5.1 Photograph of the experimental apparatus with supporting components:
(A) primary supply line, (B) secondary flow control lever, (C) secondary
supply line, (D) pressure transducers, (E) data acquisition (F) ejector
duct, (G) outlet line connected to vacuum tank (H) outlet connected to
secondary vacuum, (I) secondary pressure tappings, (VT) vacuum tank. 73
5.2 Pneumatic dead weight tester in the sub-atmospheric testing arrangement. 74
5.3 Secondary flow temperature recorded from flow meter and thermocouple
positioned at the inlet of the secondary line. . . 76
5.4 Test running time over a range of secondary pressure at primary pressure
of 200 kPa. . . 77
5.5 Test running time over a range of primary pressure at secondary pressure
of 2.5 kPa. . . 77
5.6 Example of stability of the primary pressure during the test time for a
nominal primary pressure of 200 kPa. . . 82
5.7 Example of stability of the secondary pressure during test time for
5.8 Wall pressure distribution for three experimental test results for the
same nominal operating conditions of 200 kPa and 1.6 kPa for the
pri-mary and secondary pressure respectively. . . 84
5.9 Entrainment ratio variation with exit pressure for three experimental
tests with the same nominal operating conditions of 200 kPa and 1.6 kPa
for primary and secondary pressure respectively. . . 85
5.10 Exit pressure variation during test time at primary pressure of 200 kPa
and secondary pressure of 2 kPa. . . 87
5.11 Secondary pressure variation during test time at primary pressure of
200 kPa. . . 88
6.1 Nozzle exit position and throat section profile for conventional and
CRMC ejectors. . . 91
6.2 Experimental results for entrainment ratio over a range of exit pressures
at 200 kPa primary and secondary pressure of 1.6 kPa. The nozzle exit
position is 40 mm. . . 92
6.3 Variation of entrainment ratio with back pressure at a primary pressure
of 200 kPa and a range of secondary pressures, Ps. The nozzle exit position is 40 mm. . . 93
6.4 Variation of entrainment ratio with back pressure at a primary
pres-sure of 250 kPa and a range of secondary prespres-sure, Ps. The nozzle exit position is 40 mm. . . 94
6.5 Secondary flow rate variation over a range of primary pressure and
sec-ondary pressure. The nozzle exit position is 40 mm. . . 95
6.6 Entrainment ratio variation over a range of primary pressure and
xx LIST OF FIGURES
6.7 Experimental results of entrainment ratio over a range of NXP at
pri-mary pressure of 200 kPa and a range of secondary pressure. . . 98
6.8 Experimental results for entrainment ratio over a range of secondary
pressures at primary pressures of 200 kPa, 225 kPa and 250 kPa. . . 103
6.9 Variation of the back pressure over a range of secondary pressure at
primary pressure of 200 kPa and 250 kPa (1): Critical conditions (2):
Breakdown conditions. . . 104
6.10 Entrainment ratio as a function of compression ratio over a range
pri-mary pressures. . . 105
6.11 Variation of entrainment ratio and critical back pressure at different
operating conditions. The nozzle exit position is at 40 mm. . . 106
6.12 Experimental results of wall pressure along the ejector over a range of
secondary pressure at primary pressure of 200 kPa. . . 107
6.13 Experimental results of wall pressure along the ejector over a range of
secondary pressure at primary pressure of 225 kPa. . . 108
6.14 Maximum entrainment ratio variation with expansion ratio for the CRMC
ejector performance at different operating conditions compared with the
gas dynamic, GD model. . . 110
6.15 Critical compression ratio variation with expansion ratio for CRMC
ejector performance at different operating conditions compared with the
gas dynamic model. . . 112
6.16 Air ejector performance data with comparisons to the gas dynamic
mod-elling for various conventional ejectors: maximum entrainment ratio
6.17 Air ejector performance data with comparisons to the gas dynamic
mod-elling for various conventional ejectors: maximum compression ratio
variation with expansion ratio. . . 114
6.18 CRMC steam ejector performance data with comparisons to the gas
dy-namic modelling: maximum entrainment ratio variation with expansion
ratio. . . 116
6.19 CRMC steam ejector performance data with comparisons to the gas
dy-namic modelling: maximum compression ratio variation with expansion
ratio. . . 117
6.20 CRMC air ejector performance data with comparisons to the gas
dy-namic modelling: maximum entrainment ratio variation with expansion
ratio. . . 118
6.21 CRMC air ejector performance data with comparisons to the gas
dy-namic modelling: maximum compression ratio variation with expansion
ratio. . . 118
7.1 Primary nozzle profile, all dimensions in mm. . . 127
7.2 Primary nozzle and CRMC ejector profile, all dimensions in mm.
Num-bers 1, 2, and 3 refer to primary, secondary, and exit flows respectively. 128
7.3 Comparison of simulated static pressure and experimental data for the
three grid resolutions and for operating conditions of primary, secondary,
and exit pressure of 200 kPa, 1.6 kPa, and 4.6 kPa respectively. . . 130
7.4 Meshing of the primary nozzle and a portion of the secondary flow duct. 130
7.5 Comparison between experimental data and CFD simulations of static
pressure along the ejector wall for two turbulence models and for
op-erating conditions of primary, secondary, and exit pressure of 200 kPa,
xxii LIST OF FIGURES
7.6 Comparison of simulated entrainment ratio of three grid resolutions and
for primary pressure of 200 kPa, secondary pressure of 1.6 kPa and
dif-ferent back pressure. . . 133
7.7 Comparison between experimental data and CFD simulations of the
entrainment ratio for two turbulence models and for primary pressure
of 200 kPa, secondary pressure of 1.6 kPa and different back pressure. . . 134
7.8 Comparison between experimental data and CFD simulations of the
entrainment ratio for two turbulence models and for primary pressure
of 200 kPa, secondary pressure of 2.5 kPa and different back pressure. . . 135
7.9 Comparison of the entrainment ratio from CFD simulations and
exper-imental data for cases (a) and (b) of Table 7.4. . . 137
7.10 Comparison of the entrainment ratio from CFD simulations and
exper-imental data for cases (c) and (d) of Table 7.4. . . 137
7.11 Experimental and CFD results for pressure along the ejector wall at
operating conditions of case 1 and case 2. . . 139
7.12 Theoretical and CFD results for pressure along the ejector axis for case 1.140
7.13 Theoretical and CFD results for pressure along the ejector axis for case 2.140
7.14 Theoretical and CFD results for Mach number along the ejector axis for
case 2. . . 141
7.15 Contours of Mach number in the CRMC ejector showing shocks in the
primary stream. . . 142
7.16 Static pressure distribution along the ejector axis for a range of primary
pressure, 1.6 kPa as the secondary pressure, and 4.8 kPa as the back
7.17 Illustration of parameters used to define the sonic surface dimensions.
Case illustrated is for the primary pressure of 200 kPa, secondary
pres-sure of 1.6 kPa and exit prespres-sure of 4.8 kPa. . . 144
7.18 Sonic surface at the primary pressure of (a) 200 kPa, (b) 220 kPa, (c)
230 kPa, (d) 240 kPa, (e) 250 kPa, secondary pressure of 1.6 kPa and exit
pressure of 4.8 kPa. . . 145
7.19 CRMC ejector pressure map and pressure distribution along the axis
for 200 kPa, 1.6 kPa, and 4.8 kPa as the primary, secondary, and back
pressure respectively. . . 146
7.20 Velocity vector at primary pressure of 200 kPa and secondary pressure
of 1.6 kPa, and 4.8 kPa as exit pressure. . . 147
7.21 Velocity stream lines of primary flow at operating conditions of 200 kPa
as a primary pressure and secondary pressure of (a) 1.6 kPa, (b) 2.5 kPa,
(c) 4 kPa, (d) 5 kPa. . . 148
7.22 Velocity map at primary pressure of 200 kPa, secondary pressure of
1.6 kPa, and 5.2 kPa as back pressure. . . 149
7.23 Velocity map at primary pressure of 200 kPa and secondary pressure of
1.6 kPa,and 5.5 kPa as exit pressure. . . 150
7.24 Conventional ejector geometry (all dimensions in mm), numbers 1, 2, 3,
refer to primary, secondary, and exit flows respectively. . . 151
7.25 Conventional ejector pressure map and pressure distribution along the
axis for 200 kPa, 1.6 kPa, and 4.8 kPa as the primary, secondary, and
exit pressure respectively. . . 152
7.26 Total pressure distribution for the CRMC and a conventional ejector
along the axis at primary pressure of 200 kPa, secondary pressure of
xxiv LIST OF FIGURES
7.27 Ejector profiles for the conventional and CRMC ejectors (all dimensions
in mm). . . 154
7.28 Pitot pressure and total pressure distribution in the CRMC and
con-ventional ejectors at distance of 60 mm downstream of the primary nozzle.155
8.1 Photograph of the parts used to create the mould to cast the transparent
duct: a. inner parts b. outer parts. . . 160
8.2 Photograph of the assembled parts used to create the mould to cast the
transparent duct: a. inner part b. outer part. . . 161
8.3 Photograph of a. mould b. mould inside encasing shield. . . 162
8.4 Photograph of the transparent ejector duct. . . 163
8.5 Micrograph of talc powder as loaded into the seeding system. . . 165
8.6 Micrograph of talc powder as delivered from the seeding system. . . 166
8.7 3D solid model of the seeding system. . . 167
8.8 Ejector apparatus schematic diagram for flow visualization. . . 168
8.9 3D sketch of the transparent ejector and flow visualization system. . . . 169
8.10 Photograph of the transparent ejector and flow visualization system. . . 169
8.11 Photo of the first section of the ejector during flow (the axial and radial
distances are in pixel, 1 mm=17 pixel). . . 170
8.12 Static pressure plots along the ejector for seeded and unseeded flow
at 200 kPa, 1.6 kPa and 4.8 kPa as the primary, secondary and back
pressures respectively. . . 172
8.14 Intensity variation within the ejector duct at locations between 2 and
75 mm from the nozzle exit at 190 kPa, 1.6 kPa and 4.5 kPa as a primary
pressure, secondary pressure and back pressure respectively. . . 175
8.15 Intensity variation within the ejector duct at locations between 80 and
155 mm from the nozzle exit at 190 kPa, 1.6 kPa and 4.5 kPa as a primary
pressure, secondary pressure and back pressure respectively. . . 176
8.16 Intensity variation within the ejector duct at locations between 2 and
75 mm from the nozzle exit at 200 kPa, 1.6 kPa, 4.8 kPa as a primary,
secondary pressure and back pressure respectively. . . 177
8.17 Intensity variation within the ejector duct at locations between 80 and
155 mm from the nozzle exit at 200 kPa, 1.6 kPa and 4.8 kPa as a
pri-mary, secondary pressure and back pressure respectively. . . 178
8.18 Intensity variation within the ejector duct at locations between 2 and
75 mm from the nozzle exit at 210 kPa, 1.6 kPa and 5.2 kPa as a primary
pressure, secondary pressure and back pressure respectively. . . 179
8.19 Intensity variation within the ejector duct at locations between 80 and
155 mm from the nozzle exit at 210 kPa, 1.6 kPa and 5.2 kPa as a primary
pressure, secondary pressure and back pressure respectively. . . 180
8.20 Intensity variation within the ejector duct at locations between 2 and
75 mm from the nozzle exit at 220 kPa, 1.6 kPa and 5.7 kPa as a primary
pressure, secondary pressure and back pressure respectively. . . 181
8.21 Intensity variation within the ejector duct at locations between 80 and
155 mm from the nozzle exit at 220 kPa, 1.6 kPa and 5.7 kPa as a primary
pressure, secondary pressure and back pressure respectively. . . 182
8.22 Composite image of the flow at 200 kPa and 1.6 kPa as a primary and
xxvi LIST OF FIGURES
8.23 Visualisation intensity data of flow for operating conditions of 200 kPa,
1.6 kPa and 4.8 kPa as a primary, secondary and back pressures
respec-tively. . . 184
8.24 Jet flow core diameter at different locations from the nozzle exit for
range of primary and back pressures and 1.6 kPa as a secondary pressure.185
8.25 Simulation of the turbulent kinetic energy along the ejector centreline
for operating condition of 190 kPa, 1.6 kPa as primary and secondary
pressures respectively. . . 186
8.26 Jet core length for a range of primary pressure. . . 187
A.1 Profile of the primary nozzle with overall dimensions, all dimensions in
mm. . . 203
A.2 Profile of the primary nozzle holder with overall dimensions, all
dimen-sions in mm. . . 204
A.3 Profile of the hub with integral spokes with overall dimensions, all
di-mensions in mm. . . 205
A.4 Profile of the secondary flow pipe part 1 with overall dimensions, all
dimensions in mm. . . 206
A.5 Profile of the secondary flow pipe part 2 with main dimensions, all
dimensions in mm. . . 207
A.6 Profile of the orifice plate with main dimensions, all dimensions in mm. 208
A.7 Profile of the entrainment section with main dimensions, all dimensions
in mm. . . 209
A.8 Profile of the connection section with main dimensions, all dimensions
A.9 Profile of the exit section with main dimensions, all dimensions in mm. . 211
A.10 Profile of the part 1 of CRMC ejector with main dimensions, all
dimen-sions in mm. . . 212
A.11 Profile of the part 2 of CRMC ejector with main dimensions, all
dimen-sions in mm. . . 213
A.12 Profile of the part 3 of CRMC ejector with main dimensions, all
dimen-sions in mm. . . 214
A.13 Profile of the part 4 of CRMC ejector with main dimensions, all
dimen-sions in mm. . . 215
A.14 Profile of the part 5 of CRMC ejector with main dimensions, all
dimen-sions in mm. . . 216
A.15 Profile of the part 6 of CRMC ejector with main dimensions, all
dimen-sions in mm. . . 217
B.1 Photograph of the pneumatic dead-weight tester model 550 series
(Bu-denberg). . . 219
B.2 Photograph of the hydraulic dead-weight tester model 580 series
(Bu-denberg). . . 219
B.3 Calibration of the Wika high pressure transducer-representative results. 220
B.4 Calibration of the Wika low pressure transducer-representative results. . 220
B.5 Calibration of the Omega flow meter-representative results. . . 222
B.6 Correlation of the flow rate and the pressure in the primary
List of Tables
3.1 Ejector design parameters with the working fluid being air. . . 46
3.2 Flow conditions and dimensions of the designed CRMC duct. . . 48
4.1 Main specifications of 3D printer Type ProJetTMHD 3500. . . 57
4.2 VisiJet material specifications . . . 58
4.3 Flow meter FMA-2600A-OMEGA specifications . . . 67
4.4 Major specifications of three types of pressure transducers . . . 69
5.1 Calibration of Wika and Sensortechnics GmbH pressure transducers.
Vmeas= measured voltage. Voltage in Volt, and pressure in kPa. . . 75
5.2 Results for nominal primary pressure of 200 kPa and nominal secondary
pressure of 1.6 kPa. . . 80
5.3 Uncertainty analysis for the ejector experimental work. . . 86
6.2 Data from experiments with different nozzle positions and a nominal
primary pressure of 200 kPa for a range of secondary and back pressures
conditions. Primary mass flow rate was 3.58 g/s for the nominal primary
pressure of 200 kPa. . . 100
6.3 Data of experimental with different nozzle positions and a nominal
pri-mary pressure of 225 kPa for a rage of secondary and back pressures
conditions. Primary mass flow rate was 3.89 g/s for the nominal
pri-mary pressure of 225 kPa. . . 101
6.4 Data of experimental with different nozzle positions and a nominal
pri-mary pressure of 250 kPa for a range of secondary and back pressures
conditions. Primary mass flow rate was 4.25 g/s for the nominal primary
pressure of 250 kPa . . . 102
6.5 Isentropic Mach number at the location of lowest measured wall static
pressure for primary pressure of 200 kPa and 225 kPa and range of
sec-ondary pressure. . . 109
6.6 Entrainment ratio, expansion ratio, pressure lift ratio and breakdown
pressure for various conventional ejectors working with air. . . 115
6.7 Entrainment ratio, expansion ratio, pressure lift ratio and breakdown
pressure for various CRMC ejectors working with steam and air. . . 119
7.1 Different mesh resolutions used in the simulations. . . 126
7.2 Average error in simulation of the static pressure: comparison of
differ-ent turbulence models. . . 132
7.3 average error for entrainment ratio simulations for different turbulence
models from Figure 7.8. . . 135
7.4 Ejector operating conditions in the 4 cases presented in Figures 7.9 and
xxx LIST OF TABLES
7.5 Ejector operating conditions for experimental-analytical-CFD comparison.138
7.6 Sonic surface dimensions at different primary pressures, a secondary
pressure of 1.6 kPa and an exit pressure of 4.8 kPa. . . 145
7.7 Calculated values for the pitot and total pressure. . . 156
8.1 OLYMPUSR i−SP EED3 high speed camera specification. . . 164
8.2 Powder consumption during the experiments for a range of primary
pressures and a secondary pressure of 1.6 kPa. Pp, m˙s, t, m, ˙m re-fer to primary pressure, secondary mass flow rate, test time, powder
consumption and powder mass flow rate respectively. . . 172
B.1 Calibration of Wika low pressure transducers. Vmeas= measured volt-age. Voltage in Volt, and pressure in kPa. . . 221
C.1 Data from experiments with different nozzle positions and a nominal
primary pressure of 200 kPa for a range of secondary and back pressures
conditions. Primary mass flow rate was 3.58 g/s for the nominal primary
pressure of 200 kPa. . . 225
C.2 Data of experimental with different nozzle positions and a nominal
pri-mary pressure of 225 kPa for a rage of secondary and back pressures
conditions. Primary mass flow rate was 3.89 g/s for the nominal
pri-mary pressure of 225 kPa. . . 226
C.3 Data of experimental with different nozzle positions and a nominal
pri-mary pressure of 250 kPa for a range of secondary and back pressures
conditions. Primary mass flow rate was 4.25 g/s for the nominal primary
C.4 Data of experimental with different nozzle positions and a nominal
pri-mary pressure of 270 kPa for a range of secondary and back pressures
conditions. Primary mass flow rate was 4.55 g/s for the nominal primary
Chapter 1
Introduction
1.1
Ejector history and applications
Ejectors are known as vacuum jets, jet pumps or thermo-compressors for different
applications, and the working fluid may be a liquid or gas. These devices have been
used extensively in the power generation and chemical processing industries for nearly
a century. Ejectors also have applications in nuclear, distillation, vacuum evaporation
and drying processes and the ability to handle highly corrosive vapours and fluids.
The first wave of popularity of ejector refrigeration systems came in the early 1930s
for the air conditioning of large buildings. However, mechanical vapour compression
refrigeration systems were ultimately favoured due to their higher COP, smaller volume
and reliable operation.
Recently, cooling technology interests have begun to realign with the ejector
refriger-ation system due to the rising cost of energy and the decreasing availability of energy
resources. In addition, as incentives to protect the environment have grown, ejectors
are becoming more popular in industrial fields because of associated energy savings
and emission reduction (Sun & Eames 1995) and thus, the system has again become
an attractive subject.
operate reliably with low capital and maintenance cost compared with conventional
pumps or compressors. In addition, as an environmentally friendly alternative to
tradi-tional refrigerants, water vapour can be used as a working fluid in ejector refrigeration
systems, providing an environmental protection factor. Ejectors have promising
ap-plications in energy savings due to their ability to utilize waste or low grade thermal
energy.
1.2
Ejector operation
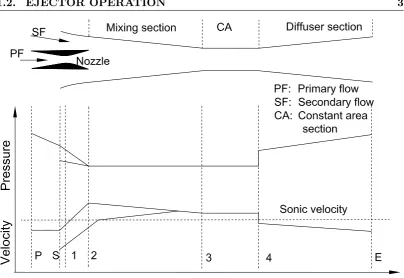
Figure 1.1 illustrates a conventional gas or vapour ejector and its flow characteristics.
The ejector system is made up of the primary nozzle and mixing section, the secondary
throat or constant area section and the subsonic diffuser. The high pressure primary
flow (PF) enters the nozzle at (plane P) and starts to accelerate as it enters the nozzle
convergent section and reaches the sonic condition at the nozzle throat (plane 1). While
expanding through the nozzle divergent section, the velocity of primary flow increases.
Due to the velocity increase, a low pressure region at the nozzle exit plane (plane 2)
is created.
The motive flow (primary flow) draws the secondary fluid into the mixing section
(plane 2) through the action of the mixing between the high speed primary flow and
the initially lower speed secondary flow. The secondary flow is accelerated and matches
the primary flow pressure at some point downstream (nominally the nozzle exit at plane
2), and the two streams mix as they move downstream. A compression effect occurs in
a series of shocks induced at the ejector throat or constant area section (between plane
3 and plane 4), this effect is illustrated at the very end of the constant area section.
When the mixed stream passes through the subsonic diffuser, and possibly due to the
action of additional shock waves, the velocity of the mixture decreases and reaches a
subsonic level and further compression is achieved. Finally, the mixed flow leaves the
1.2. EJECTOR OPERATION 3
Figure 1.1: Flow characteristics in a conventional gas or vapour ejector.
The most significant parameter in ejector design is the entrainment ratio, ER which
is defined as:
ER= m˙s ˙
mp
(1.1)
where ˙ms is defined as the mass flow rate of the secondary stream, and ˙mp is the mass flow rate of the primary stream. In an ejector refrigeration cycle, an approximation for
the coefficient of performance (COP) is sometimes used (Ruangtrakoon et al. 2012) is
COP ≈ER (1.2)
The ratio of the exit pressure to the secondary pressure, which is called the pressure lift
ratio (PLR) or compression ratio (CR), is the second key parameter used to evaluate
the ejector performance
CR= Pc
Ps
(1.3)
primary flow stagnation pressure to the secondary flow stagnation pressure also plays
a significant role in ejector performance.
1.3
Constant rate momentum change design
The geometric configuration of a supersonic ejector has a significant effect on the
ejector performance (Sun 1996, Chunnanond & Aphornratana 2004, Ruangtrakoon
et al. 2012). A number of researchers have investigated the effect of ejector geometry
on ejector performance. For example, they have investigated the effect of convergence
and divergence angles, length and diameter of the constant area section, nozzle position
and entrained flow entrance geometry. Varying degrees of success in augmentation of
ejector performance have been achieved through many previous studies. However,
significant improvement in ejector performance is yet to be obtained.
Performance improvements might be possible through improved designs that reduce
pressure losses associated with the mixing process (Sun 1996) and methods to reduce
pressure losses in the diffuser are also important. The constant rate of momentum
change (CRMC) duct profile was proposed by Eames (2002) in an attempt to
elim-inate the shock-induced pressure losses that occur in a conventional ejector. In this
design, it is assumed that the mixed flow undergoes a shock-less diffusion as it moves
through a non-uniform cross sectional area ejector duct that causes its momentum to
vary at a constant rate. Several authors have subsequently investigated the CRMC
design and varying degrees of performance improvements relative to conventional
ejec-tor design have been reported (Worall (2001), Kumar, Singhal & Subbarao (2013),
Mazzelli & Milazzo (2015)). The conditions under which performance improvements
can be expected from the CRMC design are yet not clear.
1.4
Design optimisation
For many years computational fluid dynamics (CFD) has provided valuable
1.5. SCOPE OF STUDY 5
(Riffat & Everitt 1999). CFD can be used to study the effects of compressibility and
turbulence of the flow structure inside the proposed ejector and to examine the effects
of operating conditions and nozzle exit position on the performance of the ejector. CFD
can also be used for visualisation of ejector characteristics in a cost and time effective
way. Although the quality and accuracy of CFD simulations of ejector performance
varies from study to study, it is generally agreed that CFD can make an important
contribution to ejector design optimisation (Little & Garimella 2016).
Flow visualisation inside the ejector has been used in a limited number of applications
to validate existing CFD and provide qualitative information related to ejector flow.
Capturing some effects of the ejector flow may not be possible with available
computa-tional, analytical and experimental tools. The mixing process inside the ejector is the
area of highest uncertainty that impacts the entrainment ratio and compression ratio
and a full understanding has not been achieved due to difficulties associated with the
measurement of this complex flow behaviour. Non-intrusive visualisation techniques
could provide visualisation of the mixing flow behaviour inside the proposed ejector
enabling improved understanding of the mixing process, and therefore could ultimately
improve the design of ejectors (Little & Garimella 2016).
1.5
Scope of study
Methods of CFD and flow visualisation are applied to an ejector design using the
CRMC prescription to assess its performance and enhance the understanding of the
CRMC design within the context of conventional ejector duct performance. The
fol-lowing tasks have been completed.
• Design, fabricate and commission an open system air ejector based on CRMC
theory, suitable for flow visualisation studies.
• Develop flow seeding and laser-based visualisation methods suitable for the CRMC
ejector.
• Acquire new data which provides additional insight into the ejector mixing and
• Compare the performance of a conventional ejector geometry with the proposed
CRMC geometry and determine if changes to the characteristics of the shocks
are a contributor to performance changes.
• Evaluate the CRMC ejector relative to different types of ejectors using different
working fluids.
Although the work seeks to make contributions to the understanding of CRMC and
other ejectors for the purpose of improving their performance, the chosen operating
conditions for the air ejector reflect the pressure ratios encountered by steam ejectors
used in refrigeration applications.
1.6
Overview of the Dissertation
This dissertation is arranged in the following chapters:
Chapter 1 Introduction to the supersonic ejector, and scope of the present study.
Chapter 2 This chapter presents a review of previous studies that focused on
con-ventional and variable area ejector design and operation, experimental,
compu-tational, and flow visualization studies.
Chapter 3 This chapter describes how the CRMC theory is employed in this work.
An analysis of the design is also presented in this chapter.
Chapter 4 An overview of the apparatus design and fabrication of the CRMC ejector
duct is presented in this chapter. Pressure, temperature, and flow measuring
devices are also introduced in this chapter.
Chapter 5 Preliminary experimental work which includes the system stability,
sys-tem repeatability and uncertainty of measuring tools is presented in this chapter.
The effect of the variation of the nozzle exit position on the ejector performance
is also presented.
Chapter 6 The experimental data is presented and discussed in this chapter. Results
1.6. OVERVIEW OF THE DISSERTATION 7
pressures on the ejector performance. Results for the entrainment ratio and
pressure distribution along the ejector wall are presented.
Chapter 7 Computational analysis including the simulation of the ejector using CFD
and comparison with experimental data is presented in this chapter.
Chapter 8 This chapter presents the flow visualisation technique and the design and
fabrication of the transparent duct and particle seeding system. Image processing
and data analysis which presents the flow behaviour inside the ejector, are also
presented in this chapter.
Chapter 9 This chapter includes the overall conclusion and presents
Literature Review
2.1
Introduction
Many theoretical and experimental studies have been completed in efforts to
under-stand the fundamentals of ejector operation and to underunder-stand the effect of various
parameters on performance. Ejectors were first applied in 1901 (ASHRAE 1986) for
re-moving air from a steam engine’s condenser. Since then, researchers have focused their
efforts to improve the performance of the ejector utilised in a variety of application
such as refrigeration, pumping and evacuation systems.
The review describes and evaluates the development of the different aspect of design,
fabrication, and operation of the ejector up to the present. Previous analytical,
com-putational, experimental, and flow visualization studies are included.
2.2
Ejector analytical models
Application of ejectors in the first attempt to develop the ejector-driven refrigeration
system by Le Blank and Parsons occurred in 1901 (ASHRAE 1986). It was quickly
realised that the performance of the ejector played a crucial role in the performance of
2.2. EJECTOR ANALYTICAL MODELS 9
Keenan (1950) performed a theoretical study of ejectors and classified them into two
categories according to the position of the nozzle: (1) Constant-Area Mixing (CAM)
method which means that the nozzle exit is located within the ejector constant-area
sec-tion and the mixing of the primary and the secondary flows occurs inside the
constant-area section; (2) Constant-Pressure Mixing (CPM) method which means that the
nozzle exit is located within the suction chamber which is in front of the
constant-area section and the mixing process occurs at constant pressure. The results from the
Keenan (1950) investigation was that CPM gives a better performance than the CAM
ejector and is thus widely used. In Keenan (1950) paper, one-dimensional continuity,
momentum, and energy equations were used for the first time to analyse the ejector
operation. The author is considered as the founder of ejector analysis theory. However,
this theory is unable to predict the phenomenon that produces the well known
con-stant capacity characteristics of ejector flow, in which the entrainment ratio remains
constant until the condenser pressure increases to a point (the critical operation point)
at which the secondary flow is no longer choked.
Munday & Bagster (1977) proposed a theory to describe stream choking effects. The
authors assumed the presence of an effective area (annulus area formed between the
primary jet core and the ejector walls) for the secondary flow to account for this
phenomenon. This area according to their theory, remains constant and independent
of the ejector exit pressure downstream.
Eames, Aphornratana & Haider (1995) presented theoretical and experimental studies
of a small-scale steam-jet refrigerator and introduced a theoretical model including
irreversibility associated with the primary nozzle, the mixing chamber and the diffuser.
This model was based on a constant-pressure mixing process, but without considering
the choking of the secondary flow.
Huang et al. (1999) analysed the operation of 11 different ejectors working with R141b
and further developed Keenan’s model by assuming:
• A hypothetical throat occurs inside the constant area section to allow the
sec-ondary flow to pass and reach a choked condition.
throat and continues with constant pressure.
• A shock will occur at the end of the constant area section leading to a sudden
pressure rise.
The results attained by Huang et al. (1999) demonstrated good agreement with
ex-periments. However, the ejector modelling assumption would not be applicable to all
ejector configurations.
2.3
Operating conditions
Sun (1997) investigated the performance characteristics of an open steam jet
refriger-ation system. The operating conditions of the system were between 95oC and 135oC for the generator temperatures and between 5oC and 15oC as the evaporator tem-peratures. The results illustrate that increasing generator temperature initially causes
an increase in the entrainment ratio, but further generator temperature rise causes
entrainment ratio to decrease. In addition, the results show that increasing the
evapo-rator temperature leads to improving system performance. It was concluded that the
evaporator temperature has a significant impact on the ejector performance.
A closed steam ejector refrigeration system was experimentally studied by Chunnanond
& Aphornratana (2004). Three primary nozzle throat diameters, 0.5 mm, 1.75 mm,
and 2 mm were used in this work. The boiler temperature ranged between 120oC and 140oC, while the evaporator temperature ranged between 5oC to 15oC. The author concluded that super heating of the primary flow does not have a significant effect on
the system performance or the critical condenser pressure. Furthermore, the study
showed the system performance declines as the primary pressure increases for a given
secondary pressure.
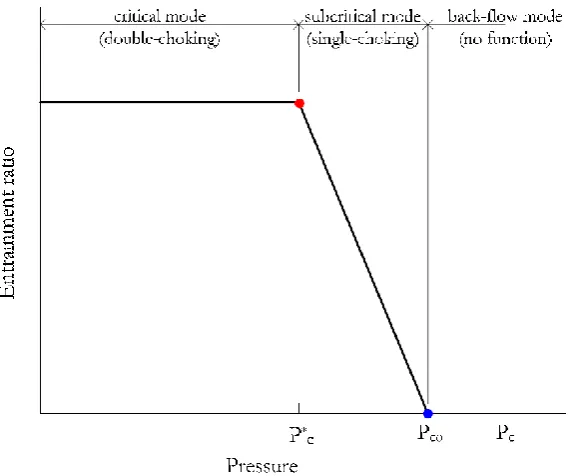
Pridasawas (2006) studied the influence of the exit pressure on the entrainment ratio
as in Figure 2.1 which shows three ejector operation modes: double choked, single
2.3. OPERATING CONDITIONS 11
• When the condenser pressure is lower than the critical pressure and both primary
and secondary flows are choked, highest ejector performance can be obtained.
This region is called the “critical mode” and “double-choking” occurs.
• The ejector performance dropped when the exit pressure increased beyond the
critical pressure value and only the primary flow is choked. Thus, the entrainment
ratio decreases as the back pressure increases. This region is called the
“sub-critical mode” and “single-choking” occurs.
• The ejector stops working when the back pressure exceeds a specific value. As the
back pressure continues to increase, back-flow occurs through the secondary flow
line. This region is referred to as the “back-flow mode” and ejector “malfunction”
[image:43.595.177.462.327.565.2]occurs.
Figure 2.1: Schematic illustration of operation modes and variation of entrainment ratio
with the condenser pressure from the work of Pridasawas (2006).
Meyer, Harms & Dobson (2009) tested a 2.5, 3, and 3.5 mm primary nozzle throat
diameter in an open system ejector configuration using steam and operated with a
100oC and concluded that the primary flow temperature, secondary flow temperature, exit pressure, and the primary nozzle exit position have a significant effect on the
ejector performance.
Dong et al. (2017) developed and tested a steam ejector refrigeration system in order
to assess its ability to function properly in refrigeration applications with extra
low-temperature heat sources below 40oC. The working performance of the steam ejector at generating temperatures ranging from 40oC to 70oC was also investigated. The study concluded that the configuration can operate successfully at this range of low
[image:44.595.119.438.281.522.2]temperatures as illustrated in Figure 2.2
Figure 2.2: Variation of system COP with the condensing temperature at different
gener-ator temperatures from the work of Dong et al. (2017).
2.4
Nozzle design
Chang & Chen (2000) proposed a novel petal nozzle as illustrated in Figure 2.3 to
enhance the performance of a steam jet refrigeration system. Experimental results from
this study show that the entrainment ratio and the COP of the system with a petal
2.4. NOZZLE DESIGN 13
cycle when operated at larger area ratios (constant area section to nozzle throat area).
In addition, the author experimentally demonstrated that more efficient mixing can be
achieved by using this kind of nozzle and that more kinetic energy can be recovered to
enhance the back pressure. The suggested nozzle is similar in many characteristics to
that of a conical nozzle but could operate with higher pressure ratio. Its complicated
shape adds complexity to fabrication which detracts from any positive characteristics
of performance.
Figure 2.3: Conical and petal nozzles geometry from the work of Chang & Chen (2000).
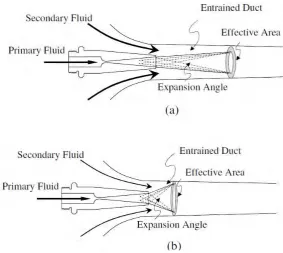
Chunnanond & Aphornratana (2004) investigated the effect of nozzle geometry and
position on the performance of steam ejector refrigeration. In this study, the authors
indicated that using either a smaller nozzle or moving the nozzle away from the
mix-ing chamber could increase the ejector entrainment ratio. They assert this may occur
because withdrawing the nozzle provides a larger effective area allowing a larger
en-trained secondary flow as in Figure 2.4. In addition, the study illustrated that the
presence of super heated steam has no effect on the system performance other than to
Figure 2.4: Effective area and expansion angle in the mixing chamber from the work of
Chunnanond & Aphornratana (2004).
Chaiwongsa & Wongwises (2008) used R134a as a working fluid to study the influence
of the nozzle outlet diameter on ejector efficiency. The study analysed various nozzle
outlet diameter (2 mm, 2.5 mm, 3 mm) and concluded that using nozzles with different
outlet diameter has little effect on system performance and the 2 mm nozzle diameter
produces the best performance.
Park (2009) introduced a swirled motive flow thermal vapour compressor as a new
attempt to enhance its entrainment performance by letting the motive steam flow into
the primary nozzle with a swirl component. The author used various swirl angles to
investigate the influence of the swirl motion on the ejector entraining performance.
The study concluded that the swirled motive flow increased the entrainment ratio by
2% compared with the no swirl ejector.
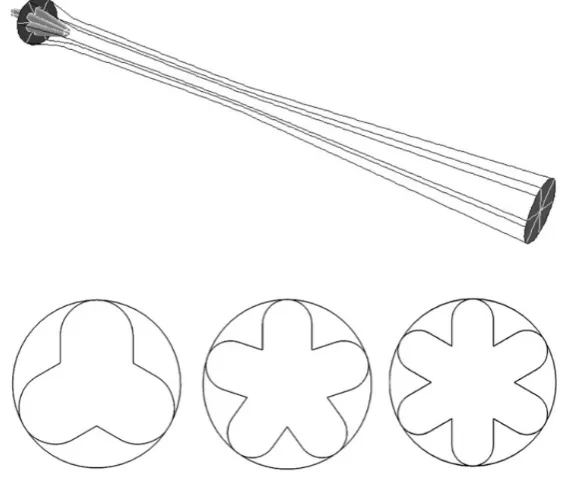
Opgenorth et al. (2012) focused on the reduction of the primary fluid flow rate required
to obtain higher entrainment ratio at a given secondary flow and increasing the total
pressure recovery. Designs for supersonic ejectors in refrigeration applications aiming
in-2.4. NOZZLE DESIGN 15
stability and vortices for mixing were created by adding lobes to the circular nozzle
design as in Figure 2.5. The study demonstrated that an optimum number of lobes
exists to achieve an effective way to improve the mixing process between the entrained
flow and the motive flow. The best compression ratio achieved by this study was 6.25
compared to 4 for the circular nozzle. However, the complex design of the lobed nozzle
[image:47.595.175.457.209.449.2]is considered the main limitation of this configuration.
Figure 2.5: Lobed nozzle geometry from the work of Opgenorth et al. (2012).
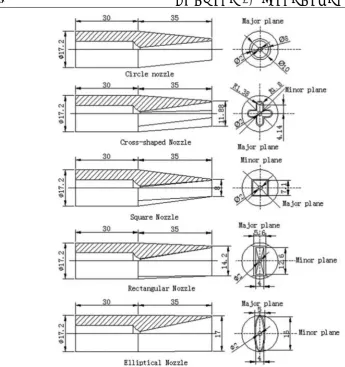
Yang et al. (2012) numerically studied the effects of different nozzle structures on the
performance of steam ejectors using a computational fluid dynamics (CFD) technique
which revealed the stream-wise vortex and span-wise vortex distributions in the mixing
chamber in lobed jet mixing flow. The study investigated the performance of five
different nozzle structures, namely, conical, elliptical, square, rectangular and
cross-shaped nozzles under similar operating conditions as in Figure 2.6. It was found that
the entrainment ratio of the ejector equipped with the conical nozzle was better than
the other nozzles but the conical nozzle achieved a lower critical back pressure than
Figure 2.6: Different nozzle shapes computationally tested by Yang et al. (2012).
The study pointed out that a higher entrainment ratio can be achieved by efficient
mixing due to the interactions between the stream wise vortex and the span wise
vor-tex. In addition, when the vortices contact the inner wall of the mixing chamber, the
effective area (the area between the primary nozzle jet core and the ejector inner wall
which the secondary flow passes through) reduces and energy losses increase.
Conse-quently, significant decrease in both the entrainment ratio and critical back pressure
occurs. Lin et al. (2013) used a CFD technique to investigate the optimum geometry
of the adjustable ejector. Several important geometrical parameters including primary
nozzle diverging angle, constant pressure mixing section length, primary nozzle exit
position, and converging angle of the constant pressure mixing chamber were modelled
using CFD and experimentally validated. The study concluded that the primary
2.4. NOZZLE DESIGN 17
are most sensitive to the variations in the flow conditions and the pressure recovery
properties than other parameters.
A comparison between a chevron nozzle and conventional nozzle as illustrated in
Fig-ure 2.7 and an assessment of their effect on the ejector performance was numerically
performed by Kong et al. (2013). The Chevron nozzle shows the better results:
en-trainment ratio was improved 14.8 % on average, and the maximum improvement was
21.8 %. At the same time, pressure recovery was increased 8.5 % on average. The study
concluded that the chevron nozzle shows better results in both the entrainment ratio
and compression ratio, even with a smaller primary stream mass flow rate.
Figure 2.7: Conventional and chevron nozzle used by Kong et al. (2013)
.
Using different nozzle shapes could improve the mixing process in the ejector and
therefore enhance the ejector performance. However, using these configurations in
ejector system is limited by their complicated construction and high manufacturing
costs.
Fu et al. (2016) investigated numerically the influences of primary nozzle characteristic
on a steam ejector’s performance. The effects of the primary nozzle outlet diameter
as well as the divergent section length under different secondary pressures on a steam
ejector were reported. The study revealed that for given operation conditions with
outlet diameter,γdto the nozzle throat has a very strong influence on the entrainment ratio of the ejector as in Figure 2.8.
Figure 2.8: Variation of entrainment ratio with ratio of outlet diameter to the nozzle
throat,γd, from the work of Fu et al. (2016).
2.5
Nozzle exit position
Watanabe (1972) experimentally studied the effect of the nozzle exit position on the
constant area ejector performance. The study demonstrated that a maximum
entrain-ment ratio could be achieved by positioning the primary nozzle at the optimum position
within the mixing section. Vyas & Kar (1975) conducted a limited study to examine
the effect of the nozzle exit position on the ejector efficiency. The study concluded that
moving the nozzle exit position away from the mixing section entrance could actually
cause a significant reduction in entrainment ratio.
The ESDU (1986) design guide suggests that the nozzle should be placed at a distance
of 0.5 to 1.0 times length of the mixing chamber’s throat diameter upstream of the
mixing chamber inlet. However, because of the complex nature of the flow structure,
it is difficult to give precise recommendations for the optimum nozzle position.
2.5. NOZZLE EXIT POSITION 19
& Eames (1997) introduced a configuration with a manually adjustable primary nozzle
to investigate the influence of changing the nozzle exit position on the ejector
perfor-mance. The COP of the system and the cooling capacity decreased by moving the
primary nozzle downstream, into the mixing section, positive values on NXP as
il-lustrated in Figure 2.9. On the other hand, when the nozzle was retracted from the
mixing chamber, the COP and cooling capacity increased, but at expense of critical
back pressure. The study showed that a single optimum primary nozzle exit
posi-tion cannot be achieved to meet all operating condiposi-tions and each operating condiposi-tion
requires a particular optimum nozzle position.
Figure 2.9: Adjustable nozzle exit position in the conventional ejector from work of
Aphornratana & Eames (1997).
Al-Doori (2013) tested experimentally four nozzle positions to investigate the effect
on performance in a constant pressure steam ejector. The selected positions of the
nozzle lip relative to the commencement of the mixing section were 6, -4, -18, and
-32 mm. The tests were carried out with steam as a working fluid at primary pressure
of 270 kPa and temperature of 130◦C and evaporator temperature of 6, 10, and 14◦C.
The highest value of COP was obtained at NXP = -32 mm as shown in Figure 2.10.
The tests revealed that the ejector entrainment ratio improves when the primary nozzle
moves upstream. This result was attributed to the increase of the area available for the
secondary flow to pass through, and therefore more secondary flow would be entrained
Figure 2.10: Effect of the nozzle exit position on conventional steam ejector performance
for primary pressure of 270 kPa and temperature of 130◦C and range of evaporator
tem-peratures from the work of Al-Doori (2013).
Dong et al. (2013) used three different movable nozzle geometries to study the effect of
the nozzle exit position on steam ejector performance at different operating conditions.
The study illustrated that the optimum nozzle exit position was located between 56 mm
to 96 mm as illustrated in Figure 2.11. In addition, the authors claimed that the nozzle
throat diameter does not affect the optimum nozzle exit position and the optimum
position is not related to the operating conditions, nozzle dimensions, and ejector
2.5. NOZZLE EXIT POSITION 21
Figure 2.11: Effect of nozzle exit position on the conventional steam ejector performance
from the work of Dong et al. (2013).
Chong et al. (2014) presented experimental and numerical studies to examine the
influence of the nozzle exit position on supersonic air ejector performance. The results
indicated that there is an optimal nozzle exit position corresponding to maximum
entrainment ratio, but the exit pressure critical value is not affected by the nozzle exit
position.
It can be concluded that the primary nozzle geometry has some effect on the ejector
working performance. The nozzle exit position significantly affects ejector performance
and nozzle position can be adjusted to start up and to fine tune ejector performance.
An optimum nozzle position covering all ejector operating conditions is not possible
and each operating condition requires a particular nozzle position. However, the main
advantage of ejector having no moving parts would be removed.
From published information, it seems that conventional ejector performance is still
relatively poor. This leaves a large margin available for improvement, potentially
2.6
Variable geometry ejectors
Conventional supersonic ejectors are designed according to the assumption of constant
area mixing (CAM) or constant pressure mixing (CPM). Occurrence of shock series in
the constant area and diffuser regions is a common problem in both these conventional
designs. The occurrence of a series of shocks in these regions causes a loss of total
pressure. To produce a high efficiency supersonic ejector, the shocks should be
elim-inated or at least minimized. In literature, a number of authors have reported that
the performance of the ejector cycles could be improved by using ejectors that do not
have any constant area region.
Ejector-related work often illustrates that the variation of the operating conditions
can cause a significant change in the constant area ejector performance. The optimum
ejector performance can be achieved over a very limited range of operating conditions;
slight changes in the operating conditions can cause a significant deterioration in ejector
performance.
Eames et al. (1995) carried out experimental and theoretical studies into fixed geometry
ejectors. The study showed that the cooling capacity and thus, the ejector performance
at off design operation is limited by the condenser pressure, which would itself be
governed by the ambient conditions in an application. The study also suggested that
the system cooling capacity is independent of the operating conditions in a given
range. The study concluded that if the ejector was designed with variable geometry
such as cross-section areas or nozzle exit position, the cooling capacity could be made
independent of the operating temperatures in a given range.
Sun (1996) carried out experimental and theoretical studies to investigate the influence
of the ejector geometry on its performance. The study indicated that fixed geometry
ejectors can not perform well unless they operate exactly at their designed operating
conditions. The study suggested that the geometry of an ejector in the refrigeration
cycle should be variable in order to cope with variations of working conditions and
maintain optimum performance and constant cooling capacity of the system. The study
concluded that if a variable geometry ejector was available there would be no critical
2.6. VARIABLE GEOMETRY EJECTORS 23
entrainment ratio rather than a sudden drop that occurs in the fixed-geometry ejector.
Kim et al. (2006) performed CFD analysis on a variable area ejector using air as a
working fluid. The ejector throat area ratio was varied by a moveable cone-cylinder
which was inserted into a conventional ejector to provide such variable area ejector
as in Figure 2.12. However, pressure losses due to flow disruption is considered a
significant drawback of this arrangement.
Figure 2.12: Schematic of a variable area ejector from the work of Kim et al. (2006).
Ma et al. (2010) introduced a steam ejector refrigeration system with a spindle placed
in front of the primary nozzle inlet to control flow rate into the nozzle, as shown in
Figure 2.13. The spindle changes the primary nozzle throat area and therefore changes
the area ratio (the ratio of the constant area throat section to primary nozzle throat
area) of the ejector. The primary flow can be adjusted using the spindle in order to
provide a higher entrainment ratio and COP as well as more flexible operation. The
study showed that when the spindle position was moved towards the nozzle, the cooling
capacity decreased due to the decreased primary flow while the critical back pressure
Figure 2.13: Configuration of steam ejector with spindle (Ma