·«·.·.·
··· ··· ··· ··· ···
: : • I ·
•z*
· · · • ï ·
I:·
European Union
Regional Policy
and Cohesion
.
Regional development studies
Cohesion and the development
challenge facing
the lagging regions
J I
S t "
t'f\
The Objectives of the Structural Funds
Objective 1 (1994-1999) Objective 2 (1994-1996)
Economic adjustment of regions whose development is lagging behind.
Economic conversion of declining industrial areas.
Objective 5b (1994-1999)
Economic diversification of rural areas.
New members (1.1.95)
Information on the eligible areas in Austria, Finland and Sweden will be available shortly.
EC regional policies
Regional development studies
Cohesion and the
development challenge
facing the lagging regions
Already published in the series Regional development studies
01 — Demographic evolution in European regions (Demeter 2015).
02 — Socioeconomic situation and development of the regions in the neighbouring countries of the Community in Central and Eastern Europe.
03 — Les politiques régionales dans l'opinion publique.
04 — Urbanization and the functions of cities in the European Community.
05 — The economic and social impact of reductions in defence spending and military forces on the regions of the Community.
06 — New locations factors for mobile investment in Europe. 07 — Trade and foreign investment in the Community regions:
the impact of economic reform In Central and Eastern Europe. 08 — Estudio prospectivo de las regiones atlánticas. Europa 2000.
Study of prospects in the Atlantic regions. Europe 2000. Etude prospective des régions atlantiques. Europe 2000. Estudio prospectivo de las regiones atlántcas. Europa 2000.
09 — Financial engineering techniques applying to regions eligible under Objectives 1, 2 and 5b. 10 — Interregional and cross-border cooperation in Europe.
11 — Estudio prospectivo de las regiones del Mediterráneo Oeste. Evolution prospective des régions de la Méditerranée ouest.
Evoluzione delle prospettive delle regioni del Mediterraneo occidentale. 12 — Valeur ajoutée et ingénierie du développement local.
18 — The prospective development of the northern seaboard.
24 — Cohesion and the development challenge facing the lagging regions.
Forthcoming publications in this series
13 — Impact of the development of the Nordic countries on regional development and spatial organization in the Community.
14 — Development prospects of the central Mediterranean regions (the Mezzogiomo-Greece). 15 — The spatial consequences of the integration of the new German Länder into the
Community.
16 — The impact of the development of the countries of Central and Eastern Europe on the Community territory.
17 — Etude prospective des régions de l'Arc Alpin et Peri-Alpin. Studio delle prospettive delle regioni dell'Arco alpino e prealpino.
19 — L'impact sur le développement régional et l'aménagement de l'espace communautaire des pays du sud et de l'est méditerranéen (PSEM).
20 — Evolución prospectiva de las regiones interiores (y de los espacios rurales de baja densidad de población en la Comunidad).
Evolution prospective des régions intérieures (et des espaces ruraux de faible densité de population de la Communauté).
21 — The regional impact of the Channel Tunnel throughout the Community. 22 — The perspective development of the central and capital cities and regions. 23 — Guide to planning Tourism development in regional and local economies.
25 — In der Region für die Regionen Europas / Über die Aneignung eines neuen gewerksschaft-leichen Arbeitsfeldes.
Cataloguing data can be found at the end of this publication.
Luxembourg: Office for Official Publications of the European Communities, 1995
ISBN 92-826-9706-1
© ECSC-EC-EAEC, Brussels · Luxembourg, 1995
Reproduction is authorized, except for commercial purposes, provided the source is acknowledged
Preface
Each year, the Directorate-General for Regional Policy and Cohesion of the European
Commission launches a number of studies in the field of regional policy and regional planning. These studies mainly aim at providing a basis for policy formulation internally, as well as the pre-paration of programmes and initiatives and a basis for analysing the impact of current or planned activities. The most interesting or innovative of these are published in a series entitled Regional development studies.
With this series, the Directorate-General hopes to stimulate discussion and action in a wider sphere on the research results received. The publication of the studies is addressed to politicians and decision-makers at European, regional and local level, as well as to academics and experts in the broad fields of issues covered.
It Is hoped that by publicizing research results the Commission will enrich and stimulate public debate and promote a further exchange of knowledge and opinions on the issues which are considered important for the economic and social cohesion of the Union and therefore for the furure of Europe.
Foreword
This report is based upon the results of a study undertaken by the Groupe de recherche européen sur les milieux innovateurs (GREMÌ) under the direction of Professor Roberto Camagni and Professor Michel Quevit, and involving national research teams in Italy, Portugal, Spain, Ireland and Greece.1 Comparative research
was also undertaken in the USA. The original report set out to examine the economic performance of the Community's lagging regions in recent years, the impact of European integration on these regions and the effectiveness of regional policy initiatives at the national and Community level. In particular, the original study set out to examine the policy implications of adopting an approach in terms of local 'milieux' and innovation networks. This report updates the original GREMÌ report by including Eurostat data, which" were not available at the time, and expanding the analysis.
The production of this document has benefited greatly from discussion and debate between the research team and the Scientific Committee acting on behalf of the Directorate-General for Regional Policy. Particular thanks are therefore due to the members of that Committee: Professor K. Allen, Professor J. Goddard, Professor P. Van Rompuy and Professor R. Velasco.
1 R. Camagni and M. Quévit, Development prospects of the Community's lagging
Table of confenfs
List of maps 8
Executive summary 11
Résumé 17
CHAPTER 1 - Introduction 23
1.1 Regional disparities in the Community 23
1.2 Structure of the report 24
1.3 Objective 1 regions 24
CHAPTER 2 - Identifying converging and diverging regions 27
2.1 Overview 27 2.2 The recent performance of Objective 1 regions: winners and losers 27
2.3 Performance of Objective 1 regions: GDP per capita 28 2.4 Performance of Objective 1 regions: productivity 29
2.5 The performance of single regions 29
2.6 Regional growth patterns 30
2.7 Conclusions 31
CHAPTER 3 - Analysis of the Objective 1 situation 35
3.1 Introduction 35 3.2 General observations 35
3.3 Country profiles 35 3.4 Synthesis of profiles 42 3.5 Conclusions 43
CHAPTER 4 - Explaining the development patterns of the 1980s 45
4.1 Introduction 45 4.2 The theoretical background 45
4.3 Statistical analysis 46 4.4 The concept of 'milieu innovateur' 49
CHAPTER 5 - EC integration and development prospects 55
5.1 Introduction 55 5.2 The Internal market programme 55
5.3 Sectoral impacts 58 5.4 The Impact of the internal market on Objective 1 63
5.5 Monetary union 64 5.6 Conclusions 65
CHAPTER 6 - A policy for Objective 1 regions in the 1990s 67
Executive summary
Main aim of the report Diverging and converging regions
1. The report analyses the economic performance of the Objective 1 regions in the 1980s and makes an assessment of the impact of 1992 on these regions.
2. The performance of Objective 1 regions was diverse. Indeed, a broad trend was towards greater heterogeneity amongst the group of lagging regions. Thus some regions are catching up, some are falling still further behind (see Table 1).
Table 1 : The performance of Objective 1 regions in the 1980s Member
State Italy
UK Ireland Greece
Spain
Portugal
France
Converging regions Abruzzi Molise
All regions East. Macedonia Ionian Isles S. Aegean Isles Crete
Andalucía
Castilla La Mancha Murcia
Canarias Valencia Lisboa Norte
Mixed evidence regions
Puglia Sicilia Sardegna Northern Ireland
Galicia Castilla Leon Extremadura
Algarve Centro Alentejo
Diverging regions Basilicata Campania Calabria
Cent. Macedonia Attica Cent. Greece West. Greece Epirus N. Aegean Isles West. Macedonia Thessalya Peleponnese Asturias
Corsica
3. In terms of competitive performance in the 1980s, the lagging regions can be classified under four headings.
• Relatively few regions, even among the conver ging regions, showed strong signs of enjoying a vir tuous growth cycle of increasing productivity and employment (NE quadrant in Figure 1).
• Many regions, often those classified as conver ging regions, were forced into drastic rationalization of productive capacity. This resulted in good pro ductivity growth, but at the expense of falling employment and rapidly rising unemployment (NW quadrant).
• The largest number of lagging regions are fol lowing a sheltered development trajectory, storing up problems for the future. These are regions which failed to modernize their economy (low productivity growth), but were able to maintain or increase employment levels, often as a result of explicit or implicit policies of assistance or protection (SE quadrant).
• A small group of regions, finally, seems to have entered a vicious cycle or deindustrialization, where employment cuts and closures are unable to restore competitiveness and job losses continue (SW quadrant).
4. There is a risk that the regions in the vicious cycle group (and in a later stage perhaps also some of
the regions in the sheltered development group) would not be able to find a place in the international division of labour and drop out of the international economy completely. Their survival will then depend almost entirely on income transfers from economi cally stronger regions in the same Member State or from other Member States.
Explaining differences in economic performance
5. Obviously, national factors play a major role in determining interregional disparity; the generally good performance of Irish regions and the generally bad performance of Greek regions can be put down to their relative macroeconomic policies. Sound macroeconomic policies and investment in infra structure are undoubtedly essential for longterm regional development. It should be noted that all Objective 1 regions still have important infrastructur al gaps; this has usually hindered, but not always prevented, development.
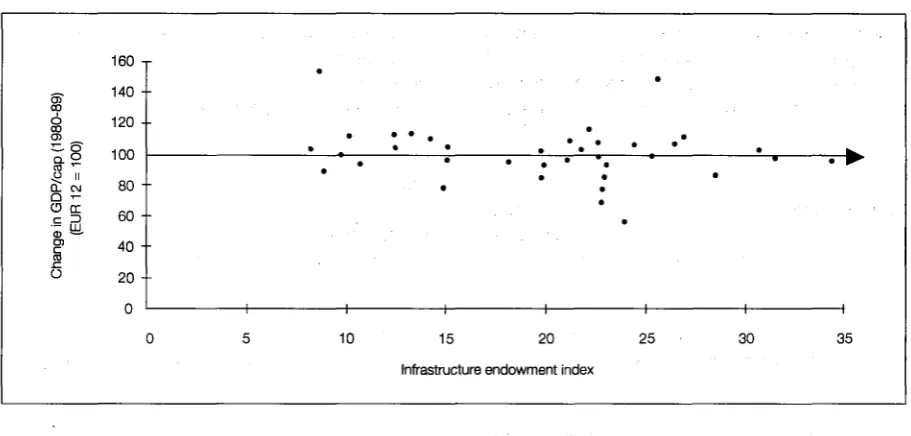
6. However, there is diversity of performance within the same macroeconomic context; even within poorly performing regions there may be some local success stories. Nor is good infrastructure a gua rantee of success. The best that can be said is that the lack of infrastructure and a bad macroecon omic context hinder development. Even then, there
Figure 1 : Regional growth patterns of the Objective 1 regions, 198088
125
S 120 115 ■5. 105
100
a. o_ a
CD
95
90
--85 80
12 • ALEN
IRL . CEN
• NOR . ALG
LIS
•
AST
I 1 1
EUR 12 = + 1.6%
PUG
• ·
NIRL
•
NAEG CL GAL. BAS
H 1
• CAN
• EXT MUR ION cLM
CRET MOL. . CAM . AND
•
• · THES SIC PEL
W G R . ATT
H 1 1
•
VAL
•
EPIR
I
• EMAC
^
' SAEG . ABR SAR CAL CMAC • • WMAC • CGR
I 1 1 1
-10 6 4 2 0 2 4 6
Change in employment (19801988)
10 12 14 16
are examples of success in regions with poor infra-structure (e.g. Ireland) or with a poor macro-econ-omic environment (e.g. Crete). There is undoubtedly more to development than just infrastructure and macro-economics. Therefore, a 'bad' national context does not condemn regions to underdeve-lopment. At the same time, this stresses the impor-tance of decentralization of decision-making power, especially in countries where the national economic environment is poor.
7. The routes to success are varied; tourism has been important in the Balearios, industry in Abruzzi. For both regions and local successes the task is therefore to identify common factors behind suc-cess to see if they can be reproduced elsewhere. Traditional theoretical explanations for success are considered. A review of the literature and a statisti-cal analysis carried out in this study suggests that there is no conclusive evidence in support of any particular theory: for each case that fits one theory, other cases can be found that clearly contradict the theory.
8. From this statistical analysis of regional economic structure and its relationship to performance, a number of conclusions can be drawn. Structural factors did not provide a statistically significant explanation of the performance of each region; cor-relation and regression analyses confirmed that structural factors may explain the level of regional GDP, but not the growth rate. The presence of a single asset or benefit does not in itself encourage or prevent development. Thus, good road infra-structure, a highly qualified labour force or low labour costs did not automatically lead to a good local performance. At the same time, a peripheral location, or agricultural specialization did not in themselves prevent development opportunities.
9. The absence of an explanation based on the tra-ditional theories necessitates an examination of more unconventional approaches which emphasize the less tangible development factors, factors which are often difficult to measure and quantify. The study examined the concept of 'milieu innovateur'. An innovative milieu is defined as the set of relation-ships occurring within a geographical area which bring unity to a production system, economic actors, and an industrial culture, generating a local-ized dynamic process of 'collective learning' and acting as an uncertainty-reducing mechanism in the innovation process. The model is an endogenous
growth one, in that it emphasizes the local frame-work. Specialization is the key, leading to high synergy in the regional economy.
10. The more conventional factors such as edu-cation and infrastructure are still important in this story (indeed, the abundance of skills is possibly crucial). But the coherency of the regional economy and intangible factors such as informal networks are also part of the explanation for economic success. Therein lies the attractiveness of the model; not only can the processes outlined in the model be obser-ved in parts of Italy and elsewhere in the EC, but also an explanation is provided for the lack of auto-matic linkage between success and single factors such as infrastructure. The important thing is not any single feature of the economy, but that it forms a coherent whole.
11. Innovative milieux do exist in Objective 1 regions, but they are rare and incipient. The macro-economic context and local framework affects their development (e.g. the backwardness of the social environment in Greece and the relative absence of local entrepreneurship and synergy in Ireland). Inno-vative milieux were found within converging and mixed evidence regions. Encouragingly, some milieux were present in diverging regions. There is therefore material for policy to build on. Provided that they are exploited coherently, some seemingly negative factors can play a positive role. For example, a peripheral location can have advantages for environmental protection and possible tourist development.
12. The fact that local resources are utilized in the development of an innovative milieu does not mean that the process can only start as a product of In-digenous entrepreneurship. The catalyst for many local success stories in central Italy, for example, was an external firm setting up to take advantage of the skills already there. However, if external invest-ment is attracted to a region, it has to link up with elements other than a cheap labour force or an un-spoilt environment if a self-sustaining development process is to emerge. A link with an external dy-namic is crucial even in cases where the develop-ment process is started by indigenous entrepre-neurship. The potential for continued development relying solely on local· capabilities is limited in the long run. Cooperation with external institutions, firms or research centres is important, as is the importance of the external dynamic for product and
market diversification, in order to continually recrea-te local competitiveness and innovative capacity. This is even more important in lagging regions where conditions for the generation of local innova-tive milieux are weak.
The impact of European integration
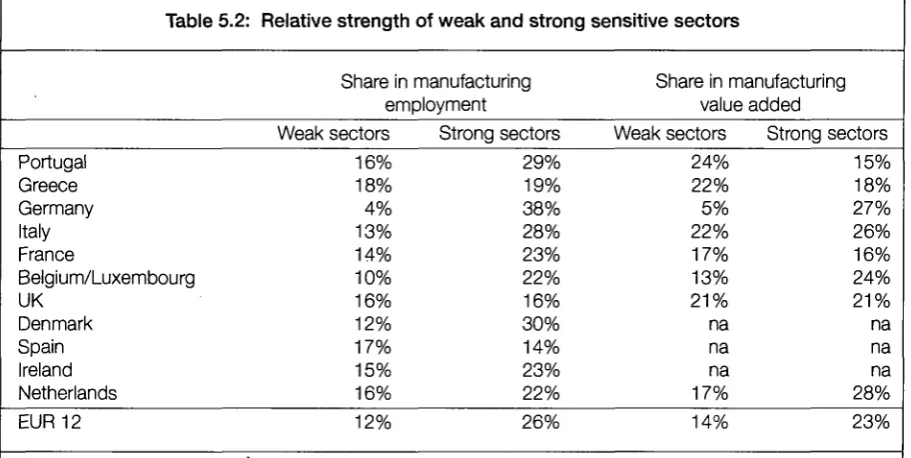
13. There is a diversity of experience in the different regions. Contrary to what is sometimes argued, sensitive sectors2 are strongly represented in some
lagging regions, while in others their share of total employment is minimal.
14. The industrial structure of the Objective 1 re-gional economies differs from that of the more developed Member States. In particular, Portugal and Greece are less well integrated and rely upon inter-industry specialization in labour intensive, low technology sectors.
15. The likely impact of 1992 upon Greek and Por-tuguese regions is to encourage further inter-indus-try specialization in sectors such as textiles, clothing and footwear. In the short term this may have advantages, but in the longer term these sectors will be subject to competition from developing countries and future adjustment costs will be high. There is therefore a need to modernize the Object-ive 1 economies, with large scale investments needed to close infrastructure and knowledge gaps and thus enable the upgrading of their economies and a move towards an intra-industry development scenario. One problem is that the scale of the investment needed might not be forthcoming from national sources in a transition period, due to the disciplines imposed by monetary union.
Policy implications
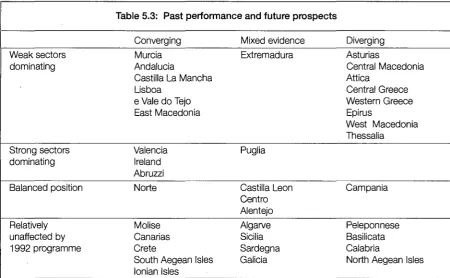
16. From a Community regional policy point of view, the main challenge of the 1990s is to maintain the momentum of convergence in the successful regions and to 'turn round' the situation in the sta-tionary or diverging regions.
17. Given that there are no standard policy recipes on offer, the fundamental aim of EC policy must be
2 'Sensitive sectors' are sectors which are currently protected by non-tariff barriers or where barriers prevent the exploitation of economies of scale or where barriers allow the retention of price dicrepancies between Member States. It Is thought that these sectors would be particulary 'sensitive' to the completion of the internal market when such barriers are removed.
to advise, encourage and warn. To advise, first of all, on the lessons of successful experience else-where, on the creation or consolidation of technical and organizational capabilities at local, regional and national levels, and more generally on the effective management, piloting and assessment of develop-ment efforts. Secondly, to encourage the setting of clear and transparent goals expressing a credible ambition to reduce disparities in specified ways so as to prepare for closer economic integration, and to provide financial support commensurate with the ambition and the practical organization put in place to achieve that ambition. To warn finally, those who are at risk of diverging and those who are clearly diverging, of the likely medium-term consequences of a failure to turn round the situation: the risk, in short, of a growing dependency on transfers from outside.
18. Regions should ensure that policy success is measurable, that results are regularly monitored, and that the public and political authorities are regu-larly informed of progress. A determined effort should also be made to inform and involve the pri-vate sector and general public in the public sectors' development policy, and especially to ensure full information on the various grant systems or other forms of support available. Openness and transpar-ency are key words for public policy in the 1990s.
19. Maintaining the momentum of convergence implies continued progress towards reducing reli-ance on lower labour costs and labour-intensive production. Regions must progressively establish the type of intra-industry specialization typical of more advanced countries, and develop advanced niches within their traditional sectors. The same approach applies to specialization in markets ser-vices, tourism in particular. Unit labour cost advan-tages should be maintained through productivity increases rather than through wage compression. This represents a major challenge for the lagging regions, because, to make significant progress towards closing the development gap, they will not have to 'run as fast as, but twice as fast as' the economically most prosperous regions.
20. Not all regions will be able to develop capabi-lities for innovation from internal resources. For this second category of regions, emphasis must be put on external investment as the main catalyst for local economic development. Such a policy will need to be based on a realistic and objective analysis of the
attractiveness of the region concerned to external Investors, and steps should be taken to improve the attractiveness in consequence. Moreover, for this to be successful as a means of stimulating local de-velopment, determined attempts must be made to deliberately embed external investment into the local environment.
21. A theme of growing importance should be the provision of information. Information is one of the key factors in creating Interaction between local and external economic forces; in networking between firms and institutions, and more generally in suc-cessfully adapting to changing markets and techno-logical environments. How information provision and interchange is organized and provided are vital questions in the development process. There is a role for specialized intermediaries to play, helping to put Individuals, firms and institutions in contact with appropriate information. There ¡s a role for the use of technology to provide and access information.
22. Secondly, regions need to reinforce their efforts to develop human capabilities in two ways. First there is a need to upgrade the skills and abilities within a region at all levels. Second, there is a need to improve the training of those individuals who will act as intermediaries or development agents. The letter's proactive role within a regional economy is, in any approach, aiming to influence the prevailing entrepreneurial culture, one of the main agents of change.
training. What must be avoided above all, is to encourage a form of sheltered development, isola-ted from market realities, or, worst of all, to permit by means of progressively greater financial trans-fers,' a rising standard of living despite a diminishing level of productive activity due to an unwillingness to change out-dated and inappropriate economic and social practices.
23. Thirdly, the institutional framework within which policy is designed and implemented needs to be decentralized, coordinated but flexible. In many regions, this framework may not exist and it is diffi-cult to create de novo. A major task will therefore be to ensure that an effective and decentralized net-work of regional institutions exists, particularly in those countries where decision-making is highly centralized, so that policy can be managed from the local level, possibly by a development agency, with the active participation of other relevant local actors.
24. In conclusion, success in an uncertain and fast-changing world is determined by a high level of Information, widely shared, a high level of skill attainment, a prevailing entrepreneurial culture, and a well-organized institutional framework. These are the qualities that development policies should seek to promote going beyond meeting basic require-ments for infrastructures, education and vocational
Contributors to the report:
Editing of this report:
D. Gibbs, Manchester Polytechnic
Quantitative data and national reports:
S. Boeckhout
S. O'Siochru and D. Redmond J. Ferreira do Amaral
J. R. Cuadrado Roura, T. Mancha and Ü.M. Mella L. Senn and A. Bramanti
N. Konsolas R. Gordon
Core research groups:
Milan: R. Capello, E. Marelli, T. Pompili, R. Rabellotti
Louvain-la-Neuve: J.-P. Binarne, A. Dangoisse, H. Desterbecq. P. Van Dore.
Résumé
PRESENTATION SUCCINCTE
Finalité principale du rapport
1. Le rapport analyse les performances économiques respectives des régions de l'objectif n° 1 dans les années 80 et ¡I en évalue les retombées en 1992.
Régions divergentes et régions convergentes 2. Les résultats obtenus au regard de l'objectif n° 1 ont varié d'une région à l'autre. La tendance lourde atteste une hétérogénéité accrue dans le groupe des régions en retard de développement. Autrement dit, certaines régions comblent en partie leur retard alors que d'autres sont de plus en plus distancées (voir tableau 1).
Tableau 1
État membre
Italie
Royaume Irlande Grèce
Espagne
Portugal
France -Uni
performance des régions de
Régions convergentes
Abruzzes Molise
Toutes régions Macédoine orientale îles Ioniennes îles du sud de la mer Crète
Andalousie
Castille-La Manche Murcie
Canaries Valence Lisbonne Nord
Egée
'objectif n° 1 dans les années 80
Réglons mixtes
Pouilles Sicile Sardalgne Irlande du Nord
Réglons divergentes
Basilicate Campanie Calabre
Macédoine centrale Attlque Grèce centrale Grèce occidentale Épire îles du nord de la mer Egée Macédoine occidentale Thessalie Péloponnèse Galice
Castille-León Estrémadure
Algarve Centre Alentejo
Asturies
Corse
3. Si l'on se réfère à la compétitivité au cours des années 80, les réglons en retard peuvent être clas sées sous quatre rubriques.
• Relativement rares sont les régions, y compris parmi les régions convergentes, où l'on a pu voir des signes manifestes attestant un cycle de crois sance vertueuse, dans lequel la progression de la productivité va de pair avec celle de l'emploi (quart nordest de la figure 1).
• Nombre de régions d'ailleurs souvent classées parmi les régions convergentes ont dû procéder à une rationalisation impitoyable de leur capacité de production, d'où une croissance satisfaisante de la productivité, obtenue au prix de réductions d'effectifs et d'une croissance rapide du chômage (quart nord ouest).
• La plupart des régions en retard se développent dans un contexte de protection artificielle, ce qui recèle des problèmes pour l'avenir. Il s'agit de régions qui ne sont pas parvenues à moderniser leur économie (faible croissance de la productivité), mais qui, souvent, n'ont pu maintenir ou accroître l'emploi que grâce à des mesures d'aide ou de pro tection explicites ou implicites (quart sudest). • Enfin, un petit groupe de régions semblent être entrées dans une spirale de déclin ou de désindus trialisation, en ce sens que les diminutions d'effec tifs et les fermetures d'entreprises ne permettent pas de restaurer la compétitivité et que l'érosion de l'emploi s'y poursuit (quart sudouest).
4. Il n'est pas exclu que les régions appartenant à la quatrième des catégories précitées (et peutêtre ulté rieurement quelquesunes aussi des régions relevant de la troisième de ces catégories) se révèlent hors d'état de trouver leur place dans la division Internatio nale du travail et se voient totalement exclues de l'économie internationale. Leur survie serait alors presque entièrement tributaire de transferts écono miques en provenance de régions plus prospères du même État membre ou d'autres États membres.
Explication des différences
en matière de performance économique 5. Il est manifeste que les facteurs nationaux jouent un rôle considérable en matière de disparités entre réglons: si, en général, les résultats se révèlent bons dans les régions irlandaises et médiocres dans les régions grecques, on peut y voir une cor rélation avec les politiques macroéconomiques nationales respectives. À noter que toutes les régions de l'objectif n° 1 accusent encore des retards importants en ce qui concerne les infra structures et que ces retards ont le plus souvent, mais pas toujours, entravé le développement.
6. Il reste que les résultats obtenus peuvent varier dans le même contexte macroéconomique: même dans des régions faibles, il peut y avoir de brillantes réussites à l'échelon local; Inversement, l'existence d'une bonne infrastructure ne garantit pas le suc
Figure 1 Représentation de la croissance dans les régions de l'objectif n° 1 (19801988)
125
120
~ 115 oo 00 2 110
S. 105
I 100
--; 9 5
a.
çg 90
--CL ■o 85
--• A L E N
i
EUR 12 = + 1.6%
IRL
. CEN ALG * N 0 R
. A L Ü p u G
LIS · .
NIRL
•
NA*EG CL AST
G A L . BAS
• CAN
• EMAC
. EXT MUR
ION cLM
CRET MOL. . CAM . AND
•
• · THES SIC PEL
W G R · ATT
* SAEG V A L . ABR
SAR
CMAC EPIR
•
WMAC
• CGR
w .
W
CAL
•
+ -r- ■+- -+- -+-
-+-■12 -10 4 2 0 2 4 6
Variation de l'emploi (19801988)
10 12 14 16
ces. Tout ce que l'on peut dire, c'est que le manque d'Infrastructures et un mauvais environnement macro-économique entravent le développement, encore que l'on puisse citer des exemples de réus-sites dans des régions mal pourvues en infrastruc-tures (en Irlande) ou pâtissant d'un environnement macro-économique médiocre (en Crète). Il est cer-tain que le développement ne dépend pas unique-ment de l'infrastructure et des facteurs macro-éco-nomiques. C'est pourquoi un «mauvais» contexte national ne condamne pas au sous-développement les régions concernées. Les observations qui précè-dent illustrent bien l'Importance que revêt la décen-tralisation du pouvoir décisionnel, en particulier là où l'environnement économique national est médiocre.
7. Différents itinéraires peuvent mener au succès; c'est ainsi que le tourisme a joué un rôle Important aux Baléares et l'Industrie dans les Abruzzes. Qu'il s'agisse des réglons ou des réussites locales, il faut donc identifier les facteurs communs expliquant tel ou tel succès et se demander s'ils sont reproduc-tibles ailleurs. Les explications théoriques fournies en la matière ne sont pas perdues de vue; si l'on exa-mine la littérature spécialisée et l'analyse statistique figurant dans dans la présente étude, on ne voit aucun élément probant attestant le bien-fondé de telle ou telle théorie: pour un cas qui valide une théo-rie, on peut en citer plusieurs autres qui l'invalident.
8. Quelques conclusions peuvent être tirées de la pré-sente analyse statistique de la structure économique régionale et de la corrélation existant entre celle-ci et les résultats obtenus. Les facteurs structurels n'ont pas permis d'expliquer de manière statistiquement significative la performance de chaque région; quant aux analyses de corrélation et de régression, elles ont confirmé que les facteurs structurels peuvent expliquer le niveau du PIB régional, mais pas le taux de crois-sance. En soi, l'existence de tel ou tel atout, de tel ou tel avantage, ne favorise ni n'empêche le développe-ment. C'est ainsi qu'une bonne infrastructure routière, la disponibilité d'une main-d'œuvre hautement qualifiée ou le faible coût-horaire du travail n'ont pas automati-quement débouché sur de bons résultats à l'échelon local. À l'inverse, une situation excentrée ou une spé-cialisation agricole n'ont pas constitué intrinsèquement des freins au développement.
9. L'absence d'explication fondée sur les théories traditionnelles oblige à examiner des approches moins conventionnelles mettant l'accent sur des fac-teurs de développement' moins tangibles et, par là
même, souvent difficiles à mesurer et à quantifier. L'étude a porté en partie sur la notion de «milieu innovateur», par quoi l'on entend l'ensemble des relations qui, sur un territoire donné, fonctionnent comme un facteur d'unité au bénéfice d'un système de production, des acteurs économiques et d'une culture industrielle, ce qui déclenche localement un processus dynamique d'«apprentissage collectif» et qui allège le poids des incertitudes propres à inhiber l'innovation. Il s'agit là d'un modèle de croissance endogène, en ce sens qu'il met l'accent sur le cadre local. La spécialisation est l'élément capital, aboutis-sant à une forte synergie dans l'économie régionale.
10. Les facteurs plus classiques, tels que l'éduca-tion et l'infrastructure, continuent en l'occurrence de jouer un rôle important (et même vital lorsqu'il s'agit des compétences auxquelles on peut faire appel). Il n'en demeure pas moins que la cohérence de l'économie régionale et des facteurs intangibles tels que les réseaux informels expliquent eux aussi, en partie, les résultats économiques. Là réside l'intérêt du modèle, intéressant en ce sens que les proces-sus cernés dans le modèle peuvent être observés ici et là en Italie et ailleurs dans la Communauté européenne, mais aussi qu'il fournit une explication quant à l'absence de corrélation automatique entre la réussite et divers facteurs tels que l'infrastructure. Ce qui importe, ce n'est pas tel ou tel aspect de l'économie, mais sa cohérence globale.
11. Les milieux innovateurs existent assurément dans les régions de l'objectif n° 1, mais ils sont rares et encore peu implantés. Le contexte macro-économique et l'environnement local retentissent sur leur développement (voir l'arriération de l'envi-ronnement social en Grèce et le relatif effacement des dirigeants d'entreprise locaux ainsi que le faible degré de synergie en Irlande). Ces milieux innova-teurs se rencontrent tant dans les régions conver-gentes que dans les régions «mixtes», et quelques-uns aussi, ce qui est encourageant, dans les régions divergentes. Autrement dit, il existe une base sur laquelle peut s'appuyer la politique à mettre en œuvre. Pourvu qu'on sache en tirer parti, certains facteurs apparemment négatifs peuvent jouer un rôle 'positif. À titre d'exemple, une situation excentrée peut présenter des avantages en ce qui concerne la protection de l'environnement et les possibilités de développement touristique.
12. Le fait que des ressources locales soient utilisées pour développer un milieu innovateur ne signifie pas
que le déclenchement du processus doive nécessai-rement émaner du tissu entrepreneurial indigène. C'est ainsi que bon nombre de réussites locales enre-gistrées en Italie centrale ont été catalysées par l'éta-blissement d'une firme extérieure à la région, dési-reuse de bénéficier des compétences existant sur place. Toutefois, si une région attire un Investissement extérieur, l'existence d'une main-d'œuvre bon marché ou d'un environnement intact n'est pas suffisante pour amorcer un processus de développement durable. Une dynamique externe est absolument indispen-sable, même dans les cas où le tissu entrepreneurial Indigène est à l'origine du processus de développe-ment. Un développement qui serait entièrement tribu-taire de capacités locales trouverait fatalement ses limites à longue échéance. La coopération avec des institutions, des firmes ou des centres de recherche extérieurs revêt une grande Importance pour la diver-sification des produits et des marchés si l'on entend que la compétitivité locale et la capacité d'innovation ne soient jamais prises en défaut. Cet impératif est encore plus prioritaire dans les régions en retard de développement offrant des conditions médiocres pour la constitution de milieux innovateurs locaux.
Les effets de l'intégration européenne
13. La situation varie d'une région à l'autre. Contrai-rement à ce qui se dit parfois, les secteurs sensi-bles*1) sont fortement représentés dans certaines
régions en retard de développement, alors qu'ils ne représentent ailleurs qu'une part minime de l'emploi. 14. La structure industrielle des économies régio-nales relevant de l'objectif n° 1 diffère de celle qu'on trouve dans les États membres plus développés. Le Portugal et la Grèce en particulier, moins bien inté-grés, sont tributaires d'une spécialisation intersec-torielle à forte intensité de main-d'œuvre et à faible contenu technologique.
15. L'année 1992 aura probablement pour effet d'encourager les régions de la Grèce et du Portugal à intensifier leur spécialisation dans des secteurs tels que le textile-habillement et la chaussure. S'il est permis d'escompter des avantages à court terme d'une telle évolution, il n'empêche que les secteurs en question seront, à plus longue éché-ance, affrontés à la concurrence des pays en vole de développement et que le coût social de l'adap-tation future sera élevé. Aussi est-il nécessaire de moderniser les économies relevant de l'objectif n° 1, en réservant les investissements à grande échelle à
la mise à niveau des infrastructures et au rattrapage des retards en matière de connaissances, moyen-nant quoi les économies en question pourraient pro-gresser conformément à un scénario de développe-ment Industriel global. Le problème est que le volume de l'Investissement requis peut ne pas correspondre aux possibilités des sources de financement natio-nales dans une période de transition, compte tenu des contraintes imposées par l'Union monétaire.
Conséquences politiques
16. Au regard de la politique régionale de la Commu-nauté, le principal défi des années 90 est de mainte-nir le rythme du processus de convergence dans les réglons prospères et d'Inverser la tendance dans les réglons qui stagnent ou qui prennent du retard. 17. Étant donné qu'il n'existe pas de recettes toutes faites, la politique de la Communauté européenne doit viser avant tout à conseiller, à encourager et à mettre en garde. Les conseils prodigués doivent, en premier lieu, faire connaître les enseignements tirés des succès enregistrés ailleurs, porter sur la création et sur la consolidation de capacités techniques et organisationnelles aux niveaux local, régional et national et, plus généralement, avoir trait aux condi-tions de l'efficacité quant à la gestion, au pilotage et à l'évaluation des actions de développement. Il s'agit ensuite d'encourager la définition d'objectifs clairs et cohérents exprimant une volonté crédible de réduire les disparités selon des modalités déterminées, de manière à frayer les voies d'une intégration écono-mique plus étroite, et de fournir des moyens finan-ciers qui soient à la mesure de l'ambition affichée et de l'organisation pratique mise en place dans cette perspective. Il faut enfin mettre en garde les régions qui risquent de diverger et celles où le processus de divergence est déjà manifeste, en leur exposant les conséquences qui résulteraient probablement à moyen terme d'une impossibilité de redresser la situation, c'est-à-dire en résumé le risque d'être de plus en plus tributaires de transferts financiers en provenance de l'extérieur.
18. Il appartient aux régions de faire en sorte que l'on puisse mesurer les résultats de la politique mise en œuvre, que ces résultats soient contrôlés à
inter-1 On entend par là des secteurs dans lesquels ¡I existe actuellement des obstacles non tarifaires assurant une certaine protection, ou d'autres obstacles qui empêchent de bénéficier d'économies d'échelle ou qui permettent de maintenir des disparités de prix entre États membres. Ces secteurs sont cen&âs être particulièrement «sensibles» å l'élimination des obstacles en question, inhérente à la réalisation du grand marché.
valles réguliers et que la population et les autorités politiques soient périodiquement informées des pro-grès accomplis. De grands efforts s'Imposent éga-lement en ce qui concerne l'information et la partici-pation du secteur privé et du grand public quant à la politique de développement du secteur public, et ¡I convient tout particulièrement de veiller à une Information exhaustive à propos des divers sys-tèmes de subventions ou autres types d'aide dispo-nibles. Ouverture et transparence doivent être les mots d'ordre essentiels de la présente décennie.
19. Si l'on veut maintenir le rythme du processus de convergence, ¡I faut s'efforcer de devenir moins tribu-taire d'une main-d'œuvre à bon marché et d'une production à forte intensité de main-d'œuvre. Il Importe que les réglons adoptent progressivement le type de spécialisation industrielle propre aux pays plus avancés et qu'elles développent des créneaux d'excellence au sein de leurs secteurs traditionnels. Il en va de même de la spécialisation dans diverses activités de services, le tourisme en particulier. Mieux vaudrait maintenir les avantages inhérents au coût unitaire du travail par des gains de productivité que par des réductions de salaire. C'est là pour les régions en retard de développement un redoutable défi, car si elles veulent progresser notablement dans la voie du rattrapage, elles devront «courir non pas aussi vite, mais deux fois plus vite» que les autres.
20. Toutes les réglons ne seront pas en mesure de se doter de capacités d'innovation en mobilisant uni-quement leurs propres ressources. Pour les réglons concernées, il faudra privilégier l'apport de capitaux extérieurs en tant que catalyseur principal du déve-loppement économique local. Pareille politique devra être fondée sur une analyse raisonnable et objective de l'attractivité de la région en cause pour les inves-tisseurs extérieurs et il conviendra de prendre les ini-tiatives éventuellement nécessaires pour améliorer comme il convient les attraits de la région. Si l'on veut réussir à stimuler le développement économique
local en utilisant cette méthode, il faudra, de surcroît, avoir la volonté d'insérer harmonieusement l'Investis-sement extérieur dans le contexte local.
21. L'information est un thème appelé à prendre de plus en plus d'importance; elle est un des facteurs déterminants pour susciter une interaction entre forces économiques locales et extérieures, pour établir un réseau de relations entre entreprises et institutions et, plus généralement, pour promouvoir avec succès l'adaptation à un monde où les
mar-chés et les techniques évoluent. Dans le domaine de l'Information, l'offre ainsi que les modes d'orga-nisation et de circulation sont d'une importance capitale pour le processus de développement. Des intermédiaires spécialisés ont ici leur rôle à jouer pour permettre aux particuliers, aux entreprises et aux institutions d'avoir plus facilement accès aux informations adéquates, grâce à la mise en œuvre des techniques appropriées.
22. Il faut, en second lieu, que les régions intensi-fient leurs efforts visant à développer les capacités humaines en fonction de deux objectifs, qui sont, respectivement, d'améliorer les compétences et les aptitudes dans la région concernée, et de mieux former les personnes qui sont appelées à devenir des acteurs du développement. Dans une écono-mie régionale, la qualité et la résolution des acteurs du développement dans toute approche visant à Influer sur la culture d'entreprises existantes sont un des principaux facteurs de changement.
23. En troisième lieu, sans que la flexibilité en pâ-tisse, la décentralisation et la coordination s'impo-sent en ce qui concerne le cadre institutionnel dans lequel la politique est conçue et mise en œuvre. Dans bon nombre de régions, ce cadre institutionnel peut faire défaut et il est difficile de le recréer. Il importera donc de veiller à l'existence d'un réseau efficace et décentralisé d'institutions régionales, en particulier dans les pays où le pouvoir décisionnel est fortement centralisé, de telle sorte que la politique adoptée puisse être gérée au niveau local, si possible par une agence de développement, avec la participation ac-tive d'autres organismes compétents.
24. En conclusion, la réussite dans un monde incer-tain en mutation rapide passe par une information de qualité largement partagée, par le haut niveau des aptitudes individuelles, par une culture d'entreprise bien assimilée et par un cadre institutionnel solide. Ce sont là les qualités que les politiques de dévelop-pement devraient s'attacher à promouvoir, au-delà de la satisfaction des besoins fondamentaux en matière d'infrastructures, d'enseignement et de for-mation. Il faut éviter par-dessus tout d'encourager un type de développement artificiellement protégé, Isolé des réalités du marché, ou, pis encore, d'élever le niveau de vie par un accroissement progressif des transferts financiers malgré une baisse de l'activité productive dans les cas où celle-ci serait imputable au refus de modifier des pratiques économiques et sociales obsolètes et inadéquates.
Introduction
1.1 Regional disparities
in the Community
The last 30 years have seen considerable change in regional development patterns within the European Community. Between the early 1960s and the mid-1970s, regional income disparities had declined significantly. Unfortunately this favourable trend came to an abrupt halt in 1975. In the following decade the first oil shock convergence gave way to a regressive phase which returned inter-regional disparities to the levels of the start of the early 1970s. The main factors responsible for this disap-pointing development were the deterioration of the general economic climate, the end of migration from weaker to stronger Member States as a consequence of the recession, and the emergence of a new industrial paradigm based upon the use of information technologies. However, the situation seems to have stabilized around the middle of the 1980s and recent data suggest a slight reduction in the overall level of disparities since 1986 under the influence of steady growth in Spain, Portugal and Ireland. Nevertheless, ¡n spite of this, the income gap between the Community's poorest and richest regions remains very wide. In 1989 income per capita in the top 10 regions remained more than three times that of the bottom 10 regions. Reduc-tion of these disparities remains a priority as an inte-gral part of creating a more cohesive Community.
While all Member States were affected by recession ¡n the 1970s and more vigorous economic growth from 1984 onwards, the impact on the
Commu-nity's lagging regions has not been straightforward. In some cases there has been convergence with the rest of the Community, in others there has been divergence. We cannot therefore see all lagging regions in the same light. Some are doing well, and can be classified as 'converging regions', on the verge of joining the rich areas of the Community, others are definite 'diverging regions', on the verge of entering a cumulative downward spiral. How can this heterogeneity be explained? Which factors have led to regional development? Can, or should, these be replicated in less successful regions? How will plans for greater Community integration affect future regional development? What are the Implications for policy formation and implementation?
This report on the development challenges facing the Community's lagging regions set out to answer these questions through investigating the future for the Objective 1 regions in the 1990s. It is based upon a longer report compiled by the Groupe de recherche européen sur les milieux innovateurs (GREMÌ) under the direction of Professor Roberto Camagni and Professor Michel Quevlt. This report updates the GREMÌ document and takes advan-tage of recently released data which were not avail-able for the original research.
The report examines the performance of the Com-munity's lagging regions over the 1980s with a view to identifying the prospects for development ¡n the 1990s and the policy initiatives needed to help achieve this. It ¡s Important to note that the context for development in the 1990s is different from that of the previous decade. The 1980s was a decade
that began in recession for the Community and ended ¡n fairly rapid economic recovery. As the report reveals, national differences and national macroeconomic policies played a key role in deve-lopment prospects at the regional level. The 1990s will be a decade ¡n which these national differences may assume a reduced Importance, particularly as the policies set in motion by the 1987 Single Euro-pean Act for economic and social cohesion take on concrete forms. Member States may increasingly operate within a Community-wide regulatory frame-work where national macro-economic policies be-come increasingly similar. This is not to argue that responses will be the same. The impact of Com-munity-wide measures will be filtered through a net of national and regional particularities to create spe-cific outcomes in spespe-cific places.
1.2 Structure of the report
The central Issue of this report is the difference bet-ween converging and diverging regions. Which regions are converging and which are diverging? What factors lead to convergent or divergent devel-opment? Will plans for greater Community Integration affect whether a region continues to win or lose? Can policy turn a diverging Into a converging region?
Chapter 2 analyses data on the economic perfor-mance of Objective 1 regions and tries to identify those regions which are converging and those which are diverging.
Chapter 3 gives profiles of the main Objective 1 areas of Greece, Spain, Ireland, Italy, and Portugal. Firstly, this continues the descriptive emphasis of Chapter 2. Secondly, in these countries Objective 1 areas form all or a large proportion of the national economy, and this is an opportunity to see whether there is a link between national economic context and policy on the one hand, and regional performance on the other. There is a clear tendency for regions in countries who pursue sound macro-economic policies to win and regions in other countries to diverge, but every coun-try has its converging as well as Its diverging areas. The inference ¡s that sound macro-economic policy is important but not sufficient.
Chapter 4 is an attempt to go deeper, analysing and explaining regional success or failure in terms of economic theory and in the light of available data.
Theories such as endogenous growth and 'innova-tive milieux' are advanced. Some regions fit one theory well, other regions will be better described by a competing theory. The conclusion is that each of the theories has some relevance but none of them is the explanation of regional success or failure.
Chapter 5 looks at prospects for the lagging regions ¡n the light of the Community's internal market pro-gramme. For lagging regions, the single market both offers new opportunities and threatens new problems. This chapter attempts to Identify those Objective 1 regions which seem to be in a strong position to benefit from the single -market process and those regions which are less well placed to take advantage of 1992.
Chapter 6 considers the policy implications of the rest of the report. In view of the different nature of problems and likely solutions from one region to another, and the uncertain effects of economic inte-gration, there ¡s no single 'miracle cure', but a menu of suggestions to be tailored to different circum-stances. In the absence of a clear recipe for suc-cess, policy should be continuously subject to criti-cal scrutiny to ensure that it is achieving the desired effects.
The annex provides a statistical update, showing the latest available Eurostat data on regional
Incomes and the trend.
1.3 Objective 1 regions
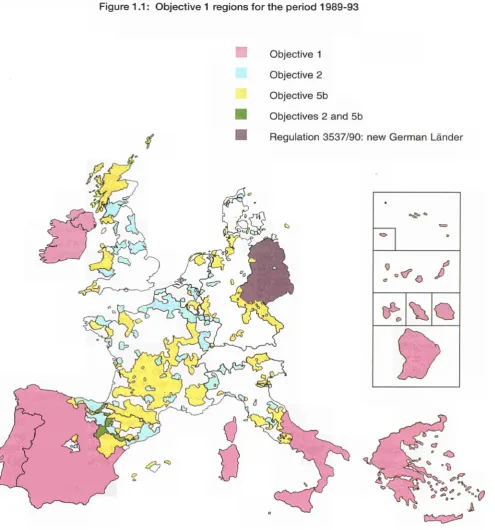
Finally in this Introduction, ¡t is worth outlining both the definitional basis for Objective 1 regions and their location. Lagging regions are taken, ¡n this report, to be the Objective 1 regions of the European Commu-nity for the period 1989 to 1993 (defined at the NUTS level II: i.e. nomenclature of territorial units for statis-tics). Objective 1 regions are defined as regions where GDP per capita is at least 25% below the Community average, although this threshold is relaxed in special circumstances (e.g. for Northern Ireland). The coverage ¡n 1989 was as follows:
Greece Entire country
Spain Andalucía, Asturias, Castilla Leon, Castilla La Mancha, Cueta y Melllla, Valencia, Extremadura, Gallcia, Canarias and Murcia
France Ireland Italy
Portugal UK
French overseas departments and Corsica
Entire country
Abruzzi, Basilicata, Calabria, Campania, Molise, Puglia, Sardegna and Sicilia Entire country
Northern Ireland.
All of these regions occupy peripheral positions within the Community, mainly to the south and west
(see Figure 1.1). They covered nearly 40% of the Community's territory and contained 21.7% of its total population. Average per capita income was 62% of the Community average.
[image:27.595.36.532.209.740.2]The French overseas departments do not figure in this report, due to problems of data availability. Lack of data also limited the extent to which the Azores, Madeira and Corsica could be Included in the study.
Figure 1.1 : Objective 1 regions for the period 1989-93
Objective 1 Objective 2 Objective 5b
Objectives 2 and 5b
Regulation 3537/90: new German Länder
0 ¿
°°«Ό
fi
Φ-^ o %>
G
D
c ^ c ^
Identifying converging
and diverging regions
2.1 Overview
As a prelude to examining the prospects for the Objective 1 regions in the 1990s, the performance of regions in the 1980s is examined. Within the cate-gory of Objective 1 regions, we need to differentiate between those regions which have experienced suc-cess and those which have performed poorly.
Before considering the specific performance of each region, an analysis of the aggregate performance of all Objective 1 regions with respect to the European average is instructive. During the first half of the 1970s, Objective 1 regions caught up substantially with the EC average income per capita. This was due to a combination of higher than average GDP growth and a process of population outmigration. In the first half of the 1980s, however, GDP growth in the Objective 1 regions was only marginally above the Community average. Moreover, population in the Objective 1 regions grew more rapidly than in the rest of the Community as migratory flows diminished or reversed. The result was that GDP per capita in Objective 1 regions (measured in purchasing power parities) fell slightly from 62.0% in 1980 to 61.5% in 1985. Due to the relative improvement in their eco-nomic performance in the second half of the 1980s the Objective 1 regions were able to make up for the ground lost in the early 1980s, and by 1989 per cap-ita GDP in these regions had increased to 62.1% of the Community average.
While the relative level of per capita GDP ¡n purchas-ing power parities in the Objective 1 regions hardly
changed between 1980 and 1989, a different trend occurred with respect to productivity. In 1980 labour productivity in the Objective 1 regions was 57.6% of the Community average (measured as GDP per person employed at current exchange rates). In the period 1980-88, the lagging regions underwent drastic rationalization of their productive capacity. In consequence, productivity Increased to 62.2% of the EC average by 1988. The result was an increase in surplus labour in many regions and rising levels of unemployment.
Against the background of the general trends in dis-parities within the Community, there have been dif-ferences between Member States, with some of the weaker countries achieving rates of growth above the Community average. In Spain, Ireland and Por-tugal, the tendency was towards very gradual convergence on Community average GDP per head beginning in 1985-86, with most (but not all) regions displaying this tendency. The position of Greece and of most of its regions worsened in relation to the rest of the Community. The Mezzogiorno showed mixed results. The overall result ¡s that dis-parities in Incomes per head converged slightly at the inter-regional level.
2.2 The recent performance
of Objective 1 regions:
winners and losers
The principal indicator of regional performance cho-sen was relative change in GDP per capita in
chasing power parities over the period 198089 (particular attention was paid to the 198589 trend). It was chosen as a guide to the capability of each region to provide, from internal activities, an increa sing living standard to its population. The second Indicator was the productivity growth (change in GDP per employee) to show the growth of local competitiveness representing the main instrument to achieve increasing living standards. The two indi cators were used to produce a list of converging and diverging regions. The quality of growth was analysed by comparing productivity changes with employment creation to indicate whether growth could be ascribed to protection of basically uncom petitive industry, to rationalization and cuts of the least productive jobs, or to a virtuous cycle of increased productivity stimulating industry. The results of this were then compared with the list of converging and diverging regions. All data are provi ded in Annex I of this report.
[image:30.595.111.562.467.726.2]capita growth over the period 198089. reveals four groups of regions.
Figure 2.1
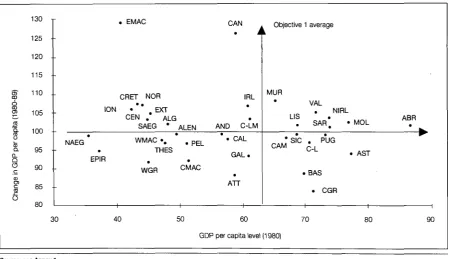
• First, there are those which were relatively strong in 1980 and have improved their position over the period 198089. Examples of such regions are Mur cia, Valencia, Lisboa, Molise, Abruzzi and Sardegna.
• Then, there are those regions which had very low initial levels of GDP per capita ¡n 1980, but which have grown at a faster rate than the EC average. This group comprises e.g. Canarias, Extremadura, Norte, Centra, Algarve, Ireland, Eastern Macedonia, Crete, the Ionian and Southern Aegean Islands.
• There are regions which had a low level of GDP per capita in 1980 and which have experienced lower than average growth rates. These are; Anda lucía, Galicia, Calabria, Northern Aegean Islands, Western Macedonia, Thessaly, Peleponnese, Epi rus, Central Macedonia and Western Greece.
2.3 Performance of Objective 1
regions: GDP per capita
Figure 2.1 shows GDP per capita levels in purchas ing power parities in 1980 plotted against GDP per
• Finally, there are regions where GDP per capita in 1980 was higher than the Objective 1 region aver age, but where growth has been lower than the EC average. These regions Include among others Cen tral Greece, Castilla Leon, Asturias, Basilicata and Campania.
Figure 2.1 : GDP per capita: level and change
CO CO CO CO CO Q . m Ü t i n r ι o co c m sz O 130 125 120 115 110 105 100 95 90 8ò 80 ION NAEG • EPIR
. EMAC
CRET NOR • ·
. EXT CEN . ALG
SAEG *
WMAC · . THES
WGR
ALEN
• PEL
• CMAC H CAN À IRL • • AND CLM
. CAL
G A L .
• ATT
1
. Objective 1 average
MUR
VAL NIRL LIS
SAR. · MOL
' S I C . PUG CAM ρ ι
C"L . AST
• BAS
. CGR
1 1
ABR •
W
1
30 40 50 60 70
GDP per capita level (1980)
80 90
Source: see Annex 1.
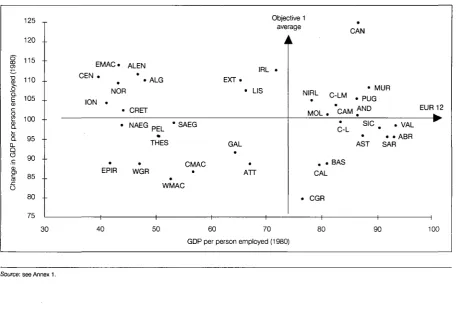
2.4 Performance of Objective 1
regions: productivity
Figure 2.2 divides the regions into four categories in terms of their productivity rate in 1980 and their productivity performance in the period to 1988.
• The figure reveals a group of regions with higher than average productivity levels in 1980 and impro ved productivity levels at a rate greater than the EC average. These regions comprised e.g. Castilla La Mancha, Murcia, Canarias, Puglia and Northern Ire land.
• A second group of regions had low productivity in 1980 and an increase of less than the EC average. Apart from Galicia, this group consisted entirely of Greek regions (e.g. Central and Western Macedonia, Thessaly, Epirus, Western Greece and Peleponnese).
• Some regions had low initial productivity levels and managed to improve productivity at a level greater than the EC average. These regions include e.g. Crete, Ionian Islands, Eastern Macedonia, Cen tro, Norte, Alentejo and Algarve.
• Finally, a number of regions had 1980 productivity levels greater than the Objective 1 region average, but had a poor productivity performance over the 198088 period. These regions include among others Basilicata, Calabria, Abruzzi, Sardegna and Asturias.
2.5 The performance of single regions
[image:31.595.37.494.453.764.2]In this section the analysis so far is summarized and a final classification of Objective 1 regions presen ted, based on their performance over the 198089 period. This classification also took into account qualitative assessments by national experts. It ¡s Important to note that the classification of conver ging or diverging regions is a difficult task and one which is often subject to arbitrary value judgements. Thus strategic sectors vary in different locations and the same performance Indices can result from very different processes with different meanings. The behaviour of individual regions can be positive on some indicators and negative on others. Neverthe less, a simple classification is useful as a starting point for policy.
Figure 2.2: GDP per person employed: level and change
125 .
120
Chang e I n GD P pe r perso n employe d (1980 ) 00 C O (D o o * * αϊ ο α ϊ ο α ϊ o α ϊ 80 -75 30 Objective 1 average Á
E M A C ALEN |R[_
C E N' . ' . A L G E X T .
NOR · LIS ION ·
• CRET
• NAEG p E L * SAEG
THES GAL
•
CMAC
EPIR WGR · ATT
•
WMAC
i
NIRL
•
MOL .
• ·
CAL
. CGR
40 50 60 70 80 GDP per person employed (1980)
•
CAN
• MUR C-LM . pU G
'CAM AND EUR 12
¿L S I C . . V A L
• · · ABR
AST SAR
BAS
90 100
Source: see Annex 1.
The Objective 1 regions are therefore divided into three categories defined in relation to regional per-formance with regard to the EC average over the
1980-89 period. These categories are:
• converging regions with a performance higher than the EC average, 1980-89;
• diverging regions with a performance lower than the EC average, 1980-89;
• mixed-evidence regions which display different characteristics dependent upon which indicators are utilized, or which have important specific fea-tures.
It is useful to note two characteristics of this classifi-cation. First, it is based upon economic performan-ce rather than upon static economic strength or structure. The main emphasis is upon the capa-bility of Objective 1 regions to withstand competi-tion from, and catch up with, stronger European regions. Second, the point of reference is the EC average rather than the more usually employed national averages. Table 2.1 summarizes the cat-egorization and Figure 2.3 presents the results ¡n map form.
Note: Ireland as a whole falls Into the converging category. Classifications at NUTS 3 level were determined mainly on the basis of population and employment statistics and on some proxies such as average industrial wages and net output per employee in industry. These data suggest that Donegal and North West and Midlands should be classified as diverging regions. The remaining regions (East, West, South East, South West, Mid West and North East) were converging.
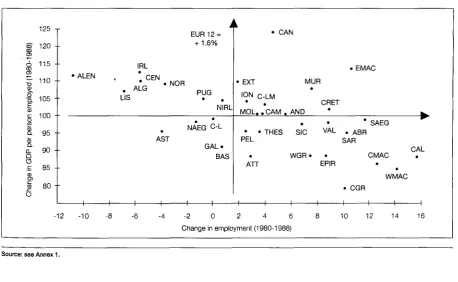
2.6 Regional growth patterns
The next step in this categorization of Objective 1 regions, is to analyse regional patterns of growth in terms of two variables; productivity and employ-ment growth. This analysis attempts to Identify the 'sustainabillty' of regional development and to diffe-rentiate positive and negative features. For example, a positive performance in productivity growth could result from either a virtuous process of rising competitiveness and growth or from a pro-cess of rationalization, with employment cuts. Four
Member State Italy
UK Ireland Greece
Spain
Portugal
France
Table 2.1 : The performance of Objective 1 regions in Converging
Abruzzi Molise
All regions East. Macedonia Ionian Isles
South Aegean Isles Crete
Andalucía
Castilla La Mancha Murcia
Canarias Valencia Lisboa Norte
Mixed evidence Puglia Sicilia Sardegna Northern Ireland
Galicia Castilla Leon Extremadura
Algarve Centro Alentejo
the 1980s
Diverging
Basilicata Campania Calabria
Cent. Macedonia Attica Cent. Greece West. Greece Epirus North. Aegean Isles West. Macedonia Thessalya Peleponnese Asturias
Corsica
possible patterns of regional growth are revealed (see Figure 2.4):
• a virtuous cycle, where a higher than average pro ductivity growth is associated with a good employ ment performance;
• rationalization, where a higher productivity growth is attained through severe employment cuts; • a vicious cycle or deindustrialization, where employment cuts and closures are unable to restore competitiveness and job losses continue;
• sheltered development, where explicit or implicit policies of assistance aid the rapid initial develop ment of backward areas and employment genera tion, irrespective of poor productivity performance.
Figure 2.4 classifies the Objective 1 regions into these different categories. While not all of those in the virtuous cycle category are 'converging' regions, the majority are (Canarias, Castilla La Mancha, Andalucía, Murcia, Ionian Islands, Crete, Eastern Macedonia and Molise). Extremadura is in the mixedevidence category and Campania is (just) a 'diverging' region. Four regions, Asturias, Galicia, Castilla Leon and the Northern Aegean Islands, fall into the vicious cycle category. Asturias and the Northern Aegean Islands were both classified as diverging regions indicating major development prob lems ¡n these regions. Gallcia and Castilla Leon are
mixedevidence regions. The former had a poor performance in the early 1980s, but has consider ably improved its performance since 1985. Of part icular interest are the large number of regions which fell Into the sheltered development category, includ ing converging, diverging and mixedevidence regions. The restructuring category largely consists of Irish and Portuguese regions indicating Improve ment at the expense of employment cuts.
2.7 Conclusions
This section has identified the converging and diver ging regions amongst Objective 1 regions in the 1980s. A number of conclusions emerge from this analysis.
• The performance of Objective 1 regions was diverse. Indeed, a broad trend was towards greater heterogeneity amongst the group of lagging regions. Thus some regions are catching up, some falling further behind.
[image:33.595.34.493.478.760.2]• There ¡s no automatic link between the relative strength of the region at present and whether it is catching up or not, but those poorer Objective 1 regions which happen to be falling behind have the
Figure 2.4: GDP regional growth patterns of the Objective 1 regions, 198088
125
œ 120 CO c» ó 115 CO ~ 110
perso n emplo y CO o o αϊ ο σ ι ω Q.
a. 90
-Q
C3
.£ 85
-CD
σι
ro 80 -υ -12 • ALEN -10 IRL . CEN • ALG LIS • AST
8 -6 -4
i
EUR 12 = + 1.6% NOR PUG • · NIRL • NAEG C-L
G A L . BAS
i
• CAN
• EXT MUR
ION C-LM
• . CRET MOL. . CAM . AND
• ·
• · THES SIC V A L
PEL
. WGR · ·
ATT EPIR
- 2 0 2 4 6 8
Change in employment (1980-1988)
. EMAC ^ * SAEG • ABR SAR CAL CMAC • • WMAC • CGR
10 12 14 16
Source: see Annex 1.