predictive modeling
Martin Falcke,1,a)Mahsa Moein,2,b) Agne Til¯unait˙e,3,c)R¨udiger Thul,4,d) and Alexander Skupin2, 5,e) 1)Max Delbr¨uck Centre for Molecular Medicine, Robert R¨ossler Strasse 10, 13125 Berlin, and Dept. of Physics,
Humboldt University, Newtonstr. 15, 12489 Berlin, Germany 2)
Luxembourg Centre for Systems Biomedicine, University of Luxembourg, 7, Rue de Swing, Belval, L-4367, Luxembourg
3)
Systems Biology Laboratory, University of Melbourne, Parkville, VIC 3010, Australia
4)Centre for Mathematical Medicine and Biology, School of Mathematical Sciences, University of Nottingham,
NG7 2RD, UK 5)
National Biomedical Computation Resource, University California San Diego, 9500 Gilman Drive, La Jolla, Ca 93121, USA
(Dated: 10 March 2018)
The correspondence between mathematical structures and experimental systems is the basis of the generaliz-ability of results found with specific systems, and is the basis of the predictive power of theoretical physics. While physicists have confidence in this correspondence, it is less recognized in cellular biophysics. On the one hand, the complex organization of cellular dynamics involving a plethora of interacting molecules and the basic observation of cell variability seem to question its possibility. The practical difficulties of deriving the equations describing cellular behaviour from first principles support these doubts. On the other hand, ignor-ing such a correspondence would severely limit the possibility of predictive quantitative theory in biophysics. Additionally, the existence of functional modules (like pathways) across cell types suggests also the existence of mathematical structures with comparable universality. Only a few cellular systems have been sufficiently investigated in a variety of cell types to follow up these basic questions. IP3 induced Ca2+ signalling is one of them, and the mathematical structure corresponding to it is subject of ongoing discussion. We review the system’s general properties observed in a variety of cell types. They are captured by a reaction diffusion system. We discuss the phase space structure of its local dynamics. The spiking regime corresponds to noisy excitability. Models focussing on different aspects can be derived starting from this phase space structure. We discuss how the initial assumptions on the set of stochastic variables and phase space structure shape the predictions of parameter dependencies of the mathematical models resulting from the derivation.
IP3 induced Ca2+ signalling is one of the most versatile and universal cellular signalling systems and a popular model system in non-linear dy-namics for pattern formation in noisy systems. We discuss the experimental evidence allowing for identification of the mathematical structure to which it corresponds, and a variety of concepts for deriving simplified models from it.
I. INTRODUCTION
In spring 1995, I (MF) joined John (Jack) L. Hudson’s lab in Charlottesville, Virginia, to work with him on dy-namic clustering of globally coupled non-linear oscillators or a topic from pattern formation far from thermody-namic equilibrium. James D. Lechleiter and Patricia Ca-macho were in Charlottesville at this time, too. James
a)Electronic mail:[email protected] b)Electronic mail:[email protected]
c)Electronic mail:[email protected] d)Electronic mail:[email protected] e)Electronic mail:[email protected]
had just published his results on the effect of energiz-ing mitochondria on Ca2+ waves in Xenopus oocytes1,
which had several aspects very interesting for the the-ory of pattern formation. According to that thethe-ory, free ends of waves in excitable systems should either form a spiral or recede. The free ends of Ca2+ waves with en-ergized mitochondria neither formed spirals nor receded but showed different dynamics. Jack suggested to work on these patterns. This was my first biophysical project and it redirected my career. Jack worked experimentally and developed also the mathematical models explaining his experiments. His high standards and expectations towards theory close to experiments substantially influ-enced all of my later scientific and educational work.
The first years of this biophysical research led to results on spiral instabilities, spiral pattern regimes and gener-ation and annihilgener-ation dynamics2, but could not explain Lechleiter’s experiments. The underlying mathematical structure of the model did not correspond to the experi-mental system. When we replaced the model with a di-rect transition from excitability to an oscillatory regime by a model with a direct transition from excitability to bistability3, it explained not only the mitochondria
ex-periments4, but also experiments which were not taken
how the basic mathematical structure of a non-linear dy-namical system defined by its set of bifurcations and their relation, often called the bifurcation diagram and phase space structure, is essential for the predictive power of a theoretical description.
In physics, the fundamental equations, like Newton’s first law, the variational principles of classical mechanics or the Schr¨odinger equation of quantum mechanics have been developed with simple examples. Nonetheless, they are stunningly predictive far beyond the systems used in their formulation. This predictive power originates from a correspondence between the experimental objects and mathematical structures. The mechanics of macroscopic objects corresponds to variational principles and differ-ential equations, the behaviour of microscopic objects corresponds to operator theory in Hilbert spaces. The identification of the correct mathematical structure cor-responding to an observation provides predictive power to a mathematical theory in science. Mathematical mod-els formulated within mathematical structures not cor-responding to the observations still may reproduce the measurements used for their development but rarely are predictive beyond them as illustrated by the history of atom models.
In general, the biophysics of cells has to obey the basic laws of physics - the first principles. But cells consist of many components and interactions and therefore spec-ifying the fundamental equations of physics to a living cell is close to impracticable. The approach of theoret-ical biophysics is consequently to consider the compo-nents and interactions assumed to be most relevant for a specific process of interest and to verify the assumptions retrospectively by contrasting model predictions with ex-perimental results. But does the lack of models derived from first principles for cellular behavior also mean that the correspondence of mathematical structures to obser-vations has no meaning in cellular biophysics? The pre-dictive power growing out of it makes it worth to follow up on this only seemingly philosophical question.
Only a few cellular dynamical systems are currently characterized well enough for identifying the mathemat-ical structure corresponding to them. Intracellular Ca2+ dynamics is one of them. The Ca2+ pathway trans-lates extracellular signals into intracellular responses by increasing the cytosolic Ca2+ concentration in a stim-ulus dependent pattern6–8. The concentration increase can be caused either by Ca2+ entry from the extracellu-lar medium through plasma membrane channels, or by Ca2+release from internal storage compartments. In the following, we will focus on inositol 1,4,5-trisphosphate (IP3)-induced Ca2+ release from the endoplasmic reticu-lum (ER), which is the predominant Ca2+ release mech-anism in many cell types. IP3 sensitizes Ca2+ channels (IP3Rs) on the ER membrane for Ca2+ binding, such that Ca2+ released from the ER through one channel increases the open probability of neighboring channels. This positive feedback of Ca2+ on its own release chan-nel is called Ca2+-induced-Ca2+-release (CICR).
Open-ing of an IP3R triggers a Ca2+ flux into the cytosol due to the large concentration differences between the two compartments, which is in the range of 3 to 4 orders of magnitudes. The released Ca2+ is removed from the cytosol either by sarco-endoplasmic reticulum Ca2+ AT-Pases (SERCAs) into the ER or by plasma membrane Ca2+ ATPases into the extracellular space.
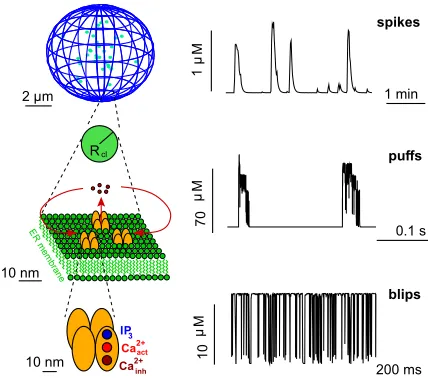
IP3R are spatially organized into clusters of up to about fifteen channels. These clusters are scattered across the ER membrane with distances of 1 to 7µm9–13. CICR and Ca2+ diffusion couple the state dynamics of the channels. Given that the diffusion length of free Ca2+ is less than 2µm due to the presence of Ca2+ binding molecules in the cytoplasm and SERCAs, the coupling between channels in a cluster is much stronger than the coupling between adjacent clusters14. The structural hi-erarchy of IP3R from the single channel to clusters shown in Fig. 1 is also reflected in the dynamic responses of the intracellular Ca2+ concentration as revealed through fluorescence microscopy and simulations9,15–17. Open-ings of single IP3R (blips) may trigger collective open-ings of IP3R within a cluster (puffs), while Ca2+ diffus-ing from a puff site can then activate neighbordiffus-ing clus-ters, eventually leading to a global, i.e., cell wide, Ca2+ spike13,16,18,19. Repetitive sequences of these Ca2+spikes encode information that is used to regulate many pro-cesses in various cell types6,20,21.
Ca2+ exerts also a negative feedback on the channel open probability, which acts on a slower time scale than the positive feedback, and has a higher half maximum value than CICR9,15,18,22–24. This Ca2+-dependent neg-ative feedback helps terminating puffs, and therefore the puff probability immediately after a puff is smaller than the stationary value but typically not 0. Channel clus-ters recover within a few seconds to the stationary puff probability9,15,18,22–24.
The negative feedback terminating release spikes causes anabsolute refractory period Tmin as part of the interspike intervals (ISIs) lasting tens of seconds25–27. The molecular mechanism of this feedback is pathway and cell type specific and not always known although a negative feedback on the IP3 concentration might be involved28,29. Hence, the negative feedback that
deter-mines the time scale of interspike intervals is different from the feedback contributing to interpuff intervals and requires global (whole cell) release events.
At very strong stimulation, cells exhibit a raised Ca2+ concentration of much longer duration than spikes which may oscillate30,31, burst32,33 or is rather constant1,34,35.
Rcl
µ
M
µ
M
µ
M
µ 2 m
ER membrane
200 ms blips puffs spikes
1
10
70 0.1 s
1 min
10 nm
10 nm
IP
3 act
2+
Ca
2+
[image:3.612.67.281.52.241.2]Cainh
FIG. 1. Hierarchical organization of IP3 induced Ca2+ sig-nalling with concentration signals of the corresponding struc-tural level. The elementary building block is the IP3R channel (bottom). It opens and closes stochastically. An open chan-nel entails Ca2+release into the cytosol due to the large con-centration difference between the ER and the cytosol. Since channels are clustered, opening of a single channel, which is called a blip, leads to activation of other channels in the clus-ter, i.e., a puff (middle). The cluster corresponds to a re-gion with Ca2+release with a radius Rclthat is fixed by the number of open channels. The stochastic local events are or-chestrated by diffusion and CICR into cell wide Ca2+waves, which form the spikes on cell level (top). (Figure reprinted from A. Skupin, H. Kettenmann, and M. Falcke, ”Calcium signals driven by single channel noise” PLoS Comput Biol 6, e1000870 (2010).36.)
II. EXPERIMENTAL RESULTS ON THE PHASE SPACE STRUCTURE AND DYNAMICAL PROPERTIES OFIP3 INDUCEDCA2+ RELEASE
The pathway exhibits local Ca2+ release through in-dividual channel clusters at low [IP3], spiking at inter-mediate [IP3] and an elevated cytosolic [Ca2+]i at high
[IP3]. A basic observation in all experiments is, that cell-to-cell variability with respect to Ca2+ spiking behavior is large but not completely arbitrary. It obeys some pre-served characteristics, which have been confirmed for all cell types in which they have been investigated. We will focus on these general characteristics since they obviously reflect essential system properties.
It is convenient for the presentation of experimental results to introduce also a few mathematical concepts. In mathematical terms, intracellular Ca2+dynamics are described by reaction-diffusion equations like
∂X
∂t =D4X+F(X, ~r, t, p), (1)
whereX is a vector of concentrations,t is time,~r is the space coordinate,Dis a diagonal diffusion matrix,4the Laplace operator, F(·) is a non-linear function
describ-ing the local dynamics, andpis a vector of parameters.
X comprises free cytosolic Ca2+, Ca2+ bound to Ca2+ -binding molecules, IP3, and free and bound Ca2+ in the lumen of the ER and mitochondria in a rather general formulation of the dynamics.
In general, non-linear dynamics reaches asymptotically the attractors in phase space which may be stationary states or manifolds of higher dimension. Attractors with higher dimension like limit cycles, tori or even chaotic at-tractors potentially describe the Ca2+spiking behaviour. They may be caused by the dynamics of spatial modes (eigenfunctions of the linearized rhs of Eq. (1)) or by the local dynamics37, i.e. may occur with4X ≡0 also.
Spa-tial modes have been observed with the Ca2+dynamics of excitation contraction coupling in cardiac myocytes38,39, which is a driven system in terms of dynamical systems theory. However, there is no experimental evidence for attractors of the autonomous and/or IP3 induced intra-cellular Ca2+ dynamics caused by spatial modes, and hence we can focus on properties of the local dynamics.
The local dynamics of Eq. (1) are the behaviour of the IP3R clusters. The majority of the modelling literature assumes oscillatory local dynamics in the spiking regime, since measured spikes are repetitive. Indeed, spike se-quences even with a CV of 0.3-0.4 of the ISI appear sur-prisingly regular in visual inspection. However, a closer look could not confirm this assumption24,40.
Clusters are dynamically coupled by Ca2+ diffusion, which needs to be reduced for investigations focussing on the local dynamics. Such an uncoupling can be achieved by high intracellular concentrations of the Ca2+ buffer EGTA. The elemental event of the local dynamics is the stochastic opening of channels in a cluster. The first open channel entails with some probability opening of more channels in the cluster causing a puff. Puffs last typi-cally a few tens of ms but with large scatter13,41. The
probability of triggering calcium puffs is linearly related to the number of IP3R in a cluster42. Puff sequences at a
given cluster exhibit some correlation between amplitude and subsequent interpuff intervals, a weak correlation between interpuff intervals and subsequent amplitude, but no detectable correlation between consecutive am-plitudes41. Both puff amplitude and frequency increase and saturate with increasing stimulation of cells42.
Typical interpuff intervals last a few seconds13,24,41,42, interspike intervals are in the range from about 20 s to a few minutes. If the local dynamics were oscillatory and caused the sequence of spikes, the time scale of the ISI should be detectable as a temporal modulation of prop-erties of the puff sequence at a given site. That has not been found24. A modulation of puff sequences on the ISI time scale could not be detected and no evidence of an oscillatory regime of the local dynamics has been observed24. The ISI time scale has only been observed
concentra-tion modulating the strength of spatial coupling40. This confirms the results of the analysis of the local dynamics. These experimental results are supported by theoret-ical investigations. The Ca2+ concentration at closed clusters is the resting concentration in the range of
≤100 nM. Detailed simulations of the concentration dy-namics in the immediate vicinity of channels14 showed that concentrations at open channels are high (>20µM). The dynamic range of the regulatory binding sites for both the positive and negative feedback of Ca2+ to the open probability ranges from a few hundred nM to mi-cromolar values below 10µM43–45. Oscillatory dynamics require concentration values in the dynamic range. How-ever, with these large concentration changes, the system essentially never is in this dynamic range and the regime of the deterministic limit of the cluster dynamics is either excitable or bistable (except tiny parameter ranges)17.
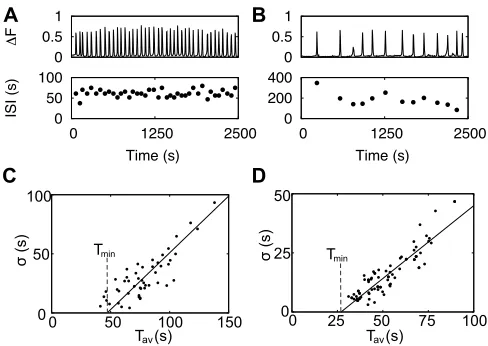
If channels are sufficiently sensitized for Ca2+ bind-ing, puffs may cooperate to set off a global release spike spreading from the initiating site into the cell in a wave like manner. Waves occur if a critical number of releas-ing clusters is reached16,46,47. The randomness of puffs causes randomness of spike timing with a linear relation between the standard deviation σof interspike intervals (ISI) and the average Tav
σ=α(Tav−Tmin) (2)
as shown in Fig. 2 and further for 8 cell types and 10 conditions27,40,48–50 (see also51). The slope α of this relation between SD and average is the same for all cells of the same type stimulated with the same ago-nist27,40,48,49,52and robust against changes in stimulation
strength27, pharmacological perturbations27, changes in
buffering conditions40, and the large cell variability. It has been verified even in cells not exhibiting clustering of channels and puffs49. Values of α are for example
about 0.2 for hepatocytes stimulated with vasopressin, 0.25 for HEK cells stimulated with CCh, 0.37 for hep-atocytes stimulated with phenylephrine27, 0.7 for PLA
cells52 and close to 1 for spontaneously spiking astro-cytes40. Consequently, the standard deviation is of the
same order of magnitude as the average ISI.
The standard deviation of ISI of oscillatory systems moving on a limit cycle in phase space and perturbed by noise is typically smaller than the values measured for Ca2+ spiking53, and/or the cumulant relation may ex-hibit a negative slope53. Varying parameter values across
the range covered by cell variability and the perturba-tions applied in two studies27,40 causes loss of a unique
relation betweenσand Tav53 with these oscillatory sys-tems, since the period and the noise causing the standard deviation are determined by differential processes. Thus the robustness ofαagainst cell variability and perturba-tions can hardly be reconciled with an oscillatory dynam-ics, since all these parameter variations against which
α is robust would need to affect the processes setting the average and the processes setting the SD in exactly the way conserving the CV. But since spike generation is
0 0.5 1
∆
F
0 50 100
0 1250 2500
ISI (s)
Time (s)
0 0.5 1
∆
F
0 200 400
0 1250 2500
ISI (s)
Time (s)
A
C D
B
FIG. 2. Variability in Ca2+ signals. A: The transient cy-tosolic Ca2+ concentration of an astrocyte stimulated with 10µM ATP (upper panel) exhibits some variability as indi-cated by the variable individual ISIs (lower panel). B: An as-trocyte of the same experiments shows slower and more irreg-ular spiking illustrating cell-to-cell variability.C: The system-atic analysis of the standard deviationσof ISI versus the aver-age ISI Tavfor HeLa cells stimulated with 100µM histamine reveals a linear dependence in accordance with the moment relation (2) where each data point corresponds to the char-acteristic of an individual cell. D: Theσ-Tav relation of as-trocytes stimulated with 10 µM ATP exhibits also a linear dependence with a different slope than HeLa cells. Tav-Tmin is the average stochastic part of the ISI.
stochastic, the parameters control only the spike genera-tion probability, and the type of stochastic process – like e.g. inhomogeneous Poisson – fixes the relation between Tav andσ54.
The second parameter of Eq. (2), the absolute refrac-tory period Tmin, was also found to be the same for all individual cells of the same type stimulated with the same agonist27,40. When T
minhas passed, the puff probability recovers from 0 gradually to its asymptotic value. This slow recovery delays initiation of the next spike. That spike may occur during recovery, if the asymptotic spike generation probability is large compared to the recovery rate, or after recovery in the opposite case. The con-tribution of this stochastic part of the ISI to the total average ISI has been thoroughly investigated and is well known. It contributes typically 40%-70% to the total av-erage ISI, and the measured range is from 8% to 95% contribution27,40,48–50. The recovery reduces also the SD
(of the stochastic part) of the ISI27,40,48–50. The slower
the recovery the smaller is the ratio of SD to average ISI (coefficient of variation CV)54.
[image:4.612.318.562.54.227.2]ISI (s) 0
0.02 0.04 0.06 0.08
P
(I
S
I) (1/s)
[image:5.612.103.249.51.163.2]0 100 200 300
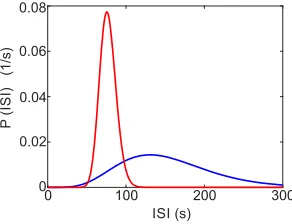
FIG. 3. ISI distributions P(ISI) for two spike trains measured with HEK cells stimulated with 100µM CCh. The differences between the distributions illustrate cell variability. The ex-perimental data are from the experiments published in ref.27, the fitting method is explained in ref.56.
which is stable against small perturbations. Perturba-tions above the excitation threshold are amplified to a transition to the excited state. The stochastic behavior of channel clusters causes incidental local transitions to the excited state, which then spreads with some prob-ability into the whole cell. The resulting large fraction of open clusters - i.e. a release spike - causing a high Ca2+ concentration and high open probability are the excited state of Ca2+dynamics. This state is terminated by negative feedback acting on a slower time scale than the excitation. The probability for generating this super-critical local excitation fixes the average stochastic part Tav-Tmin and the standard deviationσ.
The complete distribution of ISI cannot be easily de-termined from experimental data since measured spike trains are not longer than about 60 ISI. Fusion of ISI se-quences normalised by Tavhave been used as a surrogate data set and led to skewed distributions with an absolute refractory period55. More sophisticated methods based
on the time rescaling theorem and Kolmogorov-Smirnov tests for comparison of measured and hypothetical dis-tributions identified an inhomogeneous Gamma distribu-tion as the most likely experimental ISI distribudistribu-tion with time dependent stimulus56. Distributions of ISI obtained
with these methods and constant stimulation are shown in Fig.3.
The response of the average ISI to stimulation with extracellular agonists has features applying to all of the four plasma membrane receptors for which it has been investigated27. On that basis, we assume them also to
be general features of the system. Tmin is not affected by stimulation, as we have learned from the robustness properties of Eq. (2), already. Stimulation controls the average stochastic part Tav-Tminof the ISI. The concen-tration response has been established by applying steps in the concentrationaof the stimulating agonist27. The
change of the average stochastic part of the ISI due to this concentration step is proportional to the average stochas-tic part at the lower agonist concentration Tav127:
∆Tav=β(Tav1−Tmin). (3)
Analysis of measurements revealed thatβ does not de-pend on the agonist concentration27, which entails an
exponential dependency ona
Tav= Trefst e−
γ(a−aref
) + Tmin. (4)
Tref
st is the average stochastic part measured at the refer-ence concentrationaref. This prefactor of the exponen-tial is cell specific and picks up all the cell variability. The constantγ in the exponent is the same for all cells of a given cell type stimulated with the same agonist. Eq. (4) does not bear directly information on the dy-namic regime of IP3 induced Ca2+spiking, but it defines clear constraints to its theory.
III. BASIC REQUIREMENTS AND CONCEPTS FOR MODELLING OFIP3 INDUCED INTRACELLULARCA2+ DYNAMICS
A comprehensive monograph reviewing modelling of intracellular Ca2+ dynamics has recently been pub-lished57. Here, we would like to fill a void in the literature
by a critical reflection on the framework of model deriva-tion and the approximaderiva-tions coming with modelling con-cepts used in the biophysical literature.
The essence of the system is defined by its general properties, which are also the basic requirements mod-els should meet:
• The sequence of dynamic regimes with increasing stim-ulation: puffs, spikes, permanently elevated Ca2+. Pathway dependent also a bursting regime may follow or replace the spiking regime.
• The dynamics of individual clusters are not oscillatory on the time scale of ISI.
• Cell-to-cell variability of average ISI is large.
• The spiking regime obeys Eqs. (2), (3) and (4) with Tmin, α and γ being cell type and pathway specific but not subjected to cell variability.58
• ISIs depend sensitively on parameters of spatial cou-pling.
The high stimulation regime is not in this list, since the behavior is cell type dependent - it might be stationary or oscillatory.
methods to be used, solving it is not practical in the end. Hence, probabilistic theories usually start from for-mulations of the state dynamics eligible for simulating trajectories in phase space.
A. Simulations
The diffusion coefficients of Ca2+ and Ca2+ binding molecules are sufficiently large to establish the deter-ministic concentration profile on the time scale of typ-ical channel state changes due to the frequent sampling of space by thermal motion. The number of SERCA molecules is orders of magnitude larger than the num-ber of Ca2+ channels. Hence, we can describe diffusion, the reactions involving cytosolic Ca2+ binding molecules and the SERCA flux by reaction-diffusion equations like Eq. (1). The opening and closing of channels causes time dependent source terms in the partial differential equa-tion for the Ca2+ concentration. We illustrate that with a simple model comprising cytosolic Ca2+ c, one Ca2+ bufferb(Ca2+bound form) and the ER Ca2+ concentra-tione
∂c
∂t =Dc4c+
N
X
i=1
∞ X
j=1
Ai,j(c, e)δ(t−ti,j)δ(~r−r~i)
−Vp c
2
K2+c2 +Pl(e−c)−k
+(bt−b)c+k−b (5)
∂e
∂t =De4e−ν
Np X
i=1
∞ X
j=1
Ai,j(c, e)δ(t−ti,j)δ(~r−ri~)
+Vp
c2
K2+c2−Pl(e−c)
(6)
∂b
∂t =Db4b+k
+(bt−b)c−k−b. (7)
Here, bt denotes the total buffer concentration, k+ and
k− the binding and dissociation rate,Vp is the maximum
SERCA pump flux, and ν the ratio of cytosol to ER volume. We have approximated the shape of a channel mouth by a spatial δ-function and the time course of a single opening by a temporalδ-function. N is the number of channels,ri~ is the location of theith channel, and{ti,j}
the sequence of its openings before timet. The sequence of time points of openings is determined by Markov chain Monte Carlo simulations for the state of each individual channel. The simulations are based on state schemes, an example is shown in Fig. 4. Such an approach has been used both for single clusters as well as cell-wide cluster arrays19,53,59–64.
This type of simulations is well suited to investi-gate channel state schemes in cellular context, the role of particular pathway components or spatial as-pects19,53,59,62–64.
B. Distributions and their moments
Probability distributions for stochastic variables are the natural way to characterize stochastic systems. They are the solutions of the master equation. However, we need to simplify the system to obtain equations we can solve. These simplified systems can be informed by the general properties listed above. We know about the ISI distribution that it should exhibit an absolute refractory period and a linear relation between standard deviation and average.
The formulation of the problem in terms of Eq. (5) and Markov chains can also serve as starting point for analyt-ical calculations or derivation of simplified models. The robustness of spike generation with respect to cell vari-ability and perturbations demonstrates that it cannot de-pend on very specific parameter values or other details. Hence, simplifications should not destroy the basic char-acteristics of the system. At the same time, the large cell variability entails requirements on the theory. With each experiment comprising a population of cells we sample a phase space volume large enough for accommodating this cell variability. Hence, the qualitative properties of IP3 induced Ca2+ dynamics listed above must not de-pend sensitively on the value of parameters distinguish-ing individual cells. These parameters comprise protein concentrations65, the number of clusters, their spatial
ar-rangement, diffusion properties and more13.
A suggestion for calculating the ISI distribution has been made in this spirit54. It starts from the wave
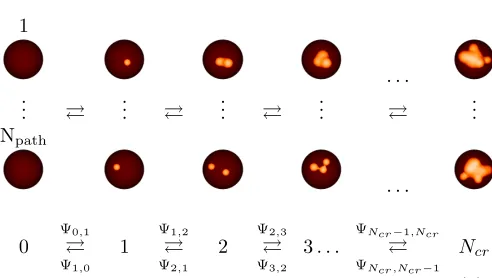
nu-cleation character of spike generation. All clusters are closed at the end of a spike. Each opening cluster en-tails a sphere of increased Ca2+ concentration around it. We indicate that by the orange spheres in the red round cells above scheme (8). The local rise in Ca2+ increases the open probability of the open cluster’s neighbours. A spike occurs, when a critical number Ncr of open
cluster54:
1
. . .
..
. ... ... ... ...
Npath
. . .
0 Ψ0,1
Ψ1,0
1 Ψ1,2
Ψ2,1
2 Ψ2,3
Ψ3,2
3. . .
ΨNcr−1,Ncr
ΨNcr ,Ncr−1
Ncr
(8) The transition probabilities fromktok+1 open clusters are determined by the probability that k open clusters open another one, and fromktok-1 that a cluster closes. The transition probabilities Ψi,k in state scheme (8) can
be directly calculated from interpuff interval and puff du-ration distributions54. Such an approach is able to
ex-plain the cumulant relation Eq. (2)54.
A lot remains to be done even with such a simple ap-proach. The dependency of the transition probability on the numbers of open clusters and the parameters of spatial coupling has not been worked out analytically, yet. Also, the effect of the recovery from the negative feedback terminating spikes has not yet been described analytically in this approach but with phenomenological ansatzes or stochastic simulations only40,53,55,66. A new
approach to this problem has been suggested recently, but has not been specified to Ca2+spiking, yet67. Deriva-tion of the concentraDeriva-tion response relaDeriva-tion Eq. (4) with this approach has neither been attempted, yet.
C. Rate equations
Rate equations for lumped variables might be desirable for simplified models and have been successfully used for investigating specific aspects of pathways or the dynam-ics3,28,57,70–74. The derivation of rate equations implies
averaging over the state distribution dynamics defined by the master equation. The spatial character of spike initiation renders the averaging difficult. Another (re-lated) conceptual problem arises from the fact that the dynamics on cell level is still noisy. In contrast, the more frequent situation in the derivation of cellular dynam-ics encounters noise on the molecular level only. The population average carried out in the master equation of such systems during the derivation of rate equations is an average over the molecules in a single cell. The large number limit guaranteeing the validity of deterministic rate equations applies to the cell level. With IP3induced Ca2+ spiking, this limit does not apply to the cell level, since cell behavior is noisy. The average needs to be car-ried out across an ensemble of identical cells.
[image:7.612.57.303.66.205.2]Consequences of these considerations can be illustrated by a comparison to existing rate equation models. We
FIG. 4. This state scheme of the IP3R originally published by Siekmann et al.68 is comprised of two modes. One is the drive mode containing three closed states C1, C2, C3and one open state O6. The other is the park mode which includes one closed state C4 and one open state O5. The rates of state-transitions within each mode are constants. α and β
are the rates connecting the two modes and depend on Ca2+ in a highly dynamic manner. Figure reprinted with permis-sion from Biophysical Journal 112(2017) , P. Cao, M. Fal-cke, and J. Sneyd, ”Mapping interpuff interval distribution to the properties of inositol trisphosphate receptors”, 2138–2146, copyright (2018)69.
prepare this comparison by reconsidering the rate equation derivaequation of the most simple stochastic process -radioactive decay of atoms. The stochastic variable is the numberNa of atoms. We denote the probability per unit time for decay of a single atom withλ. The atom numberNa obeys for large initial numbers Ni the
expo-nential functionNa =Nie−λt. Each decaying atom is in
a stationary state till it decays, there is no process set-ting the time point of its decay. However, if we ask for the timetr required till a specific number of atoms Nr
remains in the deterministic limit, it is set byNi,Nrand
λ (tr = λ−1ln(Ni/Nr)). The process setting the time
scale is the continuous decrease ofNa down toNr.
Rate equation models derived by averaging on the molecular level and assuming deterministic behavior on cell level usually require specific processes to set the time scale of ISIs. That might be a rising fraction of chan-nels recovered from inhibition, an approach to a criti-cal Ca2+ concentration or the rise of receptor sensitiza-tion57,74. However, the noisy behavior of Ca2+ spiking entails different determinants of the average ISI. Figure5
illustrates some differences between the rate equations obtained by assuming deterministic cell behavior and noisy behavior on cell level. The time courses were ob-tained from simulations of a purely deterministic model75 (black) and a noisy excitable version of it53 (red). Both
0 0.8 1.6
0 50 100
[Ca
2+
] (
µ
M)
0 0.8 1.6
0 50 100
[Ca
2+
] (
µ
M)
Time (s)
threshold threshold
noisy dynamics
Tdiv
A
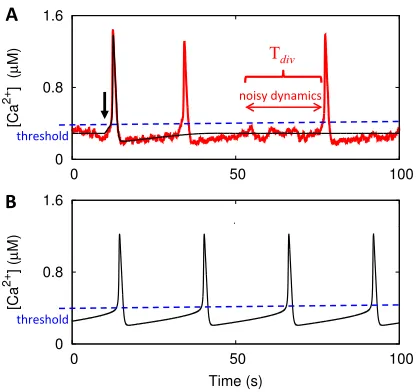
[image:8.612.70.278.53.249.2]B
FIG. 5. Time scales set by noise are not captured by current deterministic rate equations. A: Caricature of a Ca2+ time course as produced by deterministic rate equations (black) and by a corresponding noisy system (red) after an initial perturbation (arrow) based on model simulations53,75. The noisy system generates subsequent spikes some time after the previous one. During the time Tdiv, the deterministic rate equations are in a stationary state without generating a sec-ond spike. B: The interspike interval is dominated by the time required to reach the threshold of CICR (blue) in the oscillatory regime of deterministic rate equation models. The dependency of the ISI on the parameters characterizing the noise is lost.
dynamics is completely noise dominated. This illustrates that completely analogous to radioactive decay, there is no deterministic process on the level of the individual cell setting its ISI after recovery from the previous spike.
Spiking is lost in the rate equations since Tdiv diverges
due to averaging on the molecular level. Thus also the dependency of the ISI on the parameters characterizing the noise and spatial coupling is lost. Most rate equation models tune parameters to an oscillatory regime to es-tablish spiking (Fig.5B). The interspike interval is then dominated by the time required to reach the threshold for CICR. This entails parameter dependencies of the ISI different from the ones of noise driven dynamics.
The sketch of Tdiv for the excitable model in Fig.5A
applies when the asymptotic spike generation probability reached after recovery is smaller than the recovery rate from negative feedback. The medium and long ISI data in Xenopus oocytes18 and spontaneously spiking
astro-cytes and microglia cells40,66 are experimental
realiza-tions. Their recovery phase from negative feedback is substantially shorter (α ≈1) than the average ISI40,66.
The effect of noise on time scales and parameter depen-dencies is also substantial if the recovery phase and the average ISI are of comparable length27,40,66.
In summary, averaging on the single cell level across molecules and clusters eliminates the noise generating the
spike. The rate equations for this average do not reflect the spike generating mechanism, since usually an oscil-latory regime is then used to ’rescue’ spiking. However, averaging over a stochastic ensemble of cells defined by a cellular spike generation probability distribution allows for including the average of the noise generated time scale and its parameter dependencies, and can thus reflect the spike generation mechanism.
Deriving rate equations in a way reflecting the spike generation mechanism is an open problem and has not been attempted, yet. Suitable concepts might be in-spired by the integrate-and-fire models of neuronal dy-namics starting from an expression for the spike gener-ation probability on cell level. Investiggener-ations on glob-ally coupled noisy excitable systems might be specified to Ca2+ dynamics76. Another very promising approach
includes higher moments in the derivation77.
Parameter dependencies and the mathematical struc-ture of models can also be restricted by Eqs. (3) and (4). Stochastic simulations of the excitable regime of the fre-quently used DeYoung-Keizer-model reproduced Eq. (3) but not Eq. (4). Hence, a comprehensive theoretical un-derstanding of the concentration response is still lacking.
IV. CONCLUSION
While detailed multiscale simulations can mimic experimental observations in a rather flexible man-ner19,53,59–64, neither the current state of the stochastic
theory, nor the rate equation models live up to the re-quest for predicting experimental outcome beyond the examples used for model derivation. This indicates that we have not yet understood how to derive the appropri-ate models. Based on the accordance of experimental and multiscale simulation results, we come to the conclusion that a reaction diffusion system with a local dynamics in a noisy excitable regime must be the starting point of the derivation of predictive models, since it is the math-ematical structure corresponding to the observations.
IP3 induced Ca2+ dynamics is a classic of biological applications of non-linear dynamics57,78–80. On the
basis of early interpretations of experimental results, it became one of the prototypical cellular limit cycle oscillators. The recent experimental results reviewed in this study revealed that the repetition of spikes is caused by noise instead of a limit cycle or torus in phase space. Derivation of predictive and simple models starting from this noisy spatially extended excitable system is a task reaching beyond the specific biological system. Hence, this classic still poses theoretical problems interesting and challenging for the whole field of nonlinear dynamics.
of Health.
1L. Jouaville, F. Ichas, E. Holmuhamedov, P. Camacho, and
J. Lechleiter, “Synchronisation of calcium waves of mitochon-drial substrates in Xenopus laevis oocytes,” Nature377, 438–441 (1995).
2M. Falcke, M. B¨ar, J. Lechleiter, and J. Hudson, “Spiral breakup
and defect dynamics in a model for intracellular Ca2+dynamics,” Physica D129, 236–252 (1999).
3M. Falcke, “Reading the patterns in living cells - the Physics of
Ca2+signaling,” Advances in Physics53, 255–440 (2004). 4M. Falcke, J. Hudson, P. Camacho, and J. Lechleiter, “Impact of
mitochondrial Ca2+cycling on pattern formation and stability,” Biophys.J.77, 37–44 (1999).
5M. Falcke, Y. Li, J. Lechleiter, and P. Camacho, “Modeling the
dependence of the period of intracellular Ca2+waves on SERCA expression,” Biophys.J.85, 1474–1481 (2003).
6M. Berridge, M. Bootman, and P. Lipp, “Calcium - a life and
death signal,” Nature395, 645–648 (1998).
7C. Taylor, “Why do hormones stimulate Ca2+ mobilization,”
Biochem.Soc.Trans.23, 637–642 (1995).
8G. Dupont, L. Combettes, G. S. Bird, and J. W. Putney,
“Cal-cium oscillations,” Cold Spring Harbor Perspectives in Biology3 (2011).
9M. Bootman, E. Niggli, M. Berridge, and P. Lipp, “Imaging
the hierarchical Ca2+ signalling in HeLa cells,” J.Physiol 499, 307–314 (1997).
10I. F. Smith, S. M. Wiltgen, and I. Parker, “Localization of puff
sites adjacent to the plasma membrane: Functional and spa-tial characterization of Ca2+signaling in SH-SY5Y cells utilizing membrane-permeant caged IP3,” Cell Calcium45, 65–76 (2009). 11Taufiq-Ur-Rahman, A. Skupin, M. Falcke, and C. W. Taylor,
“Clustering of InsP3 receptors by InsP3retunes their regulation by InsP3and Ca2+,” Nature458, 655–659 (2009).
12W. Suhara, M. Kobayashi, H. Sagara, K. Hamadad, T. Goto,
I. Fujimoto, K. Torimitsu, and K. Mikoshiba, “Visualization of inositol 1,4,5-trisphosphate receptor by atomic force microscopy,” Neuroscience Letters391, 102–107 (2006).
13M. V. Keebler and C. W. Taylor, “Endogenous signalling
path-ways and caged ip3 evoke ca2+ puffs at the same abundant immo-bile intracellular sites,”Journal of Cell Science130, 3728–3739 (2017).
14R. Thul and M. Falcke, “Release currents of IP
3receptor channel clusters and concentration profiles,” Biophys.J.86, 2660–2673 (2004).
15Y. Yao, J. Choi, and I. Parker, “Quantal puffs of intracellular
Ca2+ evoked by inositol trisphosphate in Xenopus oocytes,” J Physiol482, 533–553 (1995).
16J. Marchant, N. Callamaras, and I. Parker, “Initiation of IP 3 -mediated Ca2+ waves in Xenopus oocytes,” The EMBO J.18, 5285–5299 (1999).
17R. Thul and M. Falcke, “Stability of membrane bound reactions,”
Phys Rev Lett93, 188103 (2004).
18J. Marchant and I. Parker, “Role of elementary Ca2+ puffs in
generating repetitive Ca2+oscillations,” The EMBO Journal20, 65–76 (2001).
19M. Falcke, “On the role of stochastic channel behavior in
intra-cellular Ca2+dynamics,” Biophys.J.84, 42–56 (2003).
20H. Schulman, P. Hanson, and T. Meyer, “Decoding calcium
sig-nals by multifunctional cam kinase,”Cell Calcium13, 401 – 411 (1992).
21W. Li, J. Llopis, M. Whitney, M. Zlokarnik, and R. Tsien,
“Cell-permeant caged InsP3ester shows that Ca2+spike frequency can optimize gene expression,” Nature392, 936–941 (1998). 22I. Parker, J. Choi, and Y. Yao, “Elementary events of InsP
3 -induced Ca2+ liberation in Xenopus oocytes: hot spots, puffs and blips,” Cell Calcium20, 105–121 (1996).
23E. R. Higgins, H. Schmidle, and M. Falcke, “Waiting time
dis-tributions for clusters of IP3 receptors,”Journal of Theoretical
Biology259, 338 – 349 (2009).
24K. Thurley, I. F. Smith, S. C. Tovey, C. W. Taylor, I. Parker, and
M. Falcke, “Timescales of IP3-evoked Ca2+ spikes emerge from Ca2+puffs only at the cellular level,” Biophys J101, 2638–2644 (2011).
25N. Woods, K. Cuthbertson, and P. Cobbold, “Repetitive
tran-sient rises in cytoplasmic free calcium in hormone-stimulated hepatocytes,” Nature319, 600–602 (1986).
26T. Rooney, E. Sass, and A. Thomas, “Characterization of
cy-tosolic calcium oscillations induced by phenylephrine and vaso-pressin in single fura-2-loaded hepatocytes,” J.Biol.Chem. 264, 17131–17141 (1989).
27K. Thurley, S. C. Tovey, G. Moenke, V. L. Prince, A. Meena,
A. P. Thomas, A. Skupin, C. W. Taylor, and M. Falcke, “Reli-able encoding of stimulus intensities within random sequences of intracellular Ca2+spikes,” Sci. Signal.7, ra59 (2014).
28A. Politi, L. D. Gaspers, A. P. Thomas, and T. H¨ofer, “Models of
IP3and Ca2+oscillations: Frequency encoding and identification of underlying feedbacks,” Biophys J90, 3120 – 3133 (2006). 29P. J. Bartlett, W. Metzger, L. D. Gaspers, and A. P. Thomas,
“Differential regulation of multiple steps in inositol 1,4,5- trispho-sphate signaling by protein kinase C shapes hormone-stimulated Ca2+oscillations.” Journal of Biological Chemistry (2015). 30M. Berridge, “Calcium oscillations,” J.Biol.Chem. 265, 9583–
9586 (1990).
31M. Nash, K. Young, R. Challiss, and S. Nahorski,
“Receptor-specific messenger oscillations,” Nature413, 381–382 (2001). 32A. Green, P. Cobbold, and C. Dixon, “Elevated intracellular
cyclic AMP exerts different modulatory effects on cytosolic free Ca2+ oscillations in single rat hepatocytes,” Biochem.J. 302, 949–955 (1994).
33A. Green, C. Dixon, A. McLennan, P. Cobbold, and M. Fisher,
“Adenine dinucleotide-mediated cytosolic free Ca2+oscillations in single hepatocytes,” FEBS322, 197–200 (1993).
34M. S. Nash, M. J. Schell, P. J. Atkinson, N. R. Johnston,
S. R. Nahorski, and R. A. J. Challiss, “Determinants of Metabotropic Glutamate Receptor-5-mediated Ca2+ and Inosi-tol 1,4,5-Trisphosphate Oscillation Frequency,” J Biol Chem277, 35947–35960 (2002).
35M. Bootman, C. Taylor, and M. Berridge, “The thiol reagent,
thimerosal, evokes Ca2+spikes in HeLa cells by sensitizing the inositol 1,4,5-trisphosphate receptor,” J.Biol.Chem.267, 25113– 25119 (1992).
36A. Skupin, H. Kettenmann, and M. Falcke, “Calcium signals
driven by single channel noise,”PLoS Comput Biol6, e1000870 (2010).
37A. Mikhailov,Foundations of Synergetics, Springer Series in
Syn-ergetics, Vol. 1,2 (Springer, 1994).
38M. Diaz, D. Eisner, and S. O’Neill, “Depressed
Ryan-odine Receptor Activity Increases Variability and Du-ration of the Systolic Ca2+ Transient in Rat Ven-tricular Myocytes,” Circ Res 91, 585–593 (2002),
http://circres.ahajournals.org/cgi/reprint/91/7/585.pdf. 39J. Kocksk¨amper and L. A. Blatter, “Subcellular Ca2+alternans
represents a novel mechanism for the generation of arrhythmo-genic Ca2++ waves in cat atrial myocytes,”J Physiol545, 65–79
(2002),http://jp.physoc.org/cgi/reprint/545/1/65.pdf. 40A. Skupin, H. Kettenmann, U. Winkler, M. Wartenberg,
H. Sauer, S. C. Tovey, C. W. Taylor, and M. Falcke, “How does intracellular Ca2+oscillate: by chance or by the clock?” Biophys J94, 2404–11 (2008).
41G. D. Dickinson and I. Parker, “Factors determining the
recruit-ment of inositol trisphosphate receptor channels during calcium puffs,” Biophys J105, 2474 – 2484 (2013).
42G. D. Dickinson, D. Swaminathan, and I. Parker, “The
proba-bility of triggering calcium puffs is linearly related to the number of inositol trisphosphate receptors in a cluster,” Biophys J102, 1826 – 1836 (2012).
43C. Taylor, “Inositol trisphosphate receptors: Ca2+-modulated
44J. K. Foskett, C. White, K.-H. Cheung, and D.-O. D. Mak,
“Inos-itol trisphosphate receptor Ca2+release channels,” Physiological Reviews87, 593–658 (2007).
45E. Gin, M. Falcke, L. E. Wagner, D. I. Yule, and J. Sneyd,
“A kinetic model of the inositol trisphosphate receptor based on single-channel data,” Biophys.J.96, 4053–4062 (2009).
46G. Dupont, S. Swillens, C. Clair, T. Tordjmann, and L.
Com-bettes, “Hierarchical organisation of calcium signals in hepa-tocytes: from experiments to models,” Biochim.Biophys.Acta 1498, 134–152 (2000).
47W. Croft, K. Reusch, A. Tilunaite, N. A. Russell, R. Thul, and
T. C. Bellamy, “Probabilistic encoding of stimulus strength in astrocyte global calcium signals,”Glia64, 537–552 (2016). 48S. Dragoni, U. Laforenza, E. Bonetti, F. Lodola, C. Bottino,
R. Berra-Romani, G. Carlo Bongio, M. P. Cinelli, G. Guerra, P. Pedrazzoli, V. Rosti, F. Tanzi, and F. Moccia, “Vascular endothelial growth factor stimulates endothelial colony form-ing cells proliferation and tubulogenesis by inducform-ing oscillations in intracellular Ca2+concentration,”Stem Cells29, 1898–1907
(2011).
49P. Cao, X. Tan, G. Donovan, M. J. Sanderson, and J. Sneyd, “A
deterministic model predicts the properties of stochastic calcium oscillations in airway smooth muscle cells,”PLoS Comput Biol
10, e1003783 (2014).
50G. Dupont, A. Abou-Lovergne, and L. Combettes, “Stochastic
Aspects of Oscillatory Ca2+Dynamics in Hepatocytes,” Biophys J95, 2193–2202 (2008).
51M. Perc, A. K. Green, C. J. Dixon, and M. Marhl, “Establishing
the stochastic nature of intracellular calcium oscillations from experimental data,”Biophys Chem132, 33 – 38 (2008). 52A. Skupin and M. Falcke, “The role of IP
3R clustering in Ca2+signaling,” Genome Informatics20, 15–24 (2008), skupin, Alexander Falcke, Martin Japan Genome informatics. Inter-national Conference on Genome Informatics Genome Inform. 2008;20:15-24.
53A. Skupin and M. Falcke, “From puffs to global Ca2+
sig-nals: How molecular properties shape global signals,”Chaos19, 037111 (2009).
54K. Thurley and M. Falcke, “Derivation of Ca2+signals from puff
properties reveals that pathway function is robust against cell variability but sensitive for control,” Proc Nat Acad Sci USA 108, 427–432 (2011).
55Skupin, A. and Falcke, M., “Statistical analysis of calcium
oscil-lations,”Eur. Phys. J. Special Topics187, 231–240 (2010). 56A. Til¯unait ˙e, W. Croft, N. Russell, T. C. Bellamy, and R. Thul,
“A bayesian approach to modelling heterogeneous calcium re-sponses in cell populations,”PLOS Computational Biology13, 1–25 (2017).
57G. Dupont, M. Falcke, V. Kirk, and J. Sneyd,Models of Calcium
Signalling, edited by S. Antman, L. Greengard, and P. Holmes, Interdisciplinary Applied Mathematics, Vol. 43 (Springer, 2016). 58We expect the ISI properties also to apply to interburst intervals
with the slight modification of measuring the interburst interval from the end of a burst to the onset of the subsequent one. 59J. Keizer and G. Smith, “Spark-to-wave transition:
salta-tory transmission of calcium waves in cardiac myocytes,” Bio-phys.Chem.72, 87–100 (1998).
60J. Shuai and P. Jung, “Optimal ion channel clustering for
in-tracellular calcium signaling,” Proc.Nat.Acad.Sci.USA100, 506– 510 (2003).
61G. Ullah and P. Jung, “Modeling the Statistics of Elementary
Calcium Release Events,” Biophys J90, 3485–3495 (2006). 62S. R¨udiger, C. Nagaiah, G. Warnecke, and J. Shuai, “Calcium
domains around single and clustered ip3receptors and their mod-ulation by buffers,”Biophys J99, 3 – 12 (2010).
63S. R¨udiger, P. Jung, and J.-W. Shuai, “Termination of ca2+
re-lease for clustered ip3r channels,”PLoS Comput Biol8, e1002485
(2012).
64J. Shuai, J. E. Pearson, and I. Parker, “Modeling Ca2+
Feed-back on a Single Inositol 1,4,5-Trisphosphate Receptor and Its Modulation by Ca2+Buffers,” Biophys J95, 3738–3752 (2008). 65A. Sigal1, R. Milo, A. Cohen, N. Geva-Zatorsky, Y. Klein,
Y. Liron, N. Rosenfeld, T. Danon, N. Perzov, and U. Alon1, “Variability and memory of protein levels in human cells,” Na-ture444, 643–646 (2006).
66A. Skupin and M. Falcke, “Statistical Properties and Information
Content of Calcium Oscillations,” Genome Informatics18, 44–53 (2007).
67M. Falcke and V. N. Friedhoff, “The Stretch to Stray on Time:
Resonant Length of Random Walks in a Transient,” (2018),
arXiv:1801.05446.
68I. Siekmann, L. E. W. II, D. Yule, E. J. Crampin, and J. Sneyd,
“A kinetic model for type i and{II} {IP3R}accounting for mode changes,”Biophys J103, 658 – 668 (2012).
69P. Cao, M. Falcke, and J. Sneyd, “Mapping interpuff interval
distribution to the properties of inositol trisphosphate receptors,” Biophysical Journal112, 2138 – 2146 (2017).
70U. Kummer, L. Olsen, C. Dixon, A. Green, E. Bornberg-Bauer,
and G. Baier, “Switching from simple to complex oscillations in calcium signaling,” Biophys.J.79, 1188–1195 (2000).
71T. Haberichter, M. Marhl, and R. Heinrich, “Birhythmicity,
trirhythmicity and chaos in bursting calcium oscillations,” Bio-phys.Chem.90, 17–30 (2001).
72U. Kummer, B. Krajnc, J. Pahle, A. K. Green, C. J. Dixon, and
M. Marhl, “Transition from Stochastic to Deterministic Behavior in Calcium Oscillations,”Biophys J89, 1603–1611 (2005). 73G. Dupont, G. Houart, and A. Goldbeter, “From simple to
com-plex Ca2+oscillations: Regulatory mechanisms and theoretical models,” (Springer, Berlin Heidelberg New York, 2003) Chap. 8, pp. 129–151.
74J. Sneyd, J. M. Han, L. Wang, J. Chen, X. Yang, A. Tanimura,
M. J. Sanderson, V. Kirk, and D. I. Yule, “On the dynamical structure of calcium oscillations,” Proc Nat Acad Sci USA114, 1456–1461 (2017).
75A. Goldbeter, G. Dupont, and M. J. Berridge, “Minimal model
for signal-induced Ca2+oscillations and for their frequency en-coding through protein phosphorylation,” Proc Nat Acad Sci USA87, 1461–1465 (1990).
76T. Prager, M. Falcke, L. Schimansky-Geier, and M. A. Zaks,
“Non-markovian approach to globally coupled excitable sys-tems,” Physical Review E76, 011118 (2007).
77M. A. Zaks, X. Sailer, L. Schimansky-Geier, and A. B. Neiman,
“Noise induced complexity: From subthreshold oscillations to spiking in coupled excitable systems,” Chaos: An Interdisci-plinary Journal of Nonlinear Science15, 026117 (2005). 78J. Murray, Mathematical Biology (Springer-Verlag, Berlin
Hei-delberg, 1993).
79A. Goldbeter, Biochemical Oscillations and Cellular Rhythms
(Cambridge University Press, Cambridge, 1996).
80J. Keener and J. Sneyd,Mathematical Physiology(Springer, New