This is a repository copy of
Vehicle Breakdown Duration Modelling
.
White Rose Research Online URL for this paper:
http://eprints.whiterose.ac.uk/2013/
Article:
Wang, W., Chen, H. and Bell, M.C. (2005) Vehicle Breakdown Duration Modelling. Journal
of Transportation and Statistics, 8 (1). pp. 75-84. ISSN 1094-8848
[email protected] https://eprints.whiterose.ac.uk/ Reuse
See Attached
Takedown
If you consider content in White Rose Research Online to be in breach of UK law, please notify us by
White Rose Research Online
http://eprints.whiterose.ac.uk/
Institute of Transport Studies
University of Leeds
This is an author produced version of a paper published in the
Journal of
Transportation and Statistics
. The papers produced by the Bureau of
Transportation Statistics are public domain and may be used and reprinted
without special permission.
White Rose Re
search Online
URL for this paper:
http://eprints.whiterose.ac.uk/
2013/
Published paper
Wang, W.; Chen, H.; Bell, M.C. (2005)
Vehicle Breakdown Duration Modelling.
Journal of Transportation and Statistics, 8(1), pp.75-84.
1
Vehicle Breakdown Duration Modeling
WENQUN WANG1,*
HAIBO CHEN2
MARGARET C. BELL2
ABSTRACT
This paper analyzes the characteristics of vehicle breakdown duration and the relationship between the duration and vehicle type, time, location, and reporting mechanisms. Two models, one based on fuzzy logic (FL) and the other on artificial neural net-works (ANN) were developed to predict the vehicle breakdown duration. One advantage of these meth-ods is that few inputs are needed in the modeling. Moreover, the distribution of the duration does not affect the results of the prediction. Predictions were compared with the actual breakdown durations demonstrating that the ANN model performs better than the FL model. In addition, the paper advocates for a standard way to collect data to improve the accuracy of duration prediction.
INTRODUCTION
A traffic incident is a nonrecurrent event. It is not a planned closure of a road nor a special event; there-fore, there is no advanced notice. Examples include vehicle breakdowns, accidents, natural disasters, and those caused by humans. An accident is a spe-cific type of incident that normally involves human injury or casualty.
KEYWORDS: Traffic incident management, vehicle break-down duration, fuzzy logic, neural networks.
Email addresses:
* Corresponding author—[email protected] H. Chen—[email protected]
M.C. Bell—[email protected]
1
Atkins Transport Systems Woodcote Grove Ashley Road Epsom, England KT18 5BW
2
Institute for Transport Studies University of Leeds
Incidents have become one of the main causes of traffic congestion. Lindley (1987) showed that between 50% and 75% of the total traffic conges-tion on urban motorways in the United States is incident-induced. Moreover, there is a symbiotic relationship between incidents and congestion. As incidents cause more congestion, more congestion brings with it more incidents. Traffic incidents have other impacts: the risk of secondary crashes for other road users and those dealing with the incident; and possible reductions in air quality due to increased fuel consumption caused by the congestion.
In recent years, investment in developing systems to manage incidents has increased. The Federal Highway Administration defines incident manage-ment as the systematic, planned, and coordinated use of human, institutional, mechanical, and techni-cal resources to reduce the duration and the impact of incidents, and improve the safety of motorists, crash victims, and incident responders (USDOT 2000). Therefore, incident duration prediction becomes an important tool for incident manage-ment. Reliable duration prediction can help traffic managers apply appropriate management strategies, and it can also be used to evaluate the efficiency of the management strategies that are implemented. Furthermore, duration prediction can provide accu-rate and essential information to road users.
Vehicle breakdown is one type of incident that often occurs on motorways and represents more than 80% of all types of incidents. In this paper, we analyze the characteristics of vehicle breakdowns and develop vehicle breakdown duration models based on fuzzy logic (FL) and artificial neural net-works (ANN). We use incident data collected from the M4 motorway in the United Kingdom to vali-date our models.
LITERATURE REVIEW
Incident duration is the time period between the occurrence and clearance of an incident. During this period, the following activities occur: incident detec-tion, verificadetec-tion, response, clearance, and recovery. Components of incident management include traffic management and traffic information. To accomplish this, information is exchanged between the different
parties involved, including the police and the break-down recovery service.
Golob et al. (1987) analyzed data from over 9,000 accidents involving large trucks and combina-tion vehicles collected over a two-year period on freeways in the greater Log Angeles area. They found that accident duration fitted a log-normal dis-tribution. The factors used in their accident duration model were collision type, accident severity, and lane closures. Their data were shown to be more statisti-cally significantly similar to the log-normal than the log-uniform distribution. However, the sample size of each group was small (between 21 and 57).
Giuliano (1989) extended the research of Golob et al. by applying a log-normal distribution in the incident duration analysis of 512 incidents in Los Angeles. The author found that the factors affecting incident duration were incident type, lanes closed, time of day, accident type, and whether or not a truck was involved. The variance within each cate-gory was large making it difficult to forecast the incident duration.
Jones et al. (1991) made further improvements by imposing a conditional probability; that is, given that the incident has lasted X minutes, it will end in the Yth minute. The authors analyzed 2,156 inci-dents in the metropolitan Seattle area and found that the duration of incidents conformed to a log-logistic instead of log-normal distribution (they applied a hazard duration model to estimate the incident dura-tion). However, some factors used in their model, such as the age of the driver, were found to be impractical, because this information was often not available when the incident occurred. They stated that more appropriate and accurate data are very important in incident duration analysis.
clear-WANG, CHEN & BELL 3 ance time. However, one drawback, highlighted by
the authors, is that they could not draw definitive conclusions concerning the actual duration of the incident because data were insufficient.
Sethi et al. (1994) developed a decision tree to predict incident duration. They based their research on the statistical analysis of 801 incidents from the Northwest Central Dispatch. This prediction method was very easy and practical to use; however, all the unknown incident durations were set to 23 minutes, and this oversimplification of the model was detrimental to the accuracy of the predictions.
Other papers that present complementary statis-tical analyses of incident duration include Wang (1991), Sullivan (1997), Cohen and Nouveliere (1997), Garib et al. (1997), Smith and Smith (2000), and Fu and Hellinga (2002).
FL has been used in the transportation field since the theory was first developed by Zadeh (1965). The method offers much potential in the traffic and transport field, because many problems and param-eters are characterized by linguistic variables. More-over, many problems in this field are ill defined, ambiguous, and vague. Such situations are difficult to model using traditional methods. A review by Teodorovic (1999) of state-of-the-art FL systems for transport engineering clearly showed the potential for the application of FL.
Choi (1996) was the first researcher to use an FL system to predict incident duration. He used incident data on vehicle problems, types of assistance, and the location of disabled vehicles to demonstrate the suitability of FL for solving problems characterized by elements of uncertainty and ambiguity. Moreover, the FL system was shown to perform well with fewer variables compared with the statistical models.
Kim and Choi (2001) updated the model and improved the performance by refining the fuzzy sets. However, the authors did not categorize the type of incidents, and this may have a significant effect on incident duration. Another shortcoming of this work is the limited incident data available to validate the model in this research.
A Wang et al. (2002) study used FL to model vehicle breakdown duration by analyzing the char-acteristics of the breakdown by vehicle type, time of day, and location. Over 200 incident records from
the M4 Motorway in the United Kingdom were used to demonstrate the credibility of the FL approach for estimating incident duration.
A number of studies have reported the increasing popularity of the application of the ANN theory to transportation. A review by Dougherty (1995) reported its wide application in a number of areas (e.g., traffic control, vehicle detection, driver behavior analysis, traffic pattern analysis, traffic forecasting, and parameter estimation). More recent applications include incident detection analysis by Teng and Qi (2003) and Yuan and Cheu (2003). The theory of ANN is presented later in this paper.
In summary, incident duration research has been developed gradually over the last decade. Various methods have been applied, including statistical analysis and fuzzy logic. However, comparing pre-vious research results is difficult for a number of reasons: different variables have been used by the researchers; the data were collected from different areas in the world; and each dataset had its own characteristics. This review has provided us with the foundation on which we developed an alternative approach to model traffic incident duration using ANN. The results are presented here and are com-pared with those of an FL model, building on the earlier work of Wang et al. (2002).
DATA DESCRIPTION
For this research, the incident duration data were collected from one of the busiest roads in the United Kingdom, the M4 between Junction 22 and Junction 49. The average traffic flow on this section of the M4 was 65,000 vehicles per day, with a maximum flow of 102,000 vehicles per day in 2001 (Depart-ment for Transport 2002).
The Road Network Master Database (RNMD) stores all the information, which can be processed, transferred, and published to a third party as well as the public (James and Wainwright 2002).
We obtained 1,080 incidents records from RNMD for May 2000 to April 2001. The incidents were divided into three types: crashes, vehicle break-downs, and other incidents. The majority of inci-dents were vehicle breakdowns, 64% of all the traffic incidents on the motorways. Crashes and other incidents made up the remainder, 20% and 16% of all incidents, respectively.
This paper reports the results of 695 vehicle breakdowns. Many of the records were incomplete; that is, the end time of the incidents was often not recorded. An in-depth look at the data gave us 213 complete incident records, which we present in this paper.
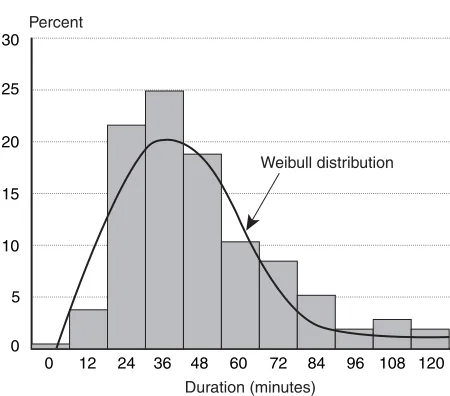
Figure 2 shows the distribution of the incident duration. A Kologorov-Smirnov test shows that it conforms to a Weibull distribution (sig. = 0.432), instead of a log-normal distribution (sig. = 0.043), which is consistent with the research of Nam and Mannering (2000).
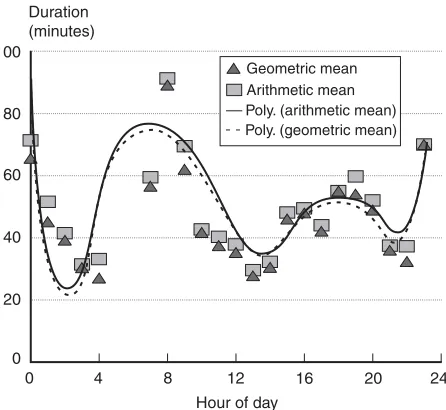
Figure 3 demonstrates that incident duration dis-plays a relationship to the time of day and shows peaks during the morning and evening rush hour. The figure also shows that vehicle breakdown
dura-tion tends to be longer at night. These characteristics are consistent with the higher traffic flow that causes congestion during the day and the poorer quality of recovery service during the late evening and over-night when traffic flows are substantially lower.
[image:6.612.122.491.63.287.2]Figure 4 compares the arithmetic and geometric means of the vehicle breakdown data according to vehicle type. As expected, the geometric mean is consistently smaller than the arithmetic mean for all vehicles, because most incidents are of short dura-tion. So the distribution is skewed to the right. The
FIGURE 1 Map of the M4 Motorway
Source: Available at www.traffic-wales.com.
A48
A483
M4
Swansea
M4
Bridgend
A4232 CARDIFF A48M
Newport
M5 M49 M4 M48 A449
M4
A40 A40
A4042 A465 A40
A465 A470
Merthyr Tydfil
A4060
A470
[image:6.612.314.539.345.543.2]M4 A465
FIGURE 2 Distribution of Vehicle Breakdown Duration
0 12 24 36 48 60 72 84 96 108 120
0 5 10 15 20 25 30
Duration (minutes) Percent
WANG, CHEN & BELL 5 duration of a tanker breakdown is the greatest,
which is not surprising. The latter interpretation, however, should be viewed with caution due to the small sample size for this type of incident.
Based on the available data and discussions with the operators in the traffic control center, the poten-tial variables to be considered in the vehicle break-down duration model were vehicle type, location,
time of day, and report mechanism. We investigated the difference between the incident duration cate-gories using the Kruskal-Wallis test, the results of which are shown in table 1. This test indicates that the overall differences between the categories are sta-tistically significant, in particular the vehicle types and report mechanisms categories had a significance level of less than 0.001.
VEHICLE BREAKDOWN DURATION MODELING
In this section, we present two vehicle breakdown duration models. The first is based on FL, while the second uses the ANN approach.
The Model Based on FL
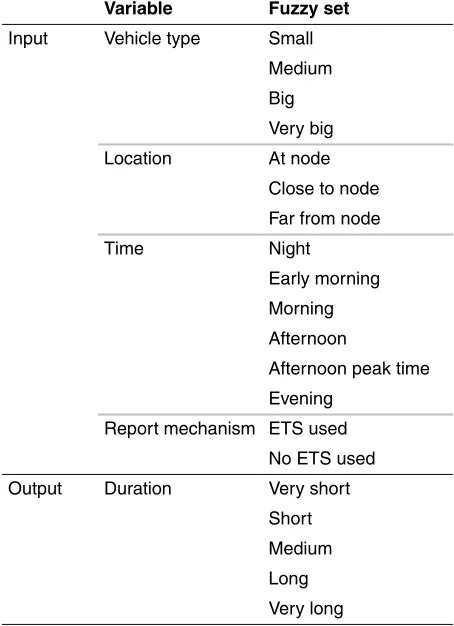
This research used the Mamdani-type FL system. Mamdani (1974) proposed this method in an attempt to control a steam engine and boiler combi-nation by synthesizing a set of linguistic control rules obtained from experienced human operators. The Mamdani-type inference expects the output membership functions to be fuzzy sets. After the aggregation process, the fuzzy set for the output variable needs defuzzification. The inputs of the incident duration were vehicle type, location, time of day, and report mechanism. The dependent vari-able was the vehicle breakdown duration. These are detailed in table 2.
[image:7.612.75.298.75.280.2]Figure 5 illustrates the structure of the FL system. The system comprises four elements: the fuzzifier that maps the crisp value into a fuzzy set; the rule base that saves the fuzzy rules; the interface that gen-erates the fuzzy output from the input based on the fuzzy rules; and finally the defuzzifier that transfers
[image:7.612.316.542.77.170.2]FIGURE 3 Vehicle Breakdown Duration and Time of Day
FIGURE 4 Vehicle Breakdown Duration and Vehicle Type
Key: HGV = heavy goods vehicle (over 3,500 kg or 7,716 lbs design, gross vehicle weight).
100
80
60
40
20
0
0 4 8 12 16 20 24 Duration
(minutes)
Hour of day
Geometric mean Arithmetic mean
Poly. (arithmetic mean) Poly. (geometric mean)
80
70
60
50
40
30
20
10
0
Motorcycle
Car Van
HG
V
Tank er tr
uck
Total Arithmetic mean
Geometric mean Duration (minutes)
Vehicle type
TABLE 1 Kruskal-Wallis Test of Vehicle Breakdown Duration
Variable Chi-square df Si
gnificance level
Report mechanism
16.7 1 0.44*10E–4
Vehicle type 17.1 3 0.67*10E–3
Location 8.5 2 0.014
[image:7.612.72.295.333.556.2]the fuzzy output into a crisp value. The detailed explanation of the FL theory can be found in Pedrycz and Gomide (1998).
This research was based on the fuzzy sets of each variable, the characteristics of the data presented above, and the fuzzy rules derived from an under-standing of the experience of the operators at the
MANTAIN CYMRU TMIC gained in the interview surveys. One example of the 112 fuzzy rules used in this work is the following:
If the vehicle is CAR, and location is AT THE JUNCTION, and the time is MORNING, and the report mechanism is ETS (emergency telephone service),
then the vehicle breakdown duration is SHORT.
There are many defuzzification methods, includ-ing the mean of the range of maximal values and the center of the area that returns the center of gravity of the area under the curve. The latter is the most popular method used in defuzzification and the one adopted in this study.
[image:8.612.71.298.61.374.2]Matlab was used to generate the model and sim-ulate the results. Figure 6 shows the model surface depending on the vehicle type and time of day and clearly illustrates the nonlinear relationship between the inputs and outputs.
Figure 7 displays the value predicted using FL compared with the observed value. The model shows promise as an estimator of breakdown dura-tion and the pattern of results is consistent with the research by Cohen and Nouveliere (1997).
The Model Based on the ANN System
An ANN is a massively parallel distributed pro-cessor that has a natural propensity for storing experiential knowledge and making it available for use (Aleksander and Morton 1990). The knowledge is acquired through a learning process and is stored as synaptic weights. The structure of the ANN is described later in this section.
The advantages of the ANN are as follows. First, the ANN is nonlinear, thus it can be applied to model a nonlinear physical mechanism easily. Sec-ond, the learning process enables the ANN to be modified, in accordance with an appropriate statis-tical criterion, to minimize the difference between the desired response and the actual response of the network driven by the input. This makes the ANN a suitable candidate to model incident duration.
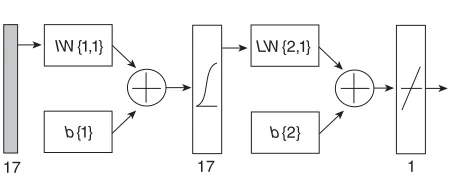
[image:8.612.68.301.65.480.2]In this research, a multilayer perceptron network was used, in which IW{n,1} is the input weight matrix; LW{n,1} is the layer weight matrix; and b{n} are bias vectors, where n is the layer number. The
TABLE 2 Variables in the Fuzzy Logic Model
Variable Fuzzy set
Input Vehicle type Small Medium Big Very big Location At node
Close to node Far from node
Time Night
Early morning Morning Afternoon
Afternoon peak time Evening
Report mechanism ETS used No ETS used Output Duration Very short
Short Medium Long Very long Key: ETS = emergency telephone service.
FIGURE 5 Structure of the FL System
Rule base
[image:8.612.70.297.393.593.2]WANG, CHEN & BELL 7 choice of the neurons in the ANN is based on the
number of inputs, outputs, and the sample size. The neuron number is determined following the guide by NeuralWare (1993). In this research, to maintain simplicity and avoid redundant architecture the ANN model has 17 neurons in one hidden layer (figure 8).
The output of each layer, which is the input for the next layer, is calculated using the following for-mula:
where
yj = the jth output, = the bias in the nodes, wij = the weight,
N = the number of inputs, and N1 = the neuron number.
In this research, the transfer function of the first hidden layer was the sigmoid function:
In the output layer, a linear function is used as the transfer function to generate the desired output.
The inputs to the ANN system were vehicle type, location, time of day, and report mechanism. The output was vehicle breakdown duration. The ANN model was trained with the back-propagation
[image:9.612.157.456.67.247.2]training algorithm (Lau 1992), which is a generali-zation of the least mean squares algorithm. It uses a gradient search technique to minimize the mean square difference between the desired and the actual outputs.
FIGURE 6 Surface of the FL System
Duration (minutes)
15 10
5
0 0 1
2 3
4 5
80
70
60
50
40
30
20
20
Time of day Vehicle type
yj f wijxi–θj i=0
N–1
∑
⎝ ⎠
⎜ ⎟
⎜ ⎟
⎛ ⎞
0≤ ≤j N1–1
=
θj
f x( ) 1
[image:9.612.315.537.312.502.2]1 e–x + ---=
FIGURE 7 Result of the FL Model
FIGURE 8 Structure of the ANN System
140
140 120
120 100
100 80
80 60
60 40
40 20
20 0
0
Modeled value (minutes)
Observed value (minutes)
17 17
IW{1,1}
b{1}
LW{2,1}
b{2}
[image:9.612.314.539.538.625.2]Of the 213 vehicle breakdown incidents, 113 inci-dents were used to train the model and 50 were used in validation during the training. The remaining 50 incidents were used to test the performance of the model. Figure 9 compares the ANN prediction with the observed value with encouraging results. It demonstrates that the performance was better than that of the FL model, because the predicted value was closer to the observed value. However, it also shows that the ANN model systematically gener-ated the same durations when the observed values were different. In general, the ANN in this case failed to predict the larger values and outliers. One reason for this was that the number of explanatory variables was insufficient. Therefore, the ANN model could not be trained to perform well. This problem could be solved by including additional variables and is a subject of future research.
In order to estimate the influence of the input variables on the output of the model, we conducted a sensitivity test. This was achieved by excluding one input variable at a time and quantifying the deterioration of the performance of the prediction caused by the missing variable. The performance measure used was defined as the percentage change in the root mean square error (RMSE). The RMSE gives a measure of the difference between the observed and modeled value. It is defined as:
where
fn = the modeled value, vn = the observed value, and N = the number of observations.
The percentage change of the error P% is given by
where
RMSEn = the RMSE of the model with all n inputs.
The sensitivity test showed that all four variables influenced the performance of the ANN vehicle breakdown duration model, as the error consis-tently increased when each input was removed from the model. In particular, the report mechanism was found to have the greatest effect, because the error increased by 23% when it was removed from the model. The location had the least effect, with a 12% increase (table 3).
COMPARISON OF THE RESULTS OF FL AND ANN
We conducted statistical tests to compare the perfor-mance of these two models. In this paper, the R2 test and the RMSE were applied. These methods are commonly used to evaluate the relative performance of traffic models (Clark et al. 2002).
[image:10.612.73.299.66.256.2]The coefficient of variation R2 is shown in table 4. We tested two ANN models, one with 17 neu-rons in the hidden layer and one with 10 neuneu-rons in the hidden layer, and found that the number of neurons affects the performance of the model. The table shows that the ANN model with 17 neurons
FIGURE 9 Result of the ANN Model
140
140 120
120 100
100 80
80 60
60 40
40 20
20 0
0
Modeled value (minutes)
Observed value (minutes)
RMSE 1
N
--- (fn–vn)
2
n=1
[image:10.612.318.543.347.496.2]N
∑
=TABLE 3 Sensitivity Test of the ANN Input Variables
Model RMSE
Error increase
ANN model with all four inputs 19.5
ANN model without report mechanism
24.1 23%
ANN model without vehicle type
23.8 22%
ANN model without time of day
22.5 15%
ANN model without location 22.0 12% Key: RMSE = root mean square error.
P% RMSEn–1–RMSEn
RMSEn
---×100%
WANG, CHEN & BELL 9 performed best, while the performance of the FL
model fell in the middle of the two ANN models. At the time that an incident occurs, the operator in the control center estimates the anticipated duration of the resulting congestion, based on engineering judg-ment and experience. The RMSE of this estimation is 42 minutes. It shows that both the ANN models and the FL model gave better estimates than the operators judgment.
Both ANN and FL methods show promise in pre-dicting the incident duration. However, given that the R2 value is not very high, and the RMSE value is large, the performance needs to be improved. This can be addressed by including more variables in the model. However, this requires more data to be collected and the cooperation of the operators and those responsible for motorway incident manage-ment. Future work will be concentrated in these areas. Despite the fact that the significance levels of the three models are low, the modeled values are consistently better than the estimated values by the operators. Therefore, these results are of interest to the motorway incident management team.
CONCLUSIONS
This paper analyzed the characteristics of vehicle breakdown duration and the main factors that may affect the duration. Two models, one based on FL and the other on ANN, were developed and their performances compared.
The research demonstrated that FL and ANN can provide reasonable estimates for the breakdown duration with few variables. They consistently out-perform the existing method based solely on the engineering judgment of the operators. Also, for the
specific data used in this research, the ANN model performed better than the FL model according to the characteristics of statistical parameters. How-ever, both models had difficulties in predicting the outliers. As further data characterizing the outliers become available, the relative performance of ANN and FL may change.
Finally, the research highlights the need to collect information required for incident management in a standard way to improve the accuracy of predic-tion, enhance the management of incidents, and enable the authorities to share the data. Current research, using a specially designed electronic data-base tool, will improve the quantity and quality of the data records and thus begin to explain more of the variation in the data. In the future, the combined FL-ANN approach can be used to analyze incident duration, because this method can combine the experiences of the experts and the statistical charac-teristics of ANN.
ACKNOWLEDGMENT
The authors would like to thank W.S. Atkins for supplying the traffic data used in this study.
REFERENCES
Aleksander, I. and H. Morton. 1990. An Introduction to Neural Computing. London, England: Chapman & Hall.
Choi, H.-K. 1996. Predicting Freeway Traffic Incident Dura-tion in an Expert System Context Using Fuzzy Logic, Ph.D. dissertation. University of Southern California.
Clark, S.D., S.M. Grant-Muller, and H. Chen. 2002. Using Nonparametric Tests to Evaluate Traffic Forecasting Perfor-mance. Journal of Transportation and Statistics 5(1):47–56. Cohen, S. and C. Nouveliere. 1997. Modelling Incident Duration on an Urban Expressway. IFAC/IFIP/FORS Symposium. Edited by M. Papageorgiou and A. Pouliezos. Chania, Greece.
Department for Transport. 2002. Transport Statistics Bulletin: Road Traffic Statistics: 2001. Compiled by A. Silvester and A. Smith. London, England.
Dougherty, M. 1995. A Review of Neural Networks Applied to Transport. Transport Research C 3:247–260.
Fu, L. and B. Hellinga. 2002. Real-Time, Adaptive Prediction of Incident Delay for Advanced Traffic Management Systems.
Proceedings of the Annual Conference of the Canadian Institute of Transportation Engineers, May 12–15, 2002, Waterloo, Ontario, Canada.
TABLE 4 Comparison of the FL and ANN Models
Model R2
Adjusted
R2 Sig. RMSE
FL model 0.265 0.262 0.000 24.0
ANN model 1* 0.414 0.411 0.000 19.5
ANN model 2** 0.215 0.211 0.000 24.1 * ANN model 1 has 17 neurons in the hidden layer.
Garib, A., A.E. Radwan, and H. Al-Deek. 1997. Estimating Magnitude and Duration of Incident Delays. ASCE Journal of Transportation Engineering 123:459–466.
Giuliano, G. 1989. Incident Characteristics, Frequency, and Duration on a High Volume Urban Freeway. Transportation Research A 23:387–396.
Golob, T.F., W.W. Recker, and J.D. Leonard. 1987. An Analysis of the Severity and Incident Duration of Truck-Involved Freeway Accidents. Accident Analysis and Prevention
19:375–395.
James, J.L. and A.K. Wainwright. 2002. Proactive Traffic Management in Wales. 11th IEE International Conference on Road Transport Information and Control. London, England: IEE Press.
Jones, B., L. Janssen, and F. Mannering. 1991. Analysis of the Frequency and Duration of Freeway Accidents in Seattle.
Accident Analysis and Prevention 32:239–255.
Lau, C. 1992. Neural Networks—Theoretical Foundations and Analysis. New York, NY: IEEE Press.
Lindley, J.A. 1987. Urban Freeway Congestion: Quantification of the Problem and Effectiveness of Potential Solutions. ITE Journal 57:27–32.
Kim, H.J. and H.-K. Choi. 2001. A Comparative Analysis of Incident Service Time on Urban Freeways. Journal of the International Association of Traffic and Safety Sciences
25:62–72.
Mamdani, E.H. 1974. Application of Fuzzy Algorithms for Control of Simple Dynamic Plant. Proceedings of IEEE, Control and Science 121(12):1585–1588.
Nam, D. and F. Mannering. 2000. An Exploratory Hazard-Based Analysis of Highway Incident Duration. Transporta-tion Research A 34:85–102.
NeuralWare, Inc. 1993. Neural Computing. Carnegie, PA. Pedrycz, W. and F. Gomide. 1998. An Introduction to Fuzzy
Sets: Analysis and Design. Cambridge, MA: MIT Press.
Sethi, V., F.S. Koppelman, C.P. Flannery, N. Bhomderi, and L. Schofer. 1994. Duration and Travel Time Impacts of Inci-dents—ADVANCE Project Technical Report. Northwestern University, Evanston, IL. Quoted in K. Ozbay, and P. Kachroo. 1999. Incident Management in Intelligent Trans-portation Systems. Boston, MA: Artech House.
Smith, B.L. and K.W. Smith. 2000. An Investigation into Incident Duration Forecasting for Fleetforward. Charlottesville, VA: University of Virginia.
Sullivan, E.C. 1997. New Model for Predicting Freeway Inci-dents and Incident Delays. ASCE Journal of Transportation Engineering 123:267–275.
Teng, H. and Y. Qi. 2003. Detection-Delay-Based Freeway Inci-dent Detection Algorithms. Transport Research C 11:265– 287.
Teodorovic, D. 1999. Fuzzy Logic Systems for Transportation Engineering: The State of the Art. Transportation Research A
33:337–364.
U.S. Department of Transportation (USDOT), Federal Highway Administration. 2000. Traffic Incident Management Hand-book. Washington, DC.
Wang, M. 1991. Modelling Freeway Incident Clearance Time, M.S. thesis. Northwestern University, Evanston, IL. Quoted in K. Ozbay, and P. Kachroo. 1999. Incident Management in Intelligent Transportation Systems. Boston, MA: Artech House.
Wang W., H. Chen, and M.C. Bell. 2002. A Study of Character-istics of Motorway Vehicle Breakdown Duration. 11th IEE International Conference on Road Transport Information and Control. London, England: IEE Press.
Yuan, F. and R.L. Cheu. 2003. Incident Detection Using Support Vector Machines. Transport Research C 11:309–328. Zadeh, L. 1965. Fuzzy Sets. Information and Control 8:338–