This is a repository copy of
The effect of trails on first-time and subsequent navigation in a
virtual environment
.
White Rose Research Online URL for this paper:
http://eprints.whiterose.ac.uk/4961/
Proceedings Paper:
Ruddle, R.A. (2005) The effect of trails on first-time and subsequent navigation in a virtual
environment. In: Frohlich, B., Julier, S. and Takemura, H., (eds.) Conference Proceedings.
IEEE Virtual Reality 2005. IEEE VR, 2005, 12-16 March 2005, Bonn, Germany. IEEE , pp.
115-122. ISBN 0-7803-8929-8
https://doi.org/10.1109/VR.2005.1492761
[email protected]
https://eprints.whiterose.ac.uk/
Reuse
See Attached
Takedown
If you consider content in White Rose Research Online to be in breach of UK law, please notify us by
The Effect of Trails on First-time and Subsequent Navigation
in a Virtual Environment
Roy A. Ruddle
*School of Computing, University of Leeds, UK.
ABSTRACT
Trails are a little-researched type of aid that offers great potential benefits for navigation, especially in virtual environments (VEs). An experiment was performed in which participants repeatedly searched a virtual building for target objects assisted by: (1) a trail, (2) landmarks, (3) a trail and landmarks, or (4) neither. The trail was displayed as a white line that showed exactly where a participant had` previously traveled. The trail halved the distance that participants traveled during first-time searches, indicating the immediate benefit to users if even a crude form of trail were implemented in a variety of VE applications. However, the general clutter or “pollution” produced by trails reduced the benefit during subsequent navigation and, in the later stages of these searches, caused participants to travel more than twice as far as they needed to, often accidentally bypassing targets even when a trail led directly to them. The proposed solution is to use gene alignment techniques to extract a participant’s primary trail from the overall, polluted trail, and graphically emphasize the primary trail to aid navigation.
CR Categories: I.3.7 Three-dimensional graphics and realism: Virtual Reality. H.5.2 Information interfaces and presentation (e.g., HCI): Miscellaneous.
Keywords: Virtual Environment, Navigation, Navigation Aid, Trail, Landmark
1 INTRODUCTION
The difficulty that people often have navigating in virtual environments (VEs; virtual reality worlds) is well known. It is characterized by much slower acquisition of spatial knowledge than in the real world [37] and, sometimes, extreme difficulty finding places during exploration. The general process of navigation involves learning the location of landmarks, routes and, eventually, an accurate cognitive map [7]. However, during this process 20-30% of people typically experience substantial navigational problems [30]. Research into the causes of these problems shows visual detail such as landmarks only plays a modest role in efficient navigation [35, 36], as does a wide field of view (FOV) [20, 29, 31], and similar navigational problems occur with desktop and immersive head-mounted displays [31, 33]. Physical movement provides body-based information that benefits navigation [2, 6, 16, 29] and aids maneuverability [38],
and decoupling the view and travel direction is beneficial for some types of task [4]. In addition, other research has investigated aids to navigation, principally maps [9, 28, 32].
In this article we investigate the effect that trails have on navigation. Trails are an often proposed, but little studied, navigational aid that provides an explicit indication of where a person has previously traveled. During initial exploration of an environment trails highlight places that still have to be visited and should also prevent the person from repeatedly retracing their steps, a form of navigational inefficiency that has often been observed in environments as diverse as very large virtual seascapes (100 x 100 km), to buildings and even virtual rooms [30, 31, 32]. During subsequent searching of the environment the person can be sure of reaching places again if they follow their trail, although this could be at the expense of missing short cuts that would shorten the path.
The next section outlines existing research into trails and describes heuristics that may be adopted to perform trail-guided navigation both on the first occasion a person visits an environment and on subsequent occasions. This is followed by a description of an experiment that analyzed the performance and behavior effects that trails had on participants the first time they searched a virtual building for target objects, and when they subsequently navigated the building to search several more times for the objects.
2 TRAILS
Trails have played an important role in real-world navigation for many thousands of years. Hunters follow an animal’s trail (spoor) to track it down, soldiers sometimes follow small signs that are left unintentionally to pursue other men, the same small signs can be useful during search and rescue operations, and boy scouts are often shown how to both mark and follow trails [1]. On an everyday basis, people follow trails to minimize the physical effort of traveling between places, especially in snow or thick forest, and use trails to simplify decision making when walking in the countryside. In certain specialized sectors of society trails are essential for safety, with a good example being the sport of cave diving in which divers almost always unroll a continuous guideline from the place they enter a cave system to ensure they can find their way back through a complex set of underground passages, often in poor visibility [14].
Simple forms of trail are also in everyday use in information spaces, with web browser history lists providing users with an explicit reminder that helps them to revisit specific places, and color being used on well designed websites to distinguish between previously visited and unvisited links, helping users to return to old places or choose to browse somewhere new. Pre-dating this by almost 50 years was the suggestion that people could share their trails to assist each other in searching for information [5], a concept that has evolved into the general field of social navigation [10, 18].
*e-mail: [email protected]
IEEE Virtual Reality 2005 March 12-16, Bonn, Germany 0-7803-8929-8/05/$20 ©2005 IEEE
Despite the great benefits that trails are known to provide in both real-world and information spaces, trails have hardly ever been implemented, let alone studied, in VEs. Instead, most VEs suffer from a syndrome of “extreme cleanliness” because users are never allowed leave behind any trace of their occupation or movements [15]. Compare that with the real world!
The small amount of trail-based research that has been carried out in VEs can be summarized as follows. The earliest work in this area was a pilot study that included the use of “virtual breadcrumbs” [8]. Observations made by the experimenter indicated that participants used the breadcrumbs in two ways: (i) to indicate the regions that had been searched (breadcrumbs were deposited either manually or automatically during travel), and (ii) to deliberately mark particular places that would need to be revisited (e.g., the start point). Anecdotal evidence indicated that breadcrumbs were beneficial during a first time search, because the places that had (not) been visited could be clearly distinguished, but problems occurred during repeated navigation because the environment became cluttered with breadcrumbs (“trail pollution”) and it became difficult to determine which breadcrumbs belonged to any given trail. During subsequent studies the breadcrumbs were replaced by arrows but it was observed that participants tended to ignore the directional information as trail pollution increased and, when a trail was simultaneously presented within an environment and on a map, participants only used the latter [7]. Another group of researchers also implemented virtual breadcrumbs but did not perform any evaluation [11], and in a study that used functional magnetic resonance imaging (fMRI) a trail was used to trivialize the task of navigation for a control group [3]. Recently, a series of VEs have been designed that allowed users to leave behind virtual footprints, fingerprints and fossils [15, 23, 24]. Features implemented included a variety of footprint icons to allow users to be distinguished from each other, the ability for the trails to “wear out” (i.e., fade away by being displayed progressively more transparent as time passed) and filtering mechanisms that allowed users to control which trails were displayed at any given time. The trails were rendered as “deep pixels” [25] meaning that, as well as showing a user’s path, each footprint could be queried to ascertain information such as who had left it and when. A think aloud methodology was used to perform a detailed evaluation of the functionality of the trails and their user interface, but no performance difference was found between participants who navigated with trails and those who navigated without [22].
2.1 Heuristics for Trail Use in VEs
The evidence to date indicates that trails are useful for first time navigation in a VE, but that trail pollution impedes their utility during subsequent navigation. To assess why this might be so it is useful to identify heuristics that users could use when searching for places during trail-assisted navigation. The heuristics described in the following sections assume a user performs a task in which they repeatedly navigate an environment, searching for a given set of target locations.
2.1.1 Heuristics for First-time Navigation
During first-time navigation all a user has to do is to keep looking in parts of the environment they have not previously visited until all the targets had been found. A simple heuristic of go somewhere new suffices. Occasionally, of course, the user is likely to arrive back at a junction from which all paths have already been traveled but if this occurs then all that the user has to do is to look around and head toward places that remained untraveled.
Most environments contain some cul-de-sacs and if a user travels down one of these then they have no option but to
backtrack. Indeed, it is well known that backtracking is a strategy that is deliberately adopted by users during a variety of forms of navigation [12, 21].
2.1.2 Heuristics for Subsequent Navigation
During subsequent navigation the role of a trail changes to identifying the parts of an environment that a user should travel. The simplest heuristic would be to follow the existing trail but rigid adherence to this would prevent the user from improving on the route followed in the first search. In practice, users can be expected to attempt to take short cuts, some of which will be successful and some not. This leads to the following key heuristics.
First, a user may choose to travel where they have been onall previous occasions except the current. Second, the user maygo somewhere newin an attempt to find a shortcut. If the shortcut was successful then next time around the user may choose to travel where they went on the preceding occasion but not the current. Finally, as in first-time navigation, the user may deliberately backtrack either to correct errors made during navigation or after traveling down a cul-de-sac.
2.1.3 Combining Trails with Landmarks
An interesting question is how searching may be modified if trails are added to an environment that contains a variety of landmarks, whether those landmarks are objects that are added for the express purpose of aiding navigation, arise from particular structural features, or are simply a result of the amount of visual detail present in a photorealistic scene. For a first-time search, trails provide an explicit indication of where a user has traveled, whereas with landmarks the user has to rely on their memory. Trails are likely to promote more efficient searching than landmarks because the user’s memory for the latter will be error prone (perfect knowledge in-the-world vs. imperfect knowledge in-the-head[17]).
For subsequent searches, trails and landmarks are complementary because the latter add a certain amount of temporal stability to an environment whose visual appearance is being continually modified by the addition of new trails. As an example, consider a user arriving at a particular junction in a virtual building. The user may remember that they need to follow the corridor that only contains one trail, but then on the next occasion that corridor will contain a second trail. On the other hand, if the user remembers they should follow the right hand trail at a given landmark then the location-action pairing (landmark & right hand trail) is constant no matter how many times a corridor is traversed. The trail still distinguishes between corridors that have (not) been traveled and the landmark makes it more likely that the junction will be correctly identified.
3 EXPERIMENT
The remainder of this article reports an experimental study that investigated participants’ performance and behavior when they repeatedly searched a virtual building for target objects. A two-factor, between participants design was used to investigate the effect of trails and landmarks, with participants randomly allocated to one of four groups that had: (1) no trail or landmarks, (2) a trail, (3) landmarks, or (4) a trail and landmarks. Participants had no prior knowledge of the buildings. The targets were distributed throughout so participants had to conduct a near-exhaustive search on the first occasion. On subsequent searches participants simply had to revisit the targets. Participants were always allowed to find the targets in any order
navigated four times and which familiarized participants with the experimental task and also allowed them to adapt their behavior to information that the VE provided (e.g., trails or landmarks). The third, test building was navigated five times. However, participants in the two trail groups were only provided with a trail for the first four navigational sessions in this building. At the beginning of the fifth session they were informed, without prior warning, they had to do without! This allowed participants’ dependency on the trail to be assessed.
The trail was equivalent to a ball of string that a participant unrolled while they traveled, and was added to each time the participant entered a given environment to search for a set of target objects. Thus, the trail provided information on the frequency with which the participant had previously traversed each part of the environment, but no information on the direction of travel or how recently the travel took place.
3.1 Method
3.1.1 Participants
Sixteen postgraduate students (eleven men and five women) took part in the experiment. Their mean age was 25.0 years (SD= 3.2). All the participants volunteered for the experiment, gave their informed consent, and were paid an honorarium for their participation.
3.1.2 Materials
The VE software was an OpenGL application that ran on an SGI Linux PC. The display was a 43cm monitor that had a resolution of 1600 x 1200 pixels. The horizontal graphical FOV was 90 degrees, which allowed participants to simultaneously look down two corridors that intersected at 90 degrees, albeit with the disadvantage of introducing some distortion from the physical FOV. The application update rate averaged 50 Hz. Data concerning a participant’s position and orientation in a VE was recorded to disk in real-time.
Three virtual buildings were designed, each with a set of rooms bounded on two sides by a wide entrance hall (see Figure 1). The rooms were all the same size and were laid out using a regular grid pattern. Each room contained one entrance, which was always “open” (no door) and allowed participants to look inside. In each building some of the rooms contained a target object (a picture of an object, texture mapped onto a 1.5m side cube that was positioned in the center of the room), and the remainder of the rooms were empty. Different objects were used as targets in the three buildings, with the landmark objects (see below) being different again.
The building that was used to familiarize participants with the user interface contained four rooms and four target objects. The practice building contained eight rooms arranged in a 4 x 2 grid, and three targets. The test building (see Figures 1 & 2) contained 24 rooms (6 x 4 grid) and six targets. In the test building, two of the targets (dog and strawberry) were accessed from dead-end corridors, but the others were on through sections of corridor (car, clock, piano and saucepan).
For participants in the two landmark conditions, pictures of objects that were texture mapped onto 0.75m side cubes were placed at every intersection point in the building’s grid pattern and in the entrance halls (see Figure 1). Different landmark objects were used in the practice and test buildings.
The user interface utilized the mouse and keyboard. To move forward, backward, left or right a participant held down the appropriate cursor key, which moved them at 2 m/s (a fast walk). If a participant held down pairs of keys such as forward/left then they moved diagonally. Moving the mouse up/down allowed the participant to look up to 90 degrees up/down. Moving the cursor
to the left or right rotated the view direction in that direction at a rate that increased with the horizontal offset of the cursor from the center of the screen, to a maximum rate of 60 degrees/s.
[image:4.612.332.562.145.289.2]At all times in a given session, the targets that remained to be found were indicated by a text message on the screen. To indicate that a target had been found the participant pressed the <enter> key when they were in the target’s room, which caused the name of that target to be removed from the display.
Figure 1. Plan view of the test building showing the position of the six targets and participants’ start position in each navigation session. The positions of the landmarks (only provided for two
groups of participants) are also marked.
3.1.3 Procedure
Participants were run individually and took up to two hours to complete the experiment. First, the experimenter explained the search task to a participant, and then demonstrated the user interface. Following that, the participant familiarized themselves with the user interface by searching the first virtual building for four targets (one in each of the four rooms).
Next the participant four times searched the second (practice) building for its three targets, finding them in any order. At the beginning of the first of the practice building searches the experimenter pointed out the landmarks and explained that the trail would be added to as the searches progressed (participants in the trail/landmarks conditions only, as appropriate). After a few minutes break the participant then five times searched the third (test) building for the six targets that it contained, again in any order. The participant was informed that each search started in the same place (see Figure 1) and that each building remained unchanged from session to session.
3.2 Results
Participants’ movements in the test building were recorded in real-time to allow navigational performance and behavior to be analyzed. The following sections report results for: (i) participants’ search performance, (ii) the search heuristics that participants used, (iii) the primary cause of the most inefficient searches, and (iv) measures of trail pollution and methods for reducing it.
3.2.1 Search Performance
The minimum distance that participants had to travel to visit the center of all the targets was 281 m (measured along the centerline of the corridors). By comparison, participants would have traveled 781 m if they had traversed once along every corridor in the building while visiting the targets. In fact, participants only had to enter the room that contained each target, not travel to the center. Therefore, for analysis, twice the distance from where a
Dog
Car
S trawberry S aucepan
Piano Clock
Landmark
50 m
S tart Dog
Car
S trawberry S aucepan
Piano Clock
Landmark
50 m
(a) (b)
[image:5.612.68.554.51.457.2](c) (d)
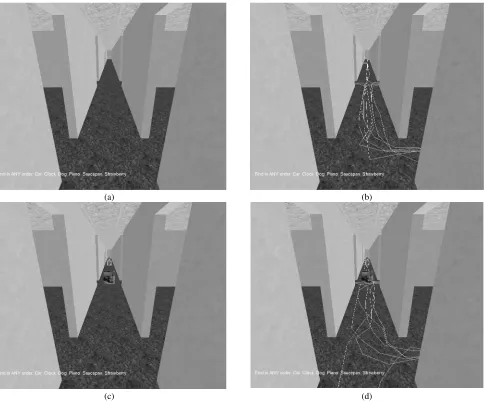
Figure 2. Views inside the test building: (a) no trail or landmarks, (b) a trail, (c) landmarks, and (d) a trail and landmarks. The first doorway on the right is the room containing the strawberry, and the views look toward the room that contains the piano. In (c) and (d) landmark
objects can be seen in the corridor.
participant selected each target to the center of that target was added to the distance that the participant actually traveled. Statistical analyses were performed using mixed design analyses of variance (ANOVAs) that treated the session number as a repeated measure, and the presence of a trail and landmarks as between participants factors. Interactions are only reported if they were significant.
An ANOVA of the data for Sessions 1 - 4 (the sessions during which two of the groups were provided with trails) showed that participants traveled a significantly shorter distance with a trail,
F(1, 12) = 11.98,p< .01, and as the sessions progressed,F(3, 36) = 5.21,p< .01. However, there was no effect of landmarks,F(1, 12) = 0.06, p > .05 (see Figure 3). Dependency on trails was investigated by analyzing the data for Sessions 4 and 5 using a separate ANOVA. This showed a significant interaction between session and trail, F(1, 12) = 15.51, p < .01, and session and landmarks,F(1, 12) = 6.90,p< .05. Although the performance of participants in the two trails groups degraded when the trails were removed they still traveled a slightly shorter distance in Session 5 than participants in the non-trails groups (519 m vs. 556 m).
This study primarily focuses on the effect that trails have on navigation. Target-by-target analysis of the data showed that, in Sessions 2, 3 and 4, trails helped participants to find the first few targets but hindered their searches for the remainder. Expressing search efficiency as the percentage distance a participant traveled from one target to the next in excess of the shortest path (percentage = 100 * (d-s)/s, wheredis the distance traveled and
sis the shortest distance between those two targets), shows that more than 75% of the excess distance traveled in Session 2 occurred for Targets 4-6 and more than 80% of the excess distance in Sessions 3 and 4 occurred for Targets 5 and 6 (see Figure 4). In other words, the problems participants had finding these latter targets had a huge detrimental effect on the overall usefulness of the trails as an aid for subsequent navigation. 3.2.2 Search Heuristics
Sections 2.1.1 & 2.1.2) into post-processing software that modeled participants’ paths as graphs and, for each link traversal in every session, determined which heuristic (if any) explained a participant’s decision making. The length of each link was also taken into account so that the percentage of a participant’s movement that was governed by each heuristic in each session could be calculated (see Figure 5). These data show that during first-time navigation (Session 1) 92% of the movement made by participants who had trails was governed by the heuristics “go somewhere new” and “backtrack”. By contrast, these heuristics only accounted for 67% of the movement made by participants who did not have trails.
[image:6.612.318.522.276.506.2]Figure 3. Distance traveled by participants in the test building. Error bars indicate standard error of the mean (SE).
Figure 4. Percentage distance in excess of shortest path to each target traveled by participants in the two trails groups. Error
bars indicate theSE.
During subsequent navigation (Sessions 2 - 4) approximately 80% of the movement made by participants who had trails was governed by the four named heuristics (“all previous occasions except the current”, “preceding occasion but not the current”, “go somewhere new” and “backtrack”). The remaining 20%, a substantial minority of participants’ movement, corresponds to the difficulty they had finding the later targets that was highlighted in the previous section. For participants who did not have trails the
amount of movement that was not governed by the four heuristics steadily increased, from 20% (Session 2) to 36% (Session 4). 3.2.3 Inadvertently Bypassing Targets
[image:6.612.58.282.402.574.2]The next stage of the analysis was to conduct a detailed assessment of the primary cause of the most inefficient searches that were performed by participants in the two trails groups during Sessions 2 - 4. In total participants found 144 targets during these sessions (8 participants X 3 sessions X 6 targets) and on 11 occasions the participant traveled more than three times the distance of the shortest path from the preceding target. In the majority of these (7 out of 11) the participant had already traveled past the corridor junction that was nearest (or one of the two junctions that were equally near) to the doorway of the room that contained either the target the participant was looking for or another target that had not yet been found during that session. Thus, inefficient searches most often occurred when participants bypassed a target. In this, it should be noted that on all seven of the above occasions a trail already existed from the point of bypass to the target, and sometimes the participant had been traveling directly toward the target but turned and went elsewhere.
Figure 5. Percentage distance traveled by participants in the two trails groups when using each heuristic (S1 = Session 1, etc.).
3.2.4 Trail Pollution
A root cause of the difficulty that participants experienced when searching for the latter targets in Session 2 - 4 was almost certainly trail pollution. In an ideal world a trail would lead from one place to another without ever branching and forcing a participant to choose which of two (or more) alternatives to follow. However, in practice backtracking, route-finding errors and attempts to take shortcuts meant that the trails participants laid became more and more complex, so choosing the trail that led to any given target became progressively more difficult.
Trail pollution may be quantified using standard metrics that measure the structural complexity of a graph. To do this, the trail that existed at the end of each navigational session for each participant was mapped onto a graph of the test building (see Figure 6a), so that the trail graph was the same as the building
Session
1 2 3 4 5
Distance (m)
0 500 1000
1500 No trail or landmarks
Trail Landmarks
Trail and landmarks
% distance traveled when using each heuristic
0 20 40 60 80 100
Trail (S1) Trail (S2) Trail (S3) Trail (S4) No trail (S1) No trail (S2) No trail (S3) No trail (S4)
Go somewhere new Backtrack
All previous sessions except current Preceding session but not current
Target no.
1 2 3 4 5 6
% di
sta
nce
in e
x
cess of shortest path
0 50 100 150 200 250
graph except that links were removed if they had not been traversed in their entirety. Three metrics were then calculated: (i) mean node degree (the mean number of links connected to each node), (ii) number of cycles (in graph theory terminology a cycle occurs when a sequence of links starts and finishes at the same node), and (iii) mean shortest path (the mean shortest distance between each pair of nodes). The degree of a node increased each time a participant deviated from a trail, but if the participant subsequently backtracked along those deviations then following the trail remained straightforward. Cycles occurred when either a participant traveled in a circle or different parts of a trail intersected to make a circle. The greater the number of cycles the more frequently a participant encountered a trail junction and had to decide in which direction to travel, which increased the likelihood of navigational errors. Of course, those junctions also increased the mean node degree. Finally, the shortest path metric took account of the both the number of cycles and their size. All three metrics were significantly correlated with each other (p< .01;n= 32) and, computationally, mean node degree is the most efficient to calculate.
The metrics show that the structural complexity of the trails graphs generally increased as participants’ navigation became less efficient (see Figures 6b & 6c), but branches and cycles mean even the trail left by the most efficient navigator would be non-trivial to follow. What is needed is a techniques to extract the primary path(s) from a network of trails so a distinction may be made between: (i) parts of an environment that are frequently traveled, (ii) those that have only been visited on an occasional basis, and (iii) those that remain completely untouched.
One obvious technique would be to count how often each link had been traversed and to use a frequency threshold to define which links were part of the primary path(s) and which were secondary. However, this has a major disadvantage in that each link is treated individually so any information about sequences of links that were traversed together is lost. In turn, this leads to the primary “path” actually being a disjoint set of different clusters of links.
A much more sophisticated technique, which rewards participants when they traverse the same long sequence of links on a number of different occasions, is one that adopts the approach used in gene alignment [19]. The basic concept is to find the optimal alignment of two sequences by calculating a score that rewards pairs of matching elements (the match bonus) while allowing, for a suitable penalty, brief deviations of one sequence from another to take place. These deviations may either take the form of elements in one sequence being replaced by a different set of elements in the other sequence (themismatch penalty) or one of the sequences having an extra set of elements inserted, for example, when a participant deviated from a path and then backtracked. Generally, two insertion penalties are applied, one each time a new insertion is started (theinsertion origin penalty) and another if an existing insertion is extended (the insertion continuation penalty). A computationally efficient way of calculating the alignment score is provided by the Smith-Waterman algorithm [34].
It is important to choose appropriate parameters for the match bonus and three types of penalty because their ratio to each other affects the number of elements in each alignment. For example, in the two sequences shown below, the first sequence has elements ABCDE in order, but in the second sequence four additional elements (WXYZ) are inserted between the ‘C’ and the ‘D’. With a match bonus = 5, mismatch penalty = -5, insertion origin penalty = -5 and insertion continuation penalty = -1, the sequences ABCDE and ABCWXYZDE are aligned together with a score of 17 (for a detailed description of the process, see [19]). However, if the continuation penalty is set equal to the origin
penalty then the elements ABC become aligned with a score of 15, and the elements DE become a separate alignment that scores 10. If the whole of the two sequences were identical then the alignment score would be 11 x match bonus = 55.
Sequence 1 ABCDELMNOPQ
Sequence 2 STABCWXYZDE
(a)
(b)
[image:7.612.319.557.103.591.2](c)
Figure 6. Graph structure of: (a) the test building (mean node degree = 2.49, number of cycles = 18, mean shortest path =
49.9 m), (b) trail laid by participant who traveled greatest distance (2786 m) in Sessions 1-4; mean degree = 2.23, no.
cycles = 9, shortest path = 51.8 m), and (c) trail laid by participant who traveled least distance (1745m); mean degree
= 2.07, no. cycles = 3, shortest path = 64.2 m). In all the graphs the square nodes are in the center of the rooms that
To minimize fragmentation of the primary trail it is desirable to make the magnitude of the match bonus substantially larger than that of the mismatch and insertion origin penalties, and the insertion origin penalty substantially larger than the continuation penalty. In practice, a certain amount of trial and error is required to determine an appropriate value for each parameter, especially when one is applying the alignment technique for the first time. However, the technique is effective at identifying the primary trail, both for efficient and inefficient navigators (see Figure 7). The primary trail of the participant who, overall, traveled the least distance in the experiment would be straightforward for anyone to follow, even if they had no prior knowledge of the environment. All that is required is that person stuck to the primary trail and backtracked when they reached the end of a cul-de-sac. The primary trail of the participant who traveled the greatest distance in the experiment would be more complex to follow because it is divided into two parts and doesn’t commence at the start point in the virtual building. However, this primary trail still has a much simpler structure than the than the whole (primary and secondary) trail and, therefore, would also be much more straightforward to navigate. Comparison of Figures 5b/c with Figures 6a/b shows that the gene alignment technique joins together frequently traversed links to form the longer, more continuous paths that comprise the primary trail.
(a)
[image:8.612.57.293.301.605.2](b)
Figure 7. Primary (thick solid line) and secondary trails (thin dashed line) of participant who traveled: (a) greatest distance in Sessions 1-4, and (b) least distance. Alignment parameters:
match bonus = 100, mismatch penalty = 10, insertion origin penalty = 10, insertion continuation penalty = 1.
3.3 Discussion
This study investigated the role of a trail and/or landmarks when participants repeatedly searched a virtual building for targets in
any order. Overall, participants searched more efficiently when a trail was provided, traveling an average of 36% less distance than participants who were not provided with a trail. A trail proved beneficial when the environment contained a large number of supplementary landmarks, as well as when it contained a minimum of visual detail. Contrary to expectations, there was no significant difference between the distance participants traveled with and without landmarks. While landmarks do play an important role in navigation, they do not always lead to improvements in navigational performance in studies that are conducted in an experimental setting (e.g., [13, 36]). In the type of environment used in the present study, subtle structural features (e.g., sets of doors and views down corridors) and memory for the movements that were made (left, right, etc.) promoted spatial learning that was as rapid as when a large number of landmark objects were present.
The benefits of trails do, however, need to be qualified because of the notable difficulty participants often experienced when trying to find the latter objects in Sessions 2 - 4. Critical questions are why was this the case, and what can be done to improve matters?
The heuristics data show that participants in the trails groups spent one fifth of Sessions 2 - 4 traveling through parts of the environment that they had already searched in a given session, a much higher proportion than the 8% that occurred during the first-time search (Session 1). In turn this suggests that navigation would be improved if trails were encoded with recency information. However, whether simple forms of coding such as different sessions being displayed in different colors or a trail that fades over time would prove beneficial in practice remains an open research question, especially given that no performance advantages were found in previous studies [7, 22].
Inefficient searches most commonly occurred when participants bypassed a target. Participants could be only a few meters from the doorway of the room that contained a target, and connected to that doorway by a trail, yet chose to travel elsewhere. Sometimes the doorway lay outside a participant’s FOV but on other occasions they had been looking directly at it prior to turning left or right. Clearly, any method that sets out to make a major improvement in trail-assisted navigation needs to address the issue of participants being close to but then bypassing targets. It is possible that this could be achieved by: (i) adding recency information (see above), or (ii) emphasizing the primary trail.
Trail pollution, the visual clutter produced by a multitude of trails being laid over time, made it difficult for participants to distinguish their primary trail from other places they had been. To improve matters, and allow trails to realize their full potential as a navigational aid, a method needs to be devised that automatically extracts the primary trail so different forms of rendering may then be used to make a clear visual distinction between the primary and secondary trails. For this, techniques adapted from gene alignment show considerable promise, particularly because they reduce trail fragmentation. Parallels may be drawn between the likely benefits that this will produce and simplifications in navigation produced by continuous (extended) lines of sight that are predicted by the architectural theory ofSpace Syntaxand known to take place in practice [26, 27, 33]. Further investigations in this area are planned.
help find those targets in the subsequent sessions. However, given that the many users of any given computer application never change the default system parameters, it essential that trails are also designed to be effective without additional user intervention.
REFERERNCES
[1] B. Baden-Powell,Scouting for boys(edited by E. Boehmer), Oxford University Press, Oxford, UK, 2004.
[2] N.H. Bakker, P.J. Werkhoven, and P.O. Passenier, The effects of proprioceptive and visual feedback on geographical orientation in virtual environments. Presence: Teleoperators and Virtual Environments, 8:36-53, 1999.
[3] T. Bartley, E.A. Maguire, H.J. Spiers, and N. Burgess, The well-worn route and the path less traveled: Distinct neural bases of route following and wayfinding in humans.Neuron, 37:877-888, 2003. [4] D.A. Bowman, D. Koller, and L.F. Hodges, Travel in immersive
virtual environments: An evaluation of viewpoint motion control techniques. Proceedings of the Virtual Reality Annual International Symposium (VRAIS’97), IEEE, Los Alamitos, CA, pp. 45-52, 1997. [5] V. Bush, As we may think.Atlantic Monthly, July 1945.
[6] SS. Chance, F. Gaunet, A.C. Beall, , and J.M. Loomis, Locomotion mode affects the updating of objects encountered during travel: The contribution of vestibular and proprioceptive inputs to path integration Presence: Teleoperators and Virtual Environments, 7: 168-178, 1998.
[7] R.P. Darken and B. Peterson, Spatial orientation, wayfinding, and representation. In K.M. Stanney (Ed.) Handbook of virtual environments: Design, implementation, and applications, Lawrence Erlbaum Associates, Mahwah, NJ, pp. 493-518, 2002.
[8] R.P. Darken and J.L. Sibert, A toolset for navigation in virtual environments. Proceedings of User Interface Software & Technology (UIST’93), ACM, NewYork, pp. 157-165, 1993. [9] R.P. Darken and J.L Sibert, Wayfinding strategies and behaviors in
large virtual worlds.Proceedings of the Computer Human Interfaces Conference (CHI’96), ACM, New York, pp. 142-149, 1996. [10] P. Dourish and M. Chalmers, Running out of space: Models of
information navigation. Ancillary Proceedings of the Human-Computer Interaction Conference (HCI’94), British Computer Society, 1994.
[11] J. Edwards and C. Hand, MaPS: Movement and planning support for navigation in an immersive VRML browser. Proceedings of the Second Symposium on the Virtual Reality Modelling Language (VRML’97), ACM, New York, pp. 65-73, 1997.
[12] T.T. Elvins, D.R. Nadeau, R. Schuk, and D. Kirsh, Worldlets: 3-D Thumbnails for Wayfinding in Large Virtual Worlds. Presence: Teleoperators and Virtual Environments, 10:565-582, 2001. [13] G.W. Evans, M.A. Skorpanich, T. Gärling, K.J. Bryant, and B.
Bresolin, The effects of pathway configuration, landmarks and stress on environmental cognition.Journal of Environmental Psychology, 4:323-335, 1984.
[14] M. Farr,The darkness beckons: The history and development of cave diving, Diadem, London, 1991.
[15] G. Grammenos, M. Filou, P. Papadakos, and C. Stephanidis, Virtual prints: Leaving trails in virtual environments, Proceedings of the Eighth Eurographics Workshop on Virtual Reality (EGVE’02), Eurographics Association, Aire-la-Ville, Switzerland, pp. 131-138, 2002.
[16] S.C. Grant and L.E. Magee, Contributions of proprioception to navigation in virtual environments. Human Factors, 40: 489-497, 1998.
[17] W.D. Gray and W. Fu. Ignoring perfect knowledge in-the-world for imperfect knowledge in-the-head: Implications of rational analysis for interface design.Proceedings of the Computer Human Interfaces Conference (CHI’01), ACM, New York, pp. 112-119, 2001. [18] K. Hook, D. Benyon, and A. Munro,Designing Information Spaces:
the Social Navigation Approach. Springer-Verlag, London, 2002.
[19] D.E. Krane and M.L. Raymer, Fundamental concepts of bioinformatics. Pearson Education, New York, 2003.
[20] S. Lessels and R.A. Ruddle, Changes in navigational behaviour produced by a wide field of view and a high fidelity visual scene. Proceedings of the 10th Eurographics Symposium on Virtual Environments (EGVE'04), Eurographics Association, Aire-la-Ville, Switzerland, pp. 71-78, 2004.
[21] N. Milic-Frayling, R. Jones, K. Rodden, G. Smyth, A. Blackwell, and R. Sommerer, SmartBack: Supporting users in back navigation. Proceedings of the 13th international World Wide Web conference (WWW’04), ACM, New York, pp. 63-71, 2004.
[22] A. Mourouzis,Personal communication, 22 January 2004. [23] A. Mourouzis, G. Grammenos, M. Filou, P. Papadakos, and C.
Stephanidis, Virtual prints: An empowering tool for virtual environments.Proceedings of the Tenth International Conference on Human-Computer Interaction (HCI International 2003), Lawrence Erlbaum Associates, Mahwah, NJ, pp. 1426-1430, 2003.
[24] A. Mourouzis, G. Grammenos, M. Filou, P. Papadakos, and C. Stephanidis, Case study: Sequential evaluation of the virtual prints concept and pilot implementation.Proceedings of the Workshop on Virtual Reality Design and Evaluation, Nottingham, UK, 22-23 January 2004. Available on CD, ISBN 083581231.
[25] N. Negroponte,Being digital, Knopf, New York, 1995.
[26] A. Penn, B. Hillier, D. Banister, and J. Xu, Configurational modelling of urban movement networks.Environment and Planning B: Planning and Design, 25:59-84, 1998.
[27] J. Peponis, C. Zimring, and Y.K. Choi, Finding the building in wayfinding.Environment and Behavior, 22:555-590, 1990. [28] J.S. Pierce and R. Pausch, Navigation with place representations and
visible landmarks. Proceedings of the IEEE Virtual Reality Conference (VR’04). IEEE, Los Alamitos, CA, pp. 173-180, 2004. [29] B.E. Riecke, H.A.H.C. van Veen, and H.H. Bülthoff, H. H., Visual
homing is possible without landmarks: A path integration study in virtual reality.Presence: Teleoperators and Virtual Environments, 11:443-473, 2002.
[30] R.A. Ruddle, Navigation: Am I really lost or virtually there? In D. Harris (Ed.) Engineering psychology and cognitive ergonomics (volume 6), Ashgate, Burlington, VT, pp. 135-142, 2001.
[31] R.A. Ruddle and D.M. Jones, Movement in cluttered virtual environments. Presence: Teleoperators and Virtual Environments, 10:511-524, 2001
[32] R.A. Ruddle, S.J. Payne, and D.M. Jones, The effects of maps on navigation and search strategies in very-large-scale virtual environments,Journal of Experimental Psychology: Applied, 5:54-75, 1999.
[33] R.A. Ruddle and P. Péruch, Effects of proprioceptive feedback and environmental characteristics on spatial learning in virtual environments. International Journal of Human-Computer Studies, 60:299-326, 2004.
[34] F.F. Smith and M.S. Waterman, Identification of common molecular sequences.Journal of Molecular Biology, 147:195-197, 1981. [35] S.D. Steck and H.A. Mallot, The Role of Global and Local
Landmarks in Virtual Environment Navigation. Presence: Teleoperators and Virtual Environments, 9:69-83, 2000.
[36] M. Tlauka and P.N. Wilson, The effects of landmarks on route-learning in a computer-simulated environment. Journal of Environmental Psychology, 14:305-313, 1994.
[37] B.G. Witmer, J.H. Bailey, B.W. Knerr, and K.C. Parsons, Virtual spaces and real-world places: Transfer of route knowledge. International Journal of Human-Computer Studies, 45:413-428, 1996.
(a) (b)
[image:10.612.85.550.51.432.2](c) (d)
Figure 1. Views inside the test building: (a) no trail or landmarks, (b) a trail, (c) landmarks, and (d) a trail and landmarks. The first doorway on the right is the room containing the strawberry, and the views look toward the room that contains the piano. In (c) and (d) landmark
objects can be seen in the corridor