2016
Risk Management Framework 2.0
Brent F. RicheyIowa State University
Follow this and additional works at:https://lib.dr.iastate.edu/etd Part of theLibrary and Information Science Commons
This Thesis is brought to you for free and open access by the Iowa State University Capstones, Theses and Dissertations at Iowa State University Digital Repository. It has been accepted for inclusion in Graduate Theses and Dissertations by an authorized administrator of Iowa State University Digital Repository. For more information, please [email protected].
Recommended Citation
Richey, Brent F., "Risk Management Framework 2.0" (2016).Graduate Theses and Dissertations. 16002.
Risk Management Framework 2.0
by
Brent F. Richey
A thesis submitted to the graduate faculty
in partial fulfillment of the requirements for the degree of
MASTER OF SCIENCE
Major: Information Assurance
Program of Study Committee: James Davis, Major Professor
Doug Jacobson James Cannon
Iowa State University
Ames, Iowa
2016
DEDICATION
This thesis is dedicated to the military service members, academics, role models, and
family members that have shaped my views of the world over the past thirty-six years. These
personal relationships have opened doors, provided counsel, broadened my horizons, instilled
values, and ultimately resulted in who I am. The military leaders and academic mentors to
whom I would primarily like to dedicate this thesis are: LTC Matthew Hopper, LTC Jeremy
Bartel, COL Miles Brown, COL Eric Walker, LTC John Williams, LTC Robert Hensley,
MAJ Natalie Bynum, MAJ Frank Krammer, CSM Andy Frye, 1SG John Stockton, MAJ(Ret)
Russell Fenton, LTC Reginald Harris, LTC Dexter Nunnally, COL Barton Lawrence, SFC
(Ret) Corneluis Williams, MSG(Ret) Johnny Escamilla, 1SG(Ret) Dallas Gasque, MAJ
Diane Johnson-Windau, COL (Ret) Eric Albert, SFC Shane Baxter, MAJ Adrienne Crosby,
MAJ Ronnie Slack, CSM Ira Russey, Dr. Jim Davis, Mr. Kenneth Peters, Dr. Evan Hart, Dr.
Peter Li, Dr. Tom Daniels, Dr. Dan Zhu, Dr. Doug Jacobson, and Dr. Yong Guan.
My faith is deeply personal and equally as important as the arts and sciences, and the
following men have set examples and contributed perspectives that have been influential in
this realm: BP Alfonzo Huezo, BP Michael Peden, Bishop Jim Cannon, Bishop Mark
Anderson, Bishop John Albright, Bishop James Reed, LtCol (Ret) Robert Wolfertz, Shane
Van Wey, Chaplain (CPT) Jeff Pyun, Dr. Scott Mere, and my father David Richey.
Last but not least, I would like to dedicate this work to my family members who have
always shown nothing less than unconditional love and support. There are too many
members to mention here, however I would like to individually dedicate this work to my
grandfather, Vernon Richey, who truly understood the value of evaluating risk and would
TABLE OF CONTENTS
Page
LIST OF FIGURES ... iv
LIST OF TABLES ... v
NOMENCLATURE AND DEFINTIONS ... vi
ACKNOWLEDGMENTS ... vii
ABSTRACT ………. ... viii
CHAPTER 1. INTRODUCTION ... 1
CHAPTER 2. BACKGROUND AND PRIOR WORK ... 9
2.1 Measuring and Modeling Risk ... 10
2.2 Managing Risk ... 21
2.3 Principles of Uncertainty ... 23
2.4 Supportive Frameworks, Theories, and Approaches ... 27
2.5 NIST Federal Guidelines ... 48
2.6 Preliminary Survey of Problems ... 51
CHAPTER 3. THE PROBLEM ... 58
3.1 Purpose and Goals ... 59
3.2 Hierarchies and Risk ... 60
3.3 Subjective Assessments of Risk ... 62
3.4 Post-Modernism ... 67
CHAPTER 4. PROPOSED SOLUTION: “RMF 2.0” ... 73
CHAPTER 5. IMPLEMENTATION AND CHALLENGES ... 100
5.1 General Evaluation ... 101
5.2 Challenges ... 107
5.3 Path Forward ... 111
5.4 Conclusion ... 120
BIBLIOGRAPHY ... 125
APPENDIX A. GLOSSARY ... 133
LIST OF FIGURES
Page
Figure 1. Ngram of “Risk” ... 3
Figure 2. Ngram of “Danger” ... 3
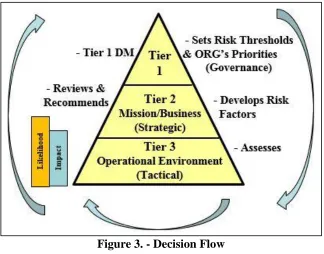
Figure 3. Framework Decision Flow ... 84
Figure 4. Risk Model ... 87
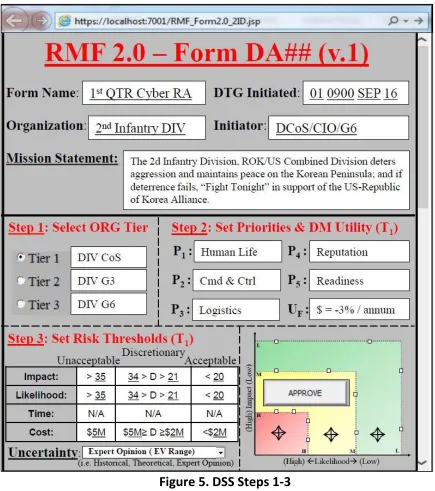
Figure 5. DSS Steps 1-3 ... 91
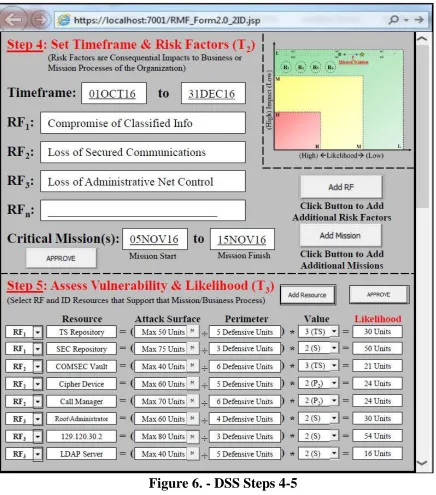
Figure 6. DSS Steps 4-5 ... 93
Figure 7. Attack Graph ... 94
Figure 8. Control Worksheet ... 94
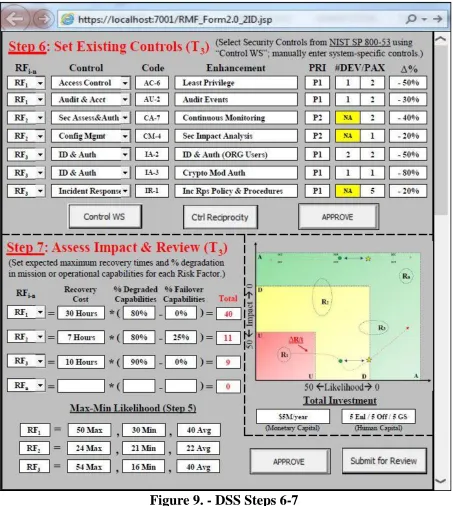
Figure 9. DSS Steps 6-7 ... 95
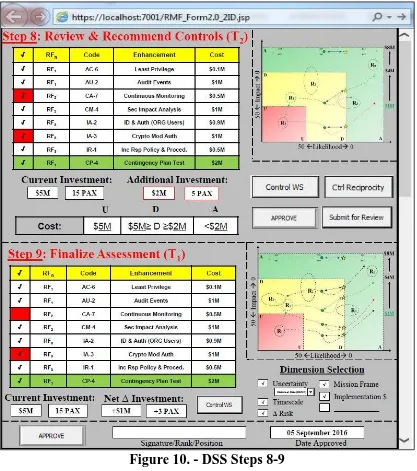
Figure 10. DSS Steps 8-9 ... 96
Figure 11. T2/1 Control Worksheet ... 97
Figure 12. NIST Risk Assessment Process ... 146
Figure 13. Annotated DSS Steps 1-3 ... 146
Figure 14. Annotated DSS Steps 4-5 ... 147
Figure 15. Annotated DSS Steps 6-7 ... 147
Figure 16. Annotated DSS Steps 8-9 ... 148
LIST OF TABLES
Page
Table 1. Gartner’s Governance Maturity Model (Risk Approach) ... 5
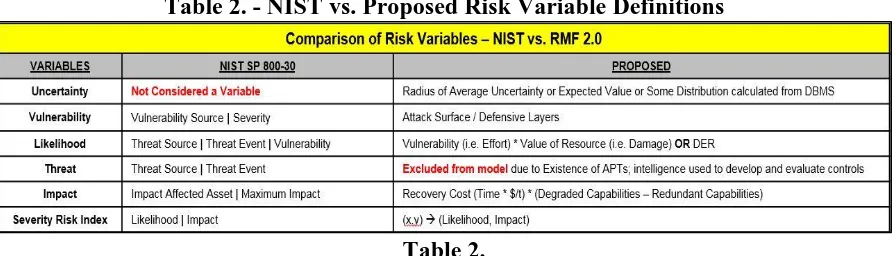
Table 2. NIST vs. Proposed Risk Variable Definitions ... 78
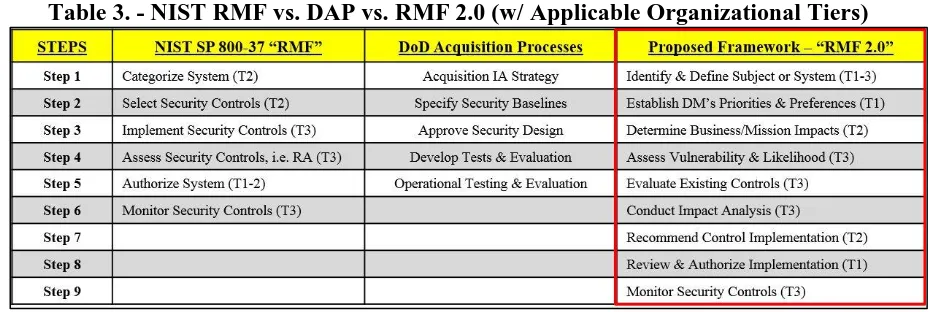
Table 3. NIST RMF vs. DAP vs. RMF 2.0 ... 86
Table 4. Characteristics of an Effective Risk Management Framework ... 101
NOMENCLATURE
APT Advanced Persistent Threat
DAP DoD Acquisitions Process
DER Damage-Effort Ratio
DoD Department of Defense
DoDI DoD Instruction
DSS Decision Support System
ENBIS Expected Net Benefit of Information Security
FISMA Federal Information Security Management Act
HHM Hierarchical Holographic Model
HRO Highly Reliable Organization
IBLT Instance-Based Learning Theory
IPCC Intergovernmental Panel on Climate Change
MCM Monte Carlo Method
MIL-STD Military Standard (Publication)
NIST National Institute of Standards and Technology
PAX Military Personnel
POA&M Plan of Action and Milestones
RDF Risk Determinate Factor
RFRM Risk Filtering, Ranking, and Management
RMF Risk Management Framework
ROI Return On Investment
ACKNOWLEDGMENTS
I would like to acknowledge my committee chair, Dr. James Davis, and my
committee members Dr. Doug Jacobson and Dr. James Cannon, for their guidance and
support throughout the course of this research. In addition, I would like to acknowledge my
colleagues, the faculty of the Information Assurance Center (IAC), and the staff for making
my journey at Iowa State University such a rewarding experience. If it weren’t for the IAC’s
administrative coordinator and director, Ginny Anderson and Dr. Jacobson, my journey here
might not have even been possible if it weren’t for their willingness to accommodate my
unique situation during the application process. I am also grateful for the counsel of Iowa
State University alumni Dr. David Carlson and MAJ Bryan Plass for recommending this
program when deciding which academic path to pursue. The graduate course that provided
the most benefit to this study was “Legal and Ethics in Information Assurance” taught by
ISU Lecturer Kenneth Peters, and I am thankful for all the effort he put into developing such
a broadening course. I would also like to thank recent ISU graduate Alec Poczatek for
sharing his extensive knowledge on attack graph theory, and how his research applied to my
project.
I would especially like offer my sincere gratitude to the U.S. Army for providing the
generous opportunity to further my education and making this investment in me. Within the
U.S. Army, I would like to individually thank LTC Matthew Hopper, MAJ (Ret) Russell
Fenton, MAJ Mitchell Hockenbury, MAJ Bradley Denisar, and LTC Jeremy Bartel for their
ABSTRACT
The quantification of risk has received a great deal of attention in recently published
literature, and there is an opportunity for the DoD to take advantage of what information is
currently available to fundamentally improve on current risk assessment and management
processes. The critical elements absent in the current process are the objective assessment of
likelihood as part of the whole risk scenario and a visual representation or acknowledgement
of uncertainty. A proposed framework would incorporate selected elements of multiple
theories and axiomatic approaches in order to: (1) simultaneously examine multiple
objectives of the organization, (2) limit bias and subjectivity during the assessment process
by converting subjective risk contributors into quantitative values using tools that measure
the attack surface and adversarial effort, (3) present likelihood and impact as real-time
objective variables that reflect the state of the organization and are grounded on sound
mathematical and scientific principles, (4) aggregate and function organization-wide
(strategic, operational, and tactical) with maximum transparency, (5) achieve greater
representation of the real scenario and strive to model future scenarios, (6) adapt to the
preferred granularity, dimensions, and discovery of the decision maker, and (7) improve the
decision maker’s ability to select the most optimal alternative by reducing the decision to
rational logic. The proposed solution is what I term "Risk Management Framework 2.0", and
the expected results of this modernized framework are reduced complexity, improved
optimization, and more effective management of risk within the organization. This study
introduces a Decision Support System (DSS) concept to aid implementation, maximize
transparency and cross-level communication, and keep members operating within the bounds
CHAPTER 1. INTRODUCTION
He who knows and knows he knows, He is wise - follow him;
He who knows not and knows he knows not, He is a child - teach him;
He who knows and knows not he knows, He is asleep - wake him;
He who knows not and knows not he knows not, He is a fool - shun him.
(Ancient Arabic Proverb)
There is a vital need for monumental change in how we communicate, assess, and
model risk within the federal government. U.S. Army Defensive Cyberspace Operations
Capability Developer and retired Army officer, Russell Fenton, endorses this argument by
stating - “the current risk framework, as developed by the National Institute of Standards and
Technology (NIST), is outdated and no longer effective in assessing true risk factoring
threats, vulnerabilities, and other variables in a way that decision-makers can confidently
understand the environment and envision how certain choices have the potential to impact
future operations.” [R. Fenton, personal communication, 2016] This study aims to interpret
the basic contributors of risk as quantifiable variables and present an alternative framework
as to how the federal government can more effectively govern their risk management
programs while improving upon the quality of risk considerations in the future. My proposed
solution is termed “Risk Management Framework: 2.0” to indicate that this proposal shares
many of the underpinnings of the current federal risk management framework, which
proposes a proscriptive, deterministic, and reflexive approach to managing risk in the
cyberspace domain using quantitative variables; a strategy for the post-modern world.
The evaluation of risk is, and will continue to be, essential to our survival as a
the near-masters of our environment that we are today. There are only assumptions as to
when our human ancestors first assessed risk, but conceivably this primitive assessment
attempted to compare the consequences of remaining in the trees versus the benefits of
climbing down to explore the surroundings for resources. Since this postulated moment,
human strategies for determining and assessing risks have evolved tremendously. Recorded
history indicates that our later ancestors relied on mystics, oracles, or religion for guidance
when confronted with a decision between multiple scenarios or options. Tools, such as bones
or dice, were even devised to assist decision-making when neither mysticism nor religion
could provide assistance. The word “probability” originates from the Latin word probabilis,
which means “worthy of approval”. “Worthiness” in Roman times was considered in the
outcome of a roll of dice or knucklebones. Probability was eventually understood in the 17th Century courts of Europe as a measure of proof in a legal case. The meaning further evolved
into “a measure of the weight of empirical evidence as to the chance a particular outcome”.
[32] Due to the statistical and inferential powers of probability, recent history has seen an
unprecedented growth and an insatiable determination to control our futures. This explosion
becomes evident simply by observing the increasing frequency of risk discussions across
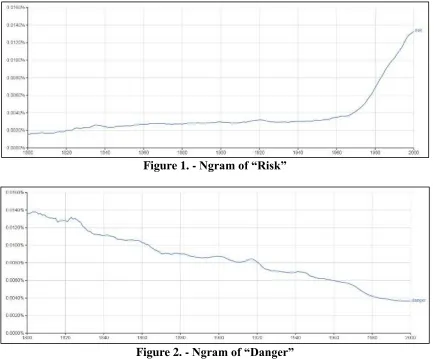
literature. A word search using Google’s Ngram Viewer [33] illustrates this upsurge by
querying the use of the word “risk” in literature versus use of “danger” from 1800-2000.
Meanwhile, the latter’s usage has seen a gradual decline over the 20th Century. (See Figures 1 and 2) Risk and danger were two entirely dissimilar words in earlier history, yet they have
become more synonymous with one another (even replacing) as we approached the
mid-twentieth century. The trending of “risk” in literature appears to correspond with rapid
assist us in modeling variables that impact the level or likelihood of danger imposed by a
hazard thus allowing us to compare alternative courses of action that might result in less
severe or more gainful outcomes. Powerful algorithms and increasing computing capabilities
have revealed abilities to perform a variety of analyses to make sense of the data, and
establish a diverse range of quantifiable metrics to help guide decision-making. As the
prospect of risk quantification became increasingly manifest, organizations have made huge
investments in unearthing any utility that could provide them with an advantage over their
[image:12.612.100.534.292.651.2]competitors or adversaries.
Figure 1. - Ngram of “Risk”
Figure 2. - Ngram of “Danger”
This quantification of risk has received a great deal of attention from academia over
take advantage of what information is currently available to fundamentally improve on
current risk assessment and management processes since the introduction of the traditional
risk matrix in MIL-STD 882 (1993). [34] A proposed framework, successive to the current
RMF, would synthesize selected elements of various theories and visualization techniques in
order to objectively assess likelihood and uncertainty variables, and to reduce the results of
the analysis to a point that decision-makers are able to make a decision chiefly based on
rational logic with the aid of a collaborative Decision Support System (DSS). There are
significant challenges to quantifying risk variables in utilities or values applicable to the
DoD, but this study suggests these challenges can be overcome with the introduction of a
fresh approach to assessing and modeling risk.
As stated in the opening and subsequent paragraphs, the current risk management
approach used by the DoD could greatly benefit from the lessons learned throughout this
study. The current approach creates opportunities for the assessor to inject significant bias
and subjectivity into the analysis, is loosely grounded on sound scientific or mathematical
principles, and fails to present the results to the decision-maker in a tailored form that enables
him or her to make the most qualified decision. (These issues will be discussed further and
solutions provided in Chapters 3 and 4.) These issues combine to significantly hinder our
ability to effectively manage risk. Less informed decision-making, stemming from unsound
analyses and misguided perceptions, has resulted in some of the most severe unintended
consequences in history costing countless lives due to miscalculations of risk by both society
and organizational entities. Scientific and organizational experts prefer that society view the
world as either random or probabilistic to assign accountability, but the world actually
slight changes in risk variables that could have dramatically different outcomes and chaotic
distributions as time progresses. A sound risk management program should minimize the
effect observation has on the likelihoods and consequences of assessing risk, and join
adaptive procedures and processes that help organizations march forward into a more stable
[image:14.612.112.521.210.308.2]and secure 21st Century.
Table 1. - Gartner’s Governance Maturity Model (Risk Approach) [35]
Level 1: Ad Hoc Level 2: Isolated Complacency Level 3: Risk Mitigation Level 4: Benefit Optimization Level 5: Competitive Advantage Ignore/Deny Risks Respond reactively to imminent risks only Proactively ID and manage cost,
compliance, and security risks
Accept and manage business
risks based on ROI
Take calculated approach to
financial management
Gartner developed a governance model that identifies deliverables at each
organizational maturity level across six different business domains, with “risk approach”
being one of them. [35] (See Table 1) An organization achieves level four (benefit
optimization) when it can “accept and manage business risks based on a Return on
Investment (ROI) model”, and has achieved level five (competitive advantage) when it can
“take calculated risks for a competitive advantage”. Most organizations strive to reach these
highest levels of maturity in their risk management programs, but unfortunately many
programs are inhibited at levels two and three due to subjective or rigid risk management
strategies. The envy of all organizations are those that have been identified as a High
Reliability Organization (i.e. HRO). What distinguishes HROs from other organizations is
that they have achieved nearly flawless operations while maintaining high risk and complex
systems. Experts have been unable to clearly determine how HROs achieve these results, but
they assume it is due to their ability to maintain “bureaucratic structures that are hierarchical
By making optimization a top priority for their risk management programs and mirroring the
characteristics of HROs, organizations can chart a course to achieving greater reliability,
robustness, and success in the future.
The Department of Defense opened an opportunity to improve upon or craft new
methodologies in their March 2014 instruction, DoDI 8510.01, by stating in Enclosure 6,
Step 4 (Assess Security Controls): [1]
“An assessment methodology consistent with [NIST 800-37] is provided as a model for use or adaptation. DoD Components will use this model, or justify the use of another risk assessment methodology within the Component, to include addressing understanding of the impact on reciprocity across all communities.”
This chapter is prefaced with an ancient Arabic proverb that categorizes the four types of
mindsets in an organization: the wise, the ignorant, those asleep, and the fools. Any proposed
framework should attempt to make the wise wiser, educate the ignorant, motivate others, and
force the organization to address any uncertainty in the data. This is a lofty goal and littered
with challenges, but there are champions in the cybersecurity discipline that address steps to
correcting our current mindsets. Cybersecurity expert, Chris Williams at Leidos Inc., has
proposed four “Next-Generation Cyberdefense Axioms” to revolutionize and perfect the
mindsets for professionals working to defend their organizations against cyber-related
threats: (1) assume an intelligent attacker will eventually defeat all defensive measures, (2)
design defenses to detect and delay attacks so defenders have time to respond, (3) layer
defenses to contain attacks and provide redundancy in protection, and (4) use an active
defense to catch and repel attacks after they start, but before they can succeed. [27] This
study will attempt to build upon these axioms as fundamental objectives in changing the way
risk is socially and individually perceived, constructed, and managed. Most contemporary
both social and organizational risk management programs. New York University Professor of
Sociology, David Garland, has been quoted as saying, “Risk society is our late modern world
spinning out of control”, and followed up by asking the question: “Would we do better to
slow progress and evaluate ourselves?” [14, p. 6] Few would argue that the rise of
neoliberalism, or laissez-faire economic liberalism, has not served as part of the driving force
behind this trend as opportunities are seized by those who have mastered the art and science
of risk taking. Unfortunately like matter risk cannot be eliminated, but only redistributed.
This was the case in the U.S. Financial Collapse of 2008 where opportunists were making
irresponsible and risky financial decisions, and the consequences of these decisions were
ultimately absorbed by the American taxpayer. There is a ubiquitous social realization of
these immoral activities thus causing an erosion of trust and faith in many foundations.
Perhaps taking a fundamentally different approach could help restore this faith?
This study begins in Chapter 2 by summarizing previous work performed in this
discipline including the fundamentals of measuring risk, alternative approaches to the
quantification of risk, various theories that support this study, and NIST guidelines within the
current Risk Management Framework (RMF). The immediately following chapter attempts
to describe the problem by examining the shortfalls of contemporary organizational risk
management programs, keying in on the shortfalls of subjective analyses, and illuminating
the need for monumental change in preparation for the era succeeding Modernism. The final
two chapters will provide a solution to the current RMF, conceptualized in the form of a
Decision Support System, and then articulate a logical and coherent course for
implementation. It is worth supposing that there may be superior strategies to addressing the
mission assurance” to realize the ultimate objectives of any organization. [R. Fenton,
CHAPTER 2. BACKGROUND and PRIOR WORK
“All models are wrong, but some are useful.” ~ George Box, 1987
Organizations that have been able to perfect the art and science of risk management
ultimately become masters within their domains. Oxford mathematician Marcus De Saytoy,
said that “predicting the future is the ultimate power.” [28] This concept can be illustrated
through one of the stories told of Christopher Columbus when he landed on the shores of the
Americas in 1504, and needed provisions for his men. He communicated to the natives that if
they did not supply his men these provisions their god would become angry and remove the
Moon. What Columbus had, and the natives did not, was knowledge of the lunar cycle. As
Columbus predicted, those present witnessed a lunar eclipse and the natives had no other
explanation than to trust that their god was in fact mad at them for not coming to his aid. [36]
This single example demonstrates the asymmetrical advantage that can exist between
opponents due to one actor’s ignorance, the influence uncertainty can have on the selected
actions, and how empirical observations can be used to model the future.
The primary objectives of this study are to (1) develop a framework that better meets
the needs and functions for managing risks in the cyber domain, (2) demonstrate that
objectivity increases decision-power and program reliability in the evaluation of risk, and (3)
identify practical means of quantifying uncertainty. These objectives will be achieved by
understanding the fundamentals of risk management, examining multiple theories and
approaches that help organizations determine the root causes of risk, and evaluating the
current framework as compared to the proposed framework. Before the problems this thesis
attempts to address can be fully described, certain concepts must be understood first. This
organizations use this information to manage risk within them. It then progresses into what
roles uncertainty plays in risk management, and how experts have attempted to reduce its
impact on informed decision making. The chapter also reviews several alternative methods
that could have application within the proposed framework. After these methods have been
discussed, we will describe various social theories, risk management approaches, and
abstraction techniques that led to the development of a framework most suited to addressing
the many systemic problems highlighted throughout this study. The chapter will conclude by
reviewing the history of the NIST organization and their guidelines for assessing and
managing risk within their recommended framework, then provides a preliminary survey of
the problems that will be examined in the following chapter.
2.1 Measuring and Modeling Risk
Risk assessments generally attempt to answer three fundamental questions: (1) What
can go wrong? (2) What is the likelihood that it would go wrong? (3) What are the
consequences? [9] These questions are answered by identifying and prioritizing risk factors,
assigning values to those variables that contribute to the likelihood of an event occurring, and
determining how those events impact mission or business operations. This study feels that all
three questions can be mathematically answered, and then judged through subjective means.
Mathematically answering these questions is critical because the results can be validated in
most cases. Though this effort is especially challenging to those responsible for producing
these answers, their efforts can be alleviated by first understanding what is exactly at risk and
how that information translates to organizational risk. This investigation leads the
organization to developing its own understanding of risk, and how it can most appropriately
2.1.1 Risk.
One of the most significant challenges in any risk management program lies in the
measurement of risk variables, and combining those variables in such a way that risk
potential can be coherently modeled. Risk experts have similar definitions of risk with minor
differences, but the term can be broadly defined as the measured certainty of an outcome due
to an event or activity where these outcomes result as sequences of cause and effect. The
recognition of “causes” and their “effects” is critical because identifying those relationships
enables organizations to truly engage risk in manners aligned with this thesis. Organizations
use risk measurements to help guide decisions and develop courses of action that minimize
exposures or maximize opportunities. There are various factors that contribute to an
organization’s risk, and these factors can be prioritized by first and second order factors. [6]
First order factors are those that dominate all others, and serve as the primary driving force in
decision-making. Examples include: funding, personnel, or maturity. All second-order
factors are those intrinsic and extrinsic attributes that are derived from the dominating
factors, such as quality (derived from funding), intellectual capital (derived from personnel),
or lifecycle (derived from maturity). The list of risk factors can be infinite, but it is critical to
have a filtering mechanism that differentiates between first-order and second-order factors.
Identifying risk factors also depends on the granularity and scope of the decision. Due to the
broad range of risk factors and the challenge of prioritizing them, this study suggests that risk
factors should focus more on addressing the consequential impacts of a threat rather than the
results of the threat. For example, an organization should address the risk of degraded
communications vs. a Denial of Service (DoS) event because that second-order risk factor
risk” to the organization. This objective of identifying true risk factors can be achieved by
studying the relationships that exist among risk variables.
In studying the relationships between risk and its impact to the mission of the
organization, a synergistic understanding of the system and corresponding sources of risk
and/or uncertainty are gained. [9] The central relationship in cyberspace is between the
defender and the adversary, and that relationship is most evident in the outcomes (rewards or
losses) of an event or activity. These relationships shouldn’t be mapped one-to-one, but
rather one-to-many. This is a difficult task, and should mainly focus on objective
relationships rather than subjective relationships. Even objective relationships can be
imperfect, but they can still be statistically significant in the form of probabilities. [10]
Probabilities are heavily dependent on the relational perceptions between the subject and
object [11], and even known probabilities represent a distinct relationship between the
assessor and the event [23]. Establishing relationships between human activities and
consequences is a complex challenge [15], but this challenge can be reduced by driving down
to the primary roots of those relationships. Regardless of what relationships are revealed,
describing the concept of risk to an audience is articulating the relationship between realities
and individual perceptions. [16]
Total risk avoidance is impossible to achieve, therefore it is necessary to measure the
amount of risk exposure in order to allocate resources to reducing this exposure to a
cost-effective level. One recommendation is given by Jack V. Micheals, Ph.D where he gives the
following rule of thumb: “invest one dollar in risk avoidance for every four dollars of risk
exposure”. [6, p. 1] Even though this general rule has some utility, the challenge still remains
manage perceptions of decision-makers so that investment dollars are optimally spent. The
first step in overcoming this challenge is to develop the most accurate estimation of risk, and
then model the data in such a way that best communicates the amount of exposure.
2.1.2 Quantifying Risk.
There are primarily two approaches to describing risk, and they are through
qualitative or quantitative analysis. [11] Qualitative analysis is subjective by nature and uses
a person’s expert opinion to estimate the amounts of risk, while quantitative analysis is based
on objective measurements gathered through empirical or previous observations. Qualitative
inputs are generated by enlisting the expertise of various professionals to assign a qualitative
category to a relationship between variables that expresses their highly regarded and trusted
opinions. On the other hand, there are a variety of ways to generate quantitative inputs. For
example, an assessor could extract statistical relevance from historical records, measure
various features of a system or organization through observational means, or assign weights
to variables that directly link to an individual’s utilities. In either approach, both suppose that
overall risk equals the likelihood of an adverse event joined by the magnitude of impact
resulting from that event. As a general rule, all variables should be assessed holistically to
describe the totality of a scenario that a system or organization faces in the event of an
outcome.
Author Yukov Haimes maintains the notion that measuring risk is an empirical,
quantitative, and scientific activity while determining the acceptability of risk is a qualitative
and political activity [9]. Risk analysis is considered scientific in that scientific principles are
applied when determining the likelihood of an event and its severity of harm. These
seeking answers, experimenting and testing, and forming and modifying hypotheses. A
discovery process that solely relies on qualitative inputs cannot adhere to these
well-established principles. On the contrary, any methodology that lacks a combination of
quantitative inputs and qualitative determinations is thereby insufficient, and could
potentially increase organizational risk-exposure if either of these elements aren’t utilized
appropriately or completely omitted.
As identified by NIST in [3], both approaches present their own set of challenges.
The major challenge presented by qualitative analysis is in the opinions and experiences of
the assessor, and how that individual chooses to present the results of the analysis. Two
challenges presented by quantitative analysis are in the occasional difficulty interpreting
results and the potential for substantial uncertainty in the values. [3] Yukov Haimes adds an
additional challenge to quantitative assessments in that all sources of risk against a system
must be evaluated. [9] The list of sources could be endless, but this statement by Haimes
could be interpreted as a holistic collection of all relevant information using the chosen data
collection technique. Haimes suggests in [9] that these challenges can be reduced through
improved data and analytical techniques with the intent of minimizing measurement errors or
uncertainty. Fortunately there are tools and techniques in development that will be able to
effectively collect all the information for a data set in the near future. One technique with
potential to effectively describe a system’s vulnerability is through the use of a computer
algorithm to measure the attack surface of a particular system. [8] Once all the selected
variables have been measured using comparable techniques, then the assessor can aggregate
Risk correlates to organizational costs in a variety of ways. Those costs can be
determined as factors of money, time, reputation, or other organizational resources.
Organizational resources can be thought of as a collection of personnel, equipment, funds,
and/or information technology within an organization. [2] The existing relationships between
costs and resources supports the idea that it must be theoretically possible to quantify risk
because costs can be quantified, and the goal of reducing costs to the organization by
avoiding negative impacts is the primary driving force behind performing risk assessments.
Any risk model under development must function by starting from a threshold of
unacceptable cost(s) to the organization, because organizational risk effectively equates to a
measure of potentially detrimental cost(s) to the organization and determines how each
variable contributes to the potential gains or losses of a risk management decision. [5]
Furthermore, using the word “cost” synonymously with “risk” aids the discussion and helps
frame the problem in a context that is more universally understood.
2.1.3 Risk Variable Selection.
The essence of assessing risk is to reduce risk exposure to a cost-effective level [6],
therefore it is critical that discretion is taken in selecting those variables that will perform to
the maximum expectations of the decision-maker. The selection of risk variables depends on
the structure of the optimization problem, and the mathematical properties of the decision
primarily determines which variables will fit in the model. The sources of variable
information are from historical data, theoretical considerations, and expert analysis. [21] The
two variables fundamental to all risk assessments are likelihood and impact, and there are
supporting variables to enable the assessor to estimate these fundamental values such as time,
resource’s functional worth. Deciding which variables support the optimization problem and
mathematical properties of the decision ultimately depends on the variables’ potential for
abstraction into some sort of business intelligence that can be used by the decision-making
hierarchy. [9]
The primary variables evaluated throughout this study are those that demonstrate the
greatest support in evaluating risks in the cyberspace domain, and they are: vulnerability,
likelihood, impact, and uncertainty. Vulnerability has the greatest influence on how an
organization should invest its resources [5], and represents an organization’s exposure/
sensitivity to danger or some measure of resilience. [14] Crime analysis shows that victims
aren’t targeted by random; they are targeted based up their perceived vulnerability. [28] This
adversarial perception can be shaped by many factors, and will change over time. Russell
Fenton agrees that vulnerability assessments should include elements of time and some
quantifiable value. [R. Fenton, personal communication, 2016] These quantifiable values can
be derived from measuring the attack surface, compiling an adversary benefit structure for
completing some objective, and showing how these two variables morph over time. The
cybersecurity strategy known as “Moving Target Defense” (MTD) employs a technique
called Damage-Effort Ratio (DER)that functions in a similar way. [8] (Both MTD and DER
will be described in further detail later in the chapter.)
Likelihood in this study represents a measure of susceptibility that combines the
assessed vulnerability of a targeted system and the adversary’s reward of attacking the target,
and is disassociated from its common representation as probabilities. Probability should
instead represent a degree of certainty in the data since likelihood has been applied as a state
in a traditional sense, there are significant problems with assigning probabilities; for
example, how decision-makers interpret numerical or subjective probabilities. It was Italian
statistician Bruno de Finetti who said that “probability does not exist” because probabilities
primarily depend on the relationship between the object and subject, and they are all based on
unprovable assumptions. [11, p. 20] The proposed framework applies Determinism as a
fundamental concept, and a model cannot be deterministic and probabilistic at the same time,
therefore probability must not be considered objectively or represent likelihood within this
framework.
Impact is the second fundamental variable used to model risk, and this study defines
this variable as a measure of the effect an outcome can have on business or mission processes
because truly “knowing the impact enhances Impact Analysis” as stated by Haimes. [9, p.
346] Impact isn’t one single measurement, but a combination of one-to-many relationships
between threats and impacts [6] that represent the state of the organization following an
event. There are far more hazards than there are impacts, and an assessor will never have
reasonable time to develop a comprehensive list of all known hazards. Therefore it is optimal
to represent impact as a consequential cost against the organization if outcomes (A) or (B)
were to occur. Michaels suggests two formulas that can achieve this goal, Risk Time Estimate
(RTE) and Risk Cost Estimates (RCE). [6] (These calculations will be explained in Section
2.4.1.) RCE/RTE (or impact) combined with a measure of the organization’s susceptibility
(i.e. likelihood) provides the most functional and dynamic representation of the true
insecurities organizations face.
Uncertainty is a critical variable that is often underrepresented in today’s models, and
uncertainty in this framework, but there are significant challenges within determining
probabilities as previously mentioned. Due to the variabilities that exist in any measure of
certainty, this study hopes to achieve separation between the likelihood and uncertainty
variables by presenting both as independent contributors to the risk model. There are a
variety of ways to model uncertainty in the context of this study, such as: Uncertainty
Sensitivity Indexes [9], Bayesian Statistics, Confidence Intervals, Expected Values,
Insufficient Reason, or Poisson Distributions. [10] The list of possible representations is
extensive, and any universally accepted model should provide the option of selecting
different methods that are optimally suited to the mathematical properties of the decision
problem. Before proceeding, it is important to note the difference between uncertainty and
deep uncertainties. Deep uncertainties are those risk components that will never be able to be
described scientifically [22], and all remaining uncertainties are those variables that have
measurable limits to their precisions. Deep uncertainties are isolated earlier in the proposed
framework through the Info-Gap Procedure, and all remaining uncertainties are quantified by
establishing statistical relevance in the data through the variety of means mentioned above.
2.1.4 Modeling and Techniques.
Modeling risk is crucial in making sense of the data [16], and attempts to uncover the
logical relationship between hypothesis and evidence (or data distributions) by isolating a
causal agent from intervening variables. [21] Modeling also enables us to look into the past
and predict the future as shown in the Christopher Columbus example. [28] The process for
developing a model is fairly standard, and begins with determining the specific needs for
modeling a scenario. Once the need has been firmly established, the problem is formulated
agreed upon, subordinate tiers within the organization begin model construction by collecting
and analyzing data pertinent to the problem. Following model construction, the model is
validated and run, and the findings are analyzed to determine if further refinements are
required or if the findings will be implemented. [6] There are a variety of modeling
techniques and practices to build upon in order to develop a model that fits each decision
problem. Jack V. Michaels provides three broad categories of models in [6]: network,
decision, and cost/risk analysis models. Additionally, there are several ways to model the
presentation of the data: iconic, symbolic, and analog representations. This study is primarily
interested in combining one of three previously mentioned model categories and
representations using one of the following mathematical models for risk simulations as
categorized by Yacov Y. Haimes in [9] as either: linear, non-linear, deterministic,
probabilistic, static, dynamic, distributed, or lumped. This study concludes that the ideal
model combination for assessing and communicating risk within cyberspace is a cost/risk
analysis model with analog representations that supports non-linear, deterministic, and
dynamic mathematical techniques for variable formulation. This study suggests analog
representations are best suited for the proposed model since they allow greater
reproducibility and all risk decisions with the DoD are associated with some sort of
organizational cost metric. Non-linear simulation techniques show the greatest potential for
the proposed model due to an object’s random behavior patterns. The model should be
deterministic to illuminate relationships, and dynamic because optimal control selection is
dependent upon changes within the environment. Once the optimal solution is discovered,
sensitivity, responsivity, and irreversibility to provide further benefits and/or enhancement.
[9]
2.1.5 Observation and Modeling Risk.
Accurately modeling risk is extremely challenging because risk is conditional upon
the behaviors, actions, and perceptions of subjects and objects within the environment. [10]
Additionally, risk is constantly in motion as it moves in response from attempts to take
measurements as relative to the Heisenberg Uncertainty Principle. [11] Accuracy of a model
is dependent on how closely it represents the system [9], and simply observing objects within
cyberspace can have an indirect impact on their behaviors and actions. This effect is referred
to as the Hawthorne Effect [10] or the Beijing Butterfly Effect [11]. Deploying an intrusion
detection system (IDS) is an example of these effects in a situation where the IDS becomes
detectable by an intelligent adversary. Any discovery by either the defender or the adversary
of the other’s presence could drastically alter their tactics as the Exchange Principle applies
to both offensive and defensive actors. Additionally, closely monitoring the state of the
organization can affect the decisions process. The Markov Decision Process is one such
framework that implies a subject’s observation can affect his or her decisions when an agent
(or subject) makes assumptions on the next state based on the observed state of things, and
ultimately receives a reward for selecting that action. In most cases, the reward is a
deterministic function of both the observed state of the organization and the outcomes
associated with certain actions. [19] The Expected Utility Function also shows that
observation has an impact on our decision processes through the formula: EU (a|o) = Σ P
(si|a,o) U (si). The formula states that a decision-maker’s expected utility (EU) for a
of the world as observed (o) while taking action (a), and our preferences over the space of
outcomes are represented by U (si). [19] This accepted formula demonstrates that our
personal utilities are encoded by our observation of the state of things over time. One simple
example that illustrates this concept is the future value of money over time based on previous
observations of rising inflation. All of the negative effects of observation can be limited by
interpreting likelihood as an organizational state of security versus a probability, focusing on
objective measurements of risk variables, and removing threat assessments from the risk
model.
2.2 Managing Risk
Risk Management is an “executive function of controlling hazards and consequences
that organizations encounter” [6, p. 1], and is continuous over the lifecycle of the project [9].
Organizations perform this function through the careful selection of management techniques,
strategies, and standard practices or policies. Challenges organizations often face in their risk
management programs are managing blame, controlling expectations, and influencing
behaviors as risks morph over time. Due to these requirements and challenges, solid risk
management programs must start with the full commitment of the organization’s top
management. Where top management often fail is when they focus on managing people
versus managing the system. [6] In addition to appropriately managing the system,
decision-makers must understand the value of the risk assessment, be made aware of the effects of
their decisions, ensure availability and credibility of the analysis, and take into account any
biases that exist in their organizations. [9] Author and academic, Clayton Christensen, said
that “solving challenges in life requires a deep understanding of what causes what to happen”
apply the best theories to implement a framework that provides maximum insight to the
decision problem.
Risk frameworks should manage from the top, and assess from the bottom. [6] The
technical side of risk management should answer the “who, when, how”, while the business
side should focus on addressing the “who and where”. [6] Risk frameworks must be capable
of aggregating and dividing processes because risks in each subsystem within the
organization ultimately determines the risk of the overall system being assessed. [9] The
program (or framework) must also engage the entire organization and ensure maximum
transparency for maximum success. [6, 9] This objective is made possible by allowing every
member an opportunity to make a contribution to the decision process which gives them the
sense of inclusion in their organization, and also allows members to increase their
competence through the individual process of making their own judgments. [10] The authors
of [7] suggest that the “People” domain is most vital among the STOPE (Strategy,
Technology, Organization, People, and Environment) domains, and the needs of the
decision-maker are the most important of all people in the organization; of most interest to
the decision-maker is how the decision variables link to his or her utilities.
A goal for risk management is reducing the decision to logic, and selecting the
alternative with the highest utility. [15] An understanding of the decision-maker’s utilities
enables the organization to effectively quantify potential gains and losses [10], however both
still remain subject to interpretation. For this reason, the decision must be defined in the
decision-maker’s terms as appropriate [15]. The challenges with leveraging utilities in risk
management are due to mobility, inherent subjective properties, and the uniqueness of
gamble decreases as the odds increase. Another example is reduced satisfaction experienced
from a second glass of water versus the first glass. Both of these examples illustrate the Law
of Diminishing Marginal Utility [15], but utilities can also increase as well. There are
basically two groups of utilities, and those are decision and experience utility. Decision
Utility is a computation about the expected future utility that is predicted, while Experienced
Utility is a utility chosen when an outcome has been previously experienced. [11] In the
absence of probabilities (which is what this study hopes to limit), the Subjective Expected
Utility Function may be used as developed by L. J. Savage. [15] Assuming the
decision-maker adheres to axioms of rationality, this function combines a personal utility function
with a personal and unique expected probability distribution.
Risk management boils down to people and processes, and how they all support the
mission of the organization. Decision-making is often a collective process that involves a
diverse body of people, but the decision still rests with the top decision-maker at the
conclusion of a risk assessment. For that reason, the problem must be described in such a
way that an application of utility-based logic is capable of comparing alternatives and
selecting courses of action that are optimally suited to the aims of the decision-maker.
Unfortunately there will always be some knowledge gaps throughout the decision process,
but gaining an enhanced understanding of uncertainty and fully acknowledging its existence
enables organizations to overcome many of the posed limitations stemming from these gaps.
2.3 Principles of Uncertainty
Perhaps the greatest challenge to risk management is in managing the expectations
and perceptions that fill voids created by uncertainty. Yukov Haimes says that “uncertainty
increases with less knowledge on a system. [9, p. 27] Because of this significance,
uncertainty lies at the heart of risk management. Haimes defines uncertainty as “the inability
to determine the true state of a system where no reasonable probabilities can be assigned to
outcomes” [9, p. 227], while risk expert Sir David Spielgelhalter simply equates risk with
uncertainty. [11] In the context of this study, uncertainty occurs when variables cannot be
described with concrete objectivity or fluctuations in the variables must be explained through
statistical inferences. [9] Unfortunately for all organizations, uncertainty is inherent in the
evaluation of risk and must be managed appropriately. [3] In addition to top-level
commitment, an expression of uncertainty is one of risk management absolutes and best
expressed quantitatively when optimal. [6] Despite the limitations, uncertainty can also
create an advantage for the cyber-defenders as described by the Moving Target Defense
strategy whereby implementing dynamic environments result in systems less vulnerable to
attacks. [8] Before one can harness the potential benefits of uncertainty, a deeper and
fundamental understanding is required.
2.3.1 Understanding Uncertainty.
The Uncertainty Principle states that there are limits to precision, therefore
uncertainty will always exist. [14] Applying this principle is fundamental in risk management
because risk models can create the illusion that probabilities are highly reliable
measurements. Probabilities can be deceptive when accepted as fact, but there are
alternatives to quantifying certainty in the absence of probabilities. Uncertainty is introduced
from a variety of sources, and John Adams has identified four primary sources in [10]:
variability in susceptibility, latency periods, the compounded effect of combination of
uncertainties” of which the organization should be made aware. These deeper uncertainties
are those that science may never be able to solve, and Spiegelhalter proposes that quantitative
and qualitative measurements must be brought together. This synthesis of objective and
subjective measurements would acknowledge the limitations of math and engage the social
sciences to critique. [22] Frank Knight proposes that the use of the word “uncertainty” be
restricted to variables of non-quantitative types only. [22] Regardless of how organizations
decide to tackle uncertainty, they must allocate resources to reducing uncertainty to the
maximum extent possible.
2.3.2 Managing Uncertainty.
Yacov Haimes prefaced his discussion on uncertainty in [9] by quoting Alvin Toffler:
“it is better to have a general and an incomplete map, subject to revision and correction, than
to have no map at all.” [p. 4] Fortunately improved data and analytical techniques can help
manage uncertainty, and modeling intricate details among subsystems improves the process
of quantifying uncertainty. [9] In addition to the various quantification methods mentioned in
Section 2.1, a risk model could apply the Principle of Insufficient Reason as a means to
represent probabilities in a deterministic model within an independent dimension. This
principle was developed by early mathematicians Jacob Bernoulli and Pierre Simon Laplace,
and works under the assumption that no probabilities are known. To overcome this gap, each
event is simply assigned a probability equal to 1 divided by the number of possible outcomes
for that single event. [17] There are additional substitutions to probability such as an analysis
of the: reliability, maintainability, sensitivity, responsivity, stability, or irreversibility of a
system. Uncertainty can also be displaced by decomposing a complex system into smaller
understanding of the system and corresponding sources of risk or uncertainty. [9] If top
management insists on including probabilities, Bayes’ Theorem is one option with potential
application within the proposed framework’s risk model by basing the probability of an event
as it relates to certain conditions. The formula is a conditional probability that Event A
occurs given that Condition B is true, which equals the probability of A multiplied by the
probability of observing B given that A is true and divided by the probability of B; {P(A|B) =
P(A) P(B|A) / P(B)}. As an example, suppose the probability of an email server failing (A)
due to a virus introduction (B) equals the probability of an email server failing at some point
(50%) multiplied by the probability that a virus could cause an email server to fail (20%).
This number is then divided by the probability of a virus introduction to the system (30%)
which would result in a 33% probability of the scenario occurring. Confidence Intervals and
Poisson’s Distribution are additional alternatives to measuring uncertainty in objective data,
and definitions of each are provided in Appendix A.
Despite the challenges compounded by including uncertainty within the model, this
infusion actually improves the effectiveness of the model. Ultimately, the best way to reduce
uncertainty is by ensuring the model representing risk is as accurate to the real situation as
possible. In addition to finding a way of representing or displacing uncertainty, managing
this challenge also entails managing the expectations, perceptions, and fear of blame within
the organization. Carlo C. Jaeger expressed doubts in [15] that one particular structure can
manage these issues as organizations grapple with uncertainty and attempt to model
uncertainty as variants of optimization procedures. Regardless, we have no choice but to do
2.4 Supportive Frameworks, Theories, and Approaches
There are a variety of proposed frameworks, and any implementation helps
organizations guide the risk management process and keep individuals on task. A good
framework enables decision-makers to frame the problem to be analyzed, engages the entire
organization in the process, and produces results that enable decision-makers to develop the
best strategy for tackling the problem. Michaels says in [6] that is impossible to entirely
evaluate risk deterministically, but that programs should put determinism to its limits.
Determinism is a field of study that associates causes with effects, and suggests that every
single outcome can be traced by analyzing sequences of events. This study focuses on
assessing risk as a deterministic problem, and the following frameworks (or methodologies)
have provided various degrees of influence on this study’s resulting framework.
2.4.1 Supportive Frameworks and Methodologies.
A framework is not necessarily a formula or a model style, but a unified attack vector
that represents the mindset of members that apply and operate within the framework. The
following frameworks and methodologies have contributed to the development of a “unified
attack vector” most suitable to managing risk in the cyberspace domain: Pre-Mortem
Analysis, Technical Risk Management framework, the Gordon-Loeb Model, the
Monte-Carlo Method, Risk Filtering Ranking and Management framework, and methodologies
behind the Moving Target Defense strategy.
Pre-Mortem Analysis is one such methodology that is forward looking and seeks to
identify vulnerabilities in a plan by imagining a project has failed before it starts. This
process begins by gathering the team that will participate in the analysis. The team then
members individually generate reasons for failure and consolidate their lists. Simulations are
then run, and the team revisits the original plan for optimization. Subsequent reviews are
conducted to re-sensitize team members to emerging problems. [29]
Jack V. Michaels recommends a framework in [6] that he calls “Technical Risk
Management”, which begins by generating lists of impacts associated with all
subcomponents of a complex system. Those impacts with the greatest magnitude are then
selected for analysis. Then a team analyzes those impacts to determine all the possible events
or activities that could lead to the outcome. Once these possibilities are generated, then a
likelihood variable is assigned to each one and prescribed a corrective action. The next step
involves calculating the Risk Time and Cost Estimates for each outcome. The Risk Time and
Cost Estimates are derived by adding the baseline estimates with a combination of
corrective-action time/cost and the appropriate risk determinate factors. Baselines are
estimates of time or cost to complete a task in the absence of hazards, and Risk Determinate
Factors (RDF) which are quantified measures to serve as estimates of risk exposure. RDFs
are computed by dividing previous risk cost/time estimates by the actual costs/times, and is a
percentage between zero and one if costs or times were underestimated. These estimates are
then rank-ordered and the team decides what controls could prevent these outcome from
occurring or which could reduce the outcomes. The last step involves packaging the analysis
in a form that presents the advantages of selecting one course of action over another to upper
management. [6]
The Gordon-Loeb Model tries to determine the optimal amount to invest to protect a
given set of information. Three parameters characterize the information set (S), and they are:
vulnerability which represents the likelihood of an undesirable event successful causing a
negative impact. Both (t) and (v) are both integers representing a probability residing
between 0 and 1. The monetary investment in security needed to protect the resource is
denoted by (z). There are three assumptions with this model: (1) any information set that is
completely invulnerable requires zero investment, (2) zero investment in security makes the
information set inherently vulnerable to an event or activity, and (3) increasing investments
in security increases security at a decreasing rate. The Expected Net Benefits in Information
Security (ENBIS) equals [vulnerability - Information Set (investment, vulnerability)] * Loss -
Investment, or {ENBIS (z) = [v - S(z, v)] L - z}. Gordon and Loab suggests that
organizations should invest in security only up until the point that marginal benefits equal
marginal costs, and that most risk-neutral organizations will need to invest approximately
37% of the expected loss of a breach into their information security programs. [5]
The Monte Carlo Method (MCM) is one methodology that proves useful when all
others are impossible to use. The basic idea behind MCM is to encode random numbers with
some sort of principle governing probability distribution. The process begins by tabulating
variates of interest, and could be a set of metrics used to describe one domain within the
problem; for example, sever off-line = time or frequency for individual previous events. Then
the assessor derives some score to cumulate distribution based on each metric within the
domain. Then a deterministic computation is performed on each cumulative distribution
ranging from the last metric input through the next. For example, suppose a server went
off-line on two occasions, 60s and 80s respectively, which would compute a range for the second
metric as 60 - 79. The next step requires the assessor to generate pseudorandom numbers into
with an actual measurement from the list of variates. An example would be an association of
the event with a down time of 80s with a randomly generated number of 77. Finally the
assessor would use the list of random numbers to perform statistical analysis on the complete
list of associated random numbers, with mean and standard deviation being the most popular.
[6]
Another framework is Yukov Haimes’ Risk Filtering, Ranking, and Management
(RFRM), which was developed for NASA with application towards the Space Shuttle
program in the 1990s. RFRM is more philosophical than mechanical, forces a decision
problem to focus on the actual contributors to risk, and comprises eight broad phases. In
Phase I, a Hierarchical Holographic Model (HHM) is developed that organizes and presents
a complete set of system risk categories or requirements for success. Increasing the levels
within this structure improves the level of detail for analysis. Phase II filters risk scenarios or
requirements according to the preferences of the decision-maker, and achieved through the
experiences and knowledge of that collective or individual. Phase III uses a traditional risk
matrix that compares likelihood and impact to provide a severity index for sub-scenarios to
the primary scenarios developed through the HHM. Phase IV reflects on the ability of each
scenario developed in Phase III to defeat any one of the three defensive properties of a
system, which are: resilience, robustness, and redundancy. Those scenarios that are
determined as able to defeat the system are then further evaluated against established criteria
that relate to those abilities. For example, a virus could impact the robustness of a system and
have the following characteristics: undetectable, cascading effects, or a high persistence. This
scenario would be one of the sub-scenarios falling under the degraded operations risk
likelihood of each scenario based on available evidence, and is especially useful in modeling
when there are many sources of uncertainty. Phase V ends by filtering out those scenarios
that linger above established thresholds. Phase VI is the risk management phase where
assessors ask the questions “what can be done” and “what options are available” to defeat
these filtered scenarios. Cost is a major factor in this phase and guides much of the
decision-making, and trade-off analysis is conducted to evaluate the various options. This phase is
also where selections are made on which options provide the maximum benefits. Phase VII
determines the actual benefits of the options selected in Phase VI, and looks to determine if
there are any relationships or interdependencies between scenarios discarded during the
filtering process or whether policy options will be effective. The final phase is Phase VIII
where operational feedback is collected following deployment of the options. The
information collected during this phase will help guide decision-making in the future. [9]
The final supportive methodology this study mentions in detail is computation of the
Damage-Effort Ratio (DER) to determine the likelihood of a cyber-attack, and was suggested
as part of a Moving Target Defense (MTD) strategy which was funded by the Army
Research Office and developed in 2012. [8] The entire strategy covered under MTD is
beyond the scope of this study, and this review will limit itself to the DER component of
MTD which strives to quantify likelihoods as weights represented by a system’s DER. DER
is a combination of the damage an adversary could inflict on a system (or reward) and the
amount of effort that would be required by the adversary in order to be successful. The
simplified theory behind this approach is that the likelihood of an attack against a system is
relative to the system’s vulnerabilities and the reward gained by the adversary, and is
limited to non-natural adversaries as there are no reward elements in natural catastrophes.
This assessment begins by measuring the number of entry/exit points (M), channels used to
connect to a system (C), and untrusted data resources (I) comprising a particular system.
This combined measurement provides a weighted amount of effort an adversary must expend
in order to break the system, and helps compute the attack surface. Then each resource is
assigned attributes ranging from method privilege (m), to access rights (a), or to channel
protocols (c). Each of these attributes represent a numerical value such that one parameter
within the set of access rights (a) is greater than another and benefits the adversary; for
example, root > non-root. This list is non-exhaustive and selects those attributes that have
priority sitting with management, but these are primarily the attributes used. By evaluating
these attributes against the previous measurements, the total attack surface is a combination
of the total contributions of methods (M), channels (C), and data resources (I) within the
system’s environment. In respect to the computing environment (Es), a system’s (s) attack
surface is a set of the sets of methods, channels, and untrusted data resources that contribute
or can be represented by {MEs, CEs, IEs}. By combining ratios {(M:m + M:a + M:c) + (C:m + C:a + C:c) + (I:m + I:a + I:c)}, the result equals the total DER for a system. Attack surface
measurements first showed potential to estimate the likelihood of an attack scenario through
research conducted by Michael Howard of Microsoft where he proved that systems operating
at elevated privileges were more likely to be attacked by those operating as general users. [8]
This study does not recommend full implementation of any of the above-mentioned
frameworks or methodologies in the proposed framework, but each will contribute various
elements to the final product which will be discussed in Chapter 4. Pre-Mortem Analysis
![Table 1. - Gartner’s Governance Maturity Model (Risk Approach) [35]Level 1: Level 2: Level 3: Level 4: Level 5:](https://thumb-us.123doks.com/thumbv2/123dok_us/8118770.238864/14.612.112.521.210.308/table-gartner-governance-maturity-model-approach-level-level.webp)