Design and Development of Spherical Camera based Deep Learning Enabled Auto Lane Width Measurement for Road Safety Grading System
TAY CHOON KIAT
This report is submitted in partial fulfillment of requirement for the award of the
Bachelor Degree of Electronic Engineering (Wireless Communication) with Honours
Faculty of Electronic and Computer Engineering Universiti Teknikal Malaysia Melaka
ii
Design and Development of Spherical Camera based Deep Learning Enabled Auto Lane Width Measurement for Road Safety Grading System
TAY CHOON KIAT
10 JULY 2017
4 B E N W
iii
“I hereby declare that the work in this project is my own except for summaries and quotations which have been duly acknowledge.”
Signature : ___________________________ Author : TAY CHOON KIAT
iv
“I acknowledge that I have read this report and in my opinion this report is sufficient in term of scope and quality for the award of Bachelor of Electronic
Engineering
(Wireless Communication) with Honors.”
Signature : ___________________________ Author : Dr. Lim Kim Chuan
v
vi
ACKNOWLEDGEMENT
This project is funded and fully supported by the Malaysia Institute of Road Safety (MIROS). I am grateful for funding from MIROS to allow me complete this final year project. I want to thank my team mate Hoo Jian Ea and Hasbullah. They have guide me along the project and have enlightened me when I was in bottleneck.
A sincere appreciation I must express to my project supervisor Dr. Lim Kim Chuan who always give me opportunities to learn and grow stronger. Of course, there are also guidance and delicious meal after work.
vii
ABSTRACT
viii
ABSTRAK
ix
TABLE OF CONTENTS
ACKNOWLEDGEMENT ... VI ABSTRACT ... VII ABSTRAK ... VIII
CHAPTER 1... 1
INTRODUCTION ... 1
1. ... 1
1.1 Project Background and Motivation ... 1
1.2 Objectives ... 5
1.3 Problem Statement ... 5
1.4 Scope of Project ... 5
CHAPTER 2... 6
LITERATURE REVIEW ... 6
2. ... 6
2.1 Lane Detection ... 6
2.2 Convolutional Neural Network ... 8
2.3 Deep Learning on Lane Detection ... 9
2.4 Deep Learning Semantic Segmentation ...10
2.5 DeepLab ...11
2.6 Fully Convolutional Network, FCN ...12
2.7 SegNet ...13
2.8 Conclusion ...16
CHAPTER 3...17
METHODOLOGY ...17
3. ...17
3.1 Flowcharts ...17
3.1.1 Overall flowchart ... Error! Bookmark not defined. 3.1.2 Dataset Preparation Flowchart ... Error! Bookmark not defined. 3.1.3 Lane Width Measurement Flowchart ... Error! Bookmark not defined. 3.1.4 Flowchart Description ... Error! Bookmark not defined. 3.2 CamVid Dataset ...21
3.3 Dataset preparation ...22
x
3.4 Operation of each layer in SegNet ...23
3.4.1 Input layer ...23
3.4.2 Convolution layer ...24
3.4.3 ReLU ...25
3.4.4 Pooling Layer ...26
3.5 Lane Width Measurement ...26
3.5.1 Singular Value Decomposition (SVD) ...26
3.5.2 Calibration ...27
3.5.3 Homography value ...27
3.5.4 Road Width measurement in Python ...30
3.5.5 Conclusion ... Error! Bookmark not defined. CHAPTER 4...31
RESULT AND DISCUSSION ...31
4. ...31
4.1 SegNet with CamVid dataset ...31
4.1.1 Training SegNet with CamVid Dataset 20k Iterations ...32
4.1.2 Training SegNet with CamVid Dataset 40k Iterations ...32
4.1.3 Prediction on normal video...33
4.2 Road Width Measurement using Predicted Road Marking ...35
4.3 SegNet with spherical images dataset ...38
4.3.1 Prediction on 360⁰ Spherical Camera using CamVid Dataset ..38
4.3.2 Training SegNet with 500 spherical images dataset ...40
4.3.3 Prediction on 360⁰ Spherical Camera with 500 Spherical Images dataset 41 4.3.4 Training SegNet with 1000 spherical images dataset...43
4.3.5 Prediction on 360⁰ Spherical Camera with 500 Spherical Images dataset 43 4.4 Conclusion ...46
CHAPTER 5...47
CONCLUSION AND RECOMMENDATION ...47
xi
5.1 Conclusion ...47
5.2 Recommendation ...49
REFERENCE...50
xii
LIST OF TABLE
TABLE 1.1 PRE-SURVEY CONFIGURATION ... 3
TABLE 1.2 MAIN FEATURES ON THE PROPOSED SYSTEM ... 4
TABLE 2.1 COMPARISON BETWEEN NEURAL NETWORK IN TERMS OF ACCURACY[18]...16
TABLE 3.1 PLANAR HOMOGRAPHY VALUE IN MATRIX ...29
TABLE 3.2 PIXEL COORDINATE OF CALIBRATION RIG IN IMAGE ...29
TABLE 3.3 REFERENCE COORDINATES OF CALIBRATION RIG ...29
TABLE 4.1 COLOR REPRESENTATION FOR EACH 12 CLASSES IN CAMVID DATASET ...32
xiii
LIST OF FIGURE
FIGURE 1.1 MIROS ROAD SURVEY CAR ... 2
FIGURE 1.2 PROPOSED ROAD SURVEY CAR ... 2
FIGURE 1.3 PROPOSED SYSTEM BLOCK DIAGRAM ... 3
FIGURE 2.1 IPM ILLUSTRATION[6] ... 7
FIGURE 2.2 IPM SAMPLE[6] ... 7
FIGURE 2.3 ARCHITECTURE OF ALEXNET[9] ... 8
FIGURE 2.4 LANE BOUNDARY GROUND TRUTH[10]... 9
FIGURE 2.5 EXAMPLE OF OBJECT CLASSIFICATION IN SEMANTIC SEGMENTATION[11] ...10
FIGURE 2.6 DEEPLAB MODELLING ILLUSTRATION[17] ...11
FIGURE 2.7 ILLUSTRATION OF FCN MODEL[14] ...12
FIGURE 2.8 SEGNET ARCHITECTURE, INPUT AND OUTPUT[18] ...13
FIGURE 2.9 COMPARISON OF PERFORMANCE BETWEEN SEGNET AND OTHER SEMANTIC SEGMENTATION NETWORKS[18] ...15
FIGURE 3.1 OVERALL PROJECT FLOWCHART ...18
FIGURE 3.2 DATASET PREPARATION FLOWCHART ...19
FIGURE 3.3 LANE MEASUREMENT FLOWCHART ...20
FIGURE 3.4 SEGMENTATION TRANSFORMATION FROM VIDEO FRAME TO SEGMENTATION ...21
FIGURE 3.5 THE 360CAM FRAMES FOOTAGE ...22
FIGURE 3.6 LABEL IMAGE ON MATLAB USING LIBLABEL ...23
FIGURE 3.7 SEGMENTED DATASET, GROUND TRUTH ...23
FIGURE 3.8 ILLUSTRATION OF CONVOLUTION LAYER ...24
FIGURE 3.9 RELU ILLUSTRATED IN GRAPH ...25
FIGURE 3.10 ILLUSTRATION OF MAX POOLING OPERATION ...26
FIGURE 3.11 CALIBRATION RIG IN CALIBRATION IMAGE ... ERROR! BOOKMARK NOT DEFINED. FIGURE 3.12 MATRIX COMBINE PIXEL COORDINATES AND REFERENCE COORDINATES ...28
xiv
FIGURE 4.2 TRAINING LOSS & TEST ACCURACY VS. ITERATION (MAX.
40K ITERATION) ...33
FIGURE 4.3 INPUT FRAME (SEGNET + CAMVID DATASET) ...34
FIGURE 4.4 OUTPUT FRAME (SEGNET + CAMVID DATASET) ...34
FIGURE 4.5 INPUT FRAME BEFORE SEGNET INFERENCE...37
FIGURE 4.6 SEGNET INFERENCE WITH THE ROAD WIDTH MEASUREMENT ...37
FIGURE 4.7 SPHERICAL INPUT FRAME (SEGNET + CAMVID DATASET) ...39
FIGURE 4.8 SPHERICAL OUTPUT FRAME (SEGNET + CAMVID DATASET) ...40
FIGURE 4.9 TRAINING LOSS & TEST ACCURACY VS. ITERATION (MAX. 40K ITERATION) ...41
FIGURE 4.10 SPHERICAL INPUT FRAME (SEGNET + SPHERICAL 500 IMAGE DATASET) ...42
FIGURE 4.11 SPHERICAL OUTPUT FRAME (SEGNET + SPHERICAL 500 IMAGE DATASET) ...42
FIGURE 4.12 TRAINING LOSS & TEST ACCURACY VS. ITERATION (MAX. 80K ITERATION) ...43
FIGURE 4.13 SPHERICAL INPUT FRAME ON HIGHWAY (SEGNET + SPHERICAL 1000 IMAGE DATASET) ...44
FIGURE 4.14 SPHERICAL OUTPUT FRAME ON HIGHWAY (SEGNET + SPHERICAL 1000 IMAGE DATASET) ...44
FIGURE 4.15 SPHERICAL INPUT FRAME TOWN AREA (SEGNET + SPHERICAL 1000 IMAGE DATASET) ...45
1
CHAPTER 1
INTRODUCTION
1.
This chapter will discuss about the project background and motivation, objectives, problem statement and the scope of the project.
1.1 Project Background and Motivation
2
Figure 1.1 MIROS Road Survey Car
[image:16.595.130.508.353.563.2]3
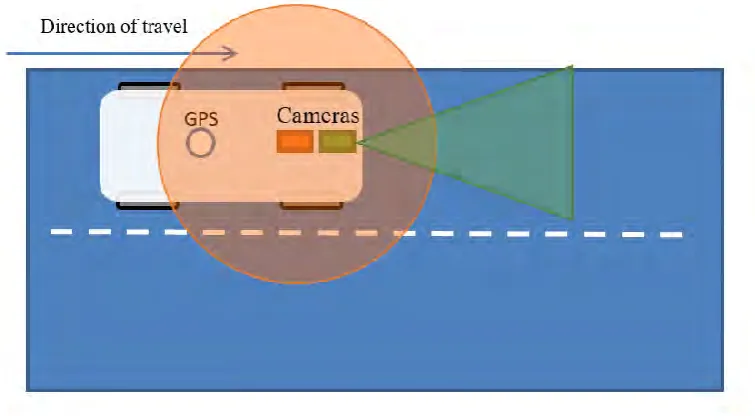
Figure 1.3 Proposed system Block Diagram
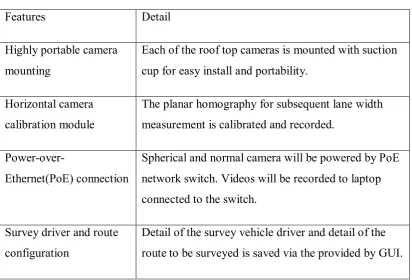
Table 1.1 Pre-survey configuration
Features Detail
Highly portable camera mounting
Each of the roof top cameras is mounted with suction cup for easy install and portability.
Horizontal camera calibration module
The planar homography for subsequent lane width measurement is calibrated and recorded.
Power-over-Ethernet(PoE) connection
Spherical and normal camera will be powered by PoE network switch. Videos will be recorded to laptop connected to the switch.
Survey driver and route configuration
Detail of the survey vehicle driver and detail of the route to be surveyed is saved via the provided by GUI.
Spherical Camera (Center) Normal Camera (Center) Roof top Power-over-Ethernet Switch NUC In vehicle GPS module
[image:17.595.114.527.451.731.2]4
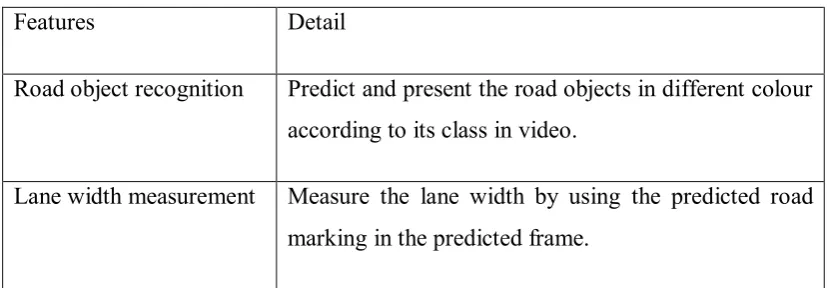
Table 1.2 Main features on the proposed system
Features Detail
Road object recognition Predict and present the road objects in different colour according to its class in video.
Lane width measurement Measure the lane width by using the predicted road marking in the predicted frame.
Figure 1.3 shows the proposed system improved over the current MIROS road survey vehicle in Figure 1.1. In Figure 1.2 the green color rectangular block is the normal camera while orange color rectangular block is the spherical camera and the green triangle and orange circle indicate the field of view respectively. However, the field of view in Figure 1.1and Figure 1.2 just for illustration purpose and no exact angle and distance. From Figure 1.3, the block diagram is clearly shows the camera is mounted on top of the survey vehicle roof using vacuum suction cup. While the other equipment for the recording video footage such as laptop and network switch are place in the vehicle for better management. Table 1.1shows the preparation to take before every survey and Table 1.2 shows the main features of this proposed system.
For road survey purposes, road in front of the survey vehicle can only capture certain but not all road scene in the video. This limits the possibilities of road survey study. 360⁰ spherical camera provides no blind spot to capture objects on the road. While the normal camera capture a higher definition and quality footage is suitable for predict the road marking which is further needed in lane width measurement.
Deep learning is an artificial intelligence subset that mimic the neurons function in human brains. Deep learning is chosen for road object detection and road marking detection because of its robustness of various environment recognition. For example, the survey is done at Malacca but applicable in other cities. There are many approaches proposed by others but might susceptible by the different ambients
5
1.2 Objectives
• To evaluate the accuracy of existing deep learning based Road Scene Recognition CNN model.
• To further train the identified CNN model for better accuracy with spherical camera imaging.
• To automate the lanes width measurement with the result of deep learning.
1.3 Problem Statement
The conventional visual recognition methods for road mark detection required manual parameter, image processing parameters thresholding and hand tuning kernel. The hand tuning kernel are susceptible for environment lighting changing and occlusion.
A sustainable visual recognition method able to recognize multiple objects (lane detection, vehicle classification, pedestrian detection), with auto kernels tuning for successful visual recognition for road safety star rating is needed.
1.4 Scope of Project
6
CHAPTER 2
LITERATURE REVIEW
2.
This chapter will discuss about the related work done by other researchers.
2.1 Lane Detection
Automating driving may help reduce this huge number of human fatalities. One useful technology is lane detection which has received considerable attention since the mid-1980s[3]. Techniques used varied from using monocular[4] to stereo vision [5]. Most of the techniques were focus on detection of lane marking on highway. Recently, Inverse Perspective Mapping (IPM) technique is used in lane detection for top-view of the image, and the image is filtered using selective Gaussian spatial filters that optimized to detects vertical lines[6]. Figure 2.1 shows how IPM theory illustration while Figure 2.2 is an example of IPM warping a picture from monocular to bird eye view.
RANSAC paradigm is also a famous technique used to get high accuracy and robust lane detection system, where it used to get the parameter of the hyperbola-pair model to detect the lane boundaries[7].
7
Figure 2.1 IPM illustration[6]
[image:21.595.117.521.420.579.2]8
2.2 Convolutional Neural Network
[image:22.595.115.527.399.607.2]Convolutional Lane detection is an operation that detect lane as the target object and outline the edge or highlight explicit road marking which detected or predicted. Current approaches to object recognition make essential use of machine learning methods. To improve their performance, we can collect larger datasets, learn more powerful models, and use better techniques for preventing overfitting[9]. In 2012, the state-of-the-art object recognition convolutional neural network (CNN) AlexNet won the ImageNet Large Scale Visual Recognition Competition 2012 by a significant margin, where the error rate of only 15.3% compared to 26.2% achieved by the second-best entry[9]. The distinct architecture of AlexNet considered “Deep” as it consists more than two convolutional neural network. Figure 2.3 shows the architecture of AlexNet, 5 convolutional layer, 3 Fully-Connected Layer and 1000 nodes of Softmax layer (Recognize 1000 different object). In machine learning term, the more dataset will produce better accuracy[9]. Dataset that trained on AlexNet contain 15 million labelled high resolution images and divided into 22,000 categories.
9
2.3 Deep Learning on Lane Detection
[image:23.595.119.520.256.558.2]Deep convolutional neural networks are normally called “Deep Learning”. Since deep learning is well proven good performance of object detection and recognition, there are numerous groups have applied deep learning technique to computer vision problem in highway perception scenarios[10]. Advanced-driver assistance system (ADAS) and LIDAR are good performance piece of equipment to detects the lane on road, however the price is very expensive. On the other hand, deep learning based computer vision approach provide a robust solution on lane detection.
Figure 2.4 Lane boundary ground truth[10]
10
2.4 Deep Learning Semantic Segmentation
[image:24.595.117.522.192.344.2]For road safety survey, lane detection alone is far from achieving the survey purpose. To teach computer to understand the road scene is the key to advance road surveying system. Scene labelling consists in labelling every pixel in an image with categories of the object belongs to[11].
Figure 2.5 Example of object classification in semantic segmentation[11]
Figure 2.5 shows the result of the Farabet Group[11] approach on semantic segmentation object classification. These are the result from proposed multiscale convolutional network and a flat Conditional Random Field (CRF).
![Figure 2.2 IPM Sample[6]](https://thumb-us.123doks.com/thumbv2/123dok_us/73442.6917/21.595.117.523.140.371/figure-ipm-sample.webp)
![Figure 2.3 Architecture of AlexNet[9]](https://thumb-us.123doks.com/thumbv2/123dok_us/73442.6917/22.595.115.527.399.607/figure-architecture-of-alexnet.webp)
![Figure 2.4 Lane boundary ground truth[10]](https://thumb-us.123doks.com/thumbv2/123dok_us/73442.6917/23.595.119.520.256.558/figure-lane-boundary-ground-truth.webp)
![Figure 2.5 Example of object classification in semantic segmentation[11]](https://thumb-us.123doks.com/thumbv2/123dok_us/73442.6917/24.595.117.522.192.344/figure-example-of-object-classification-in-semantic-segmentation.webp)
