ISSN 1017-6004
eurostat
EXTERNAL TRADE
Monthly statistics
6 I I
1 9 9 4
eurostat
OFICINA ESTADÍSTICA DE LAS COMUNIDADES EUROPEAS DE EUROPÆISKE FÆLLESSKABERS STATISTISKE KONTOR STATISTISCHES AMT DER EUROPÄISCHEN GEMEINSCHAFTEN ΣΤΑΤΙΣΤΙΚΗ ΥΠΗΡΕΣΙΑ ΤΩΝ ΕΥΡΩΠΑΪΚΩΝ ΚΟΙΝΟΤΗΤΩΝ STATISTICAL OFFICE OF THE EUROPEAN COMMUNITIES OFFICE STATISTIQUE DES COMMUNAUTÉS EUROPÉENNES ISTITUTO STATISTICO DELLE COMUNITÀ EUROPEE
BUREAU VOOR DE STATISTIEK DER EUROPESE GEMEENSCHAPPEN SERVIÇO DE ESTATÍSTICA DAS COMUNIDADES EUROPEIAS
L2920 Luxembourg Tél. 43 011 Télex COMEUR LU 3423 B1049 Bruxelles, rue de la Loi 200 Tél. 299 11 11
Las publicaciones de Eurostat están clasificadas por temas y por series. La clasificación se encuentra al final de la obra. Para mayor información sobre las publicaciones, rogamos se pongan en contacto con Eurostat. Para los pedidos, diríjanse a las oficinas de venta cuyas direcciones figuran en la página interior de la contracubierta.
Eurostats publikationer er klassificeret efter emne og serie. En oversigt herover findes bag i hæftet. Yderligere oplysninger om publikationerne kan fås ved henvendelse til Eurostat.
Bestilling kan afgives til de salgssteder, der er anført på omslagets side 3.
Die Veröffentlichungen von Eurostat sind nach Themenkreisen und Reihen gegliedert. Die Gliederung ist hinten in jedem Band aufgeführt. Genauere Auskünfte über die Veröffentlichungen erteilt Eurostat.
Ihre Bestellungen richten Sie bitte an die Verkaufsbüros, deren Anschriften jeweils auf der dritten Umschlagseite der Veröffentlichungen zu finden sind.
Οι εκδόσεις της Eurostat ταξινομούνται κατά θέμα και κατά σειρά. Η ακριβής ταξινόμηση αναφέρεται στο
τέλος κάθε έκδοσης. Για λεπτομερέστερες πληροφορίες σχετικά με τις εκδόσεις, μπορείτε να απευθύ-νεσθε στην Eurostat.
Για τις παραγγελίες μπορείτε να απευθύνεσθε στα γραφεία πώλησης, των οποίων οι διευθύνσεις αναγράφονται στη σελίδα 3 του εξωφύλλου.
Eurostat's publications are classified according to themes and series. This classification is indicated at the end of the publication. For more detailed information on publications, contact Eurostat.
Orders are obtainable from the sales offices mentioned on the inside back cover.
Les publications d'Eurostat sont classées par thème et par série. Cette classification est précisée à la fin de l'ouvrage. Pour des informations plus détaillées sur les publications, contactez Eurostat.
Pour les commandes, adressez-vous aux bureaux de vente dont les adresses sont indiquées à la page 3 de la couverture.
Le pubblicazioni dell'Eurostat sono classificate per tema e per serie. Tale classificazione è precisata alla fine dell'opera. Per informazioni più dettagliate sulle pubblicazioni rivolgersi all'Eurostat.
Per eventuali ordinazioni rivolgersi a uno degli uffici di vendita i cui indirizzi figurano nella 3a pagina della copertina.
De publikaties van Eurostat zijn ingedeeld naar onderwerp en serie. Deze indeling is achter in het boek opgenomen. Voor nadere informatie over de publikaties kunt u sich wenden tot Eurostat.
Gelieve bestellingen op te geven bij de verkoopbureaus, waarvan de adressen op bladzijde 3 van de omslag zijn vermeld.
As publicações do Eurostat estão classificadas por tema e por série. Esta classificação está indicada no firn da obra. Para mais informações sobre as publicações é favor contactar Eurostat.
EXTERNAL TRADE
Monthly statistics
Luxembourg: Office for Officiai Publications of the European Communities, 1994
© ECSC-EC-EAEC, Brussels · Luxembourg, 1994
Reproduction is authorized, except for commercial purposes, provided that the source is acknowledged.
Contents
Preface IV
Abbreviations IX
Trends in European Union trade XI
Analysis of the preceding month
Table OA: Results of seasonal adjustment XII
Table OB : Global trends XIV
Table OC: Trade by partner countries XVIII
Table OD: Trade by products XX
Trends in indices
Table OE: Indices of value, volume and unit value XXII
Table OF: Cover rate, volumes ratio and terms of trade XXIV
Table OG: Development of indices of European Union trade XXVI
World trade 1
Table 1 A: Trends in world trade 3
Table IB: Comparison of trade patterns of EU, the USA, Japan and EFTA 6
Table 1C: Trends in the trade of the most important third countries 8
Table 1D: Main trading partners of third countries 12
Table IE: Main trading partners of the EU 14
Trading partners 15
Table 2A: Development in EU trade 16
with the rest of the world, the USA, Japan and EFTA 17
Table 2B: Trends in the trade of goods with main trading partners - annual data 18
Table 2C: Trends in the trade of goods with main trading partners - monthly data 19
Table 2D: Partem of trade with main trading partners, by product 24
Products traded 29
Table 3A: Main products traded - annual data 30
Table 3B: Main products traded - monthly data 31
Table 3C: Geographical pattern of trade, by main products 34
Table 3D: Trade in agricultural products (main categories of product) 42
Table 3E: EU trade in petroleum and petroleum derivatives 58
Member States' external trade 67
Table 4A: Trends in the EU's external trade, by Member State 69
Table 4B: Trends in Member States' trade, by geographical zone 70
Table 4C: Geographical pattern of trade of Member States 78
Table 4D: Pattern of trade of Member States by product 86
EU trade by mode of transport 95
Table 5: EU trade by mode of transport 96
Annexes
99
Table 6: Conversion rates 100
Standard International Trade Classification (SITC, Rev. 3) 101
Foreword
1. Introduction
The monthly bulletin on external trade, published by Eurostat in the Β series, Short-term trends, sets out to provide
within the shortest possible deadlines data on short-term trends in the European Union's external trade. In particular,
it contains data on the European Union's trade flows with its trading partners and the various economic areas and a
breakdown of this data by major product group. The bulletin also provides an overview, based on data from various
international sources, of the place occupied by the European Union in the external trade of its main trading partners
and of third countries. Trade flows between Member States are recorded under the Intrastat system and will be
published at a later date.
The European Union's external trade statistics at the most detailed classification level are published monthly on
CD-ROM (B series: Intra and extra-EU trade).
Trends in external trade since 1958 and a comparison with world trade are contained in the publication
"External
Trade Statistical Yearbook
(Series A)".
External trade statistics are also available on line via the Eurostat data banks (Comext).
The catalogue of Eurostat publications and a detailed methodological description can be found in
"External Trade
Statistics User's Guide"
published in all languages of the European Union .
2.
Sources
Since 1978, the Member States have transmitted European Union external trade statistics according to a uniform
methodology laid down by Council Regulation (EEC) No 1736/75. This regulation was amended to take account of
the new developments in 1988, i.e. the introduction of the new external trade classification entitled "Combined
Nomenclature" (CN) and the new "Single Administrative Document".
The tables in this bulletin are compiled by Eurostat from the detailed data transmitted on magnetic tape by the
Member States; these data are broken down according to the eight-digit subheadings of the Combined
Nomenclature.
Eurostat wishes to take this opportunity of thanking the relevant departments in the Member States for their
cooperation, which enables it to compile these harmonized European Union statistics and to ensure their quality.
3. Coverage
The results of the European Union statistics relate to special trade. This comprises:
1) imports of goods placed in free circulation on their arrival at or on leaving warehouses, imports for inward
processing and imports after outward processing (customs procedures);
2) exports of European Union goods, exports after inward processing and exports for outward processing (customs
procedures).
Transit and warehousing traffic are not covered by European Union statistics.
4. Statistical territory
The statistical territory of the European Union comprises the customs territory of the European Union excluding the
French overseas departments. Thus Greenland, the Canary Islands and Ceuta and Melilla are not covered, while the
Azores and Madeira for Portugal and the Balearics for Spain are.
From October 1990, the external trade data of the Federal Republic of Germany, the other Member States and EUR 12
relate to the Federal Republic of Germany in its borders after 3 October 1990.
5. Goods classification
In this publication the results are broken down by the sections and divisions of the UN Standard International Trade
Classification (SITC Rev. 3 since 1988) by means of correspondence tables drawn up by Eurostat on the basis of the
Combined Nomenclature (CN).
6. Trading partners: countries and economic areas
The results of the European Union are broken down by country of origin, country of consignment and country of
destination in accordance with the "Country nomenclature for statistics on European Union external trade and trade
between its Member States", referred to as the Geonomenclature (Geonom).
When goods that originate in third countries and are not in free circulation in the European Union are imported, EU
statistics state the country of origin. When such goods are exported, the country of destination is specified.
7. Units ι
Values
The statistical value of goods on import is equal to the customs valuation or to a value determined by reference to the
concept of customs valuation (in the case, for example, of imports from other Member States). It is the CIF value
(cost, insurance, and freight).
The statistical value of goods on export is equal to their value at the place and time at which they leave the statistical
territory of the exporting Member State. It is the FOB value (free on board).
The value is expressed in European units of account (ecus). The ecu is a "basket" currency unit based on the market
exchange rates of a certain quantity of each European Union currency according to a weighting system involving the
five-year average of each Member State's gross national product and intra-EU trade balance. The rates used in this
bulletin are averages of daily rates. The bulletin contains a table showing the conversion rates used.
Quantity
The statistics give the net weight of the goods.
8. Confidentiality
Most Member States take measures to guarantee the confidentiality of certain flows of goods. The relevant
legislation, the procedures for implementing it and the range of goods subject to secrecy vary from one Member State
to another.
This confidentiality applies to the most detailed level of the classification used for collecting the data; it may therefore
refer to all or only part of a subheading of the Combined Nomenclature. Similarly, confidentiality may apply to
imports only or to exports only and to only some of the variables recorded (value, statistical procedure, quantities,
country, partner, etc.).
Measures are taken during collection and during processing by Eurostat to minimise the effect of these headings on
the results for the European Union as a whole; in particular, trade data on these headings are included at higher levels
of aggregation and in the totals.
9. Corrections
Every month the Member States send Eurostat a magnetic tape containing the results for the current month.
In order to correct these results, the Member States also send every month a magnetic tape containing monthly
corrections covering the previous 24-month period.
}· · ¡i- ' . , !;„<-;?:; ■■ w- ·>. Λ',ίΐ ■ ■. .;.Γίΐπ ;·:·',
Indices
1. Introduction
Changes overtime in the value of trade are influenced by variations in prices and the quantities marketed. Indices are
used to measure these two effects. In general, a system of indices is chosen so that the product of the volume index and
the price index expresses the value index. Several systems of indices meeting this requirement may be regularly used.
The results obtained by using one system will generally be different from those obtained by using another. For
various reasons the Member States do not use a common system, and the level of breakdown of their indices by
product group and by partner area also varies. Eurostat has therefore devised its own external trade indices which
enable it to calculate, for each Member State, European Union indices on a strictly comparable basis. These indices
may be consulted on the Trend database developed by Eurostat.
2.
Sources of data
There are basically two ways of obtaining information on prices: conducting price surveys by directly approaching
importers and exporters and using data collected by the customs authorities. At present only customs data are
available in all the Member States. Eurostat therefore calculates indices of unit values (values divided by quantities)
and uses them as price variation indicators. The computing programs contain a system for automatically identifying
extreme unit values pointing to unlikely price movements.
3. Extreme values
To avoid a number of restrictions involved in using customs data, Eurostat decided to adopt two basic principles in
calculating unit value indices: using the most detailed data possible and always bearing in mind that the object of the
exercise is to break down variations in value into a "price" component and a "volume" component. Two rules are
applied in order to exclude unlikely price movements. The first is that, given the general level of inflation, the price of
a product should not be very different from its level a year ago. Any variation of five or more points is regarded as
suspect. The second - more restrictive - rule is that the variation in the price of a product in relation to the most recent
month for which data are available should not be very different from the average price variation for similar products.
Applying these rules prevents extreme variations due to factors that are unconnected with prices and would otherwise
distort the unit value index. For products whose unit values are rejected, the variations are taken to be the same as
those for similar products.
4. Classification used
The United Nations Standard International Trade Classification (SITC), revised for the third time in 1988, was drawn
up on the basis of the Harmonized Commodity Description and Coding System (HS). Using tables of correspondence
between the various classifications (Nimexe, Combined Nomenclature and SITC), Eurostat has been able to publish
an uninterrupted time series of external trade indices from 1979 to the present.
From 1994 onwards, external trade publications will give indices calculated from 1989 on the basis of the following
SITC Rev. 3 aggregates:
TOTAL: all commodities;
0+1 : foods, beverages and tobacco;
2+4: crude materials, except fuels;
3: fuels
5+6+7+8: manufactured goods.
By compiling other correspondence tables, Eurostat is able to supply complete time series based on other
classifications.
5. Types of indices and rebasing
Eurostat calculates Fisher's "ideal" annual chain indices. Since the "basket of goods" marketed at international level
varies rapidly over time, the annual chain permits the updating of the index weightings. Each month the changes in
unit values in the product groups at detailed level are weighted in order to obtain the changes in unit values in the
various major product categories. Since these changes are based on the previous year, a chain of unit values is
obtained. The corresponding volume index chain is the ratio of the unit value variation to the variation in value for the
month in question compared with the monthly average for the previous year. The indices published each month are
calculated by multiplying the above-mentioned chains by the annual indices for the previous year, a fixed reference
period having been chosen (at present 1990). The annual unit value chains are obtained by weighting the monthly
chains by the volumes, while the annual volume chains are calculated by dividing the annual value variations by the
unit value chains.
6. General comments
Only data on normal trade (statistical procedure 1 ) are used to calculate the unit value indices; however, data on
total trade (covering all the statistical procedures) are used to calculate the value indices from which the volume
indices are obtained.
The unit value indices are calculated on the basis of values expressed in ecus.
For any further information on the methods used to calculate the indices, please refer to Eurostat's specialised
publications.
Symbols and abbreviations used
EU: Total of the EU member States
UEBL: Belgo-Luxembourg Economic Union (BLEU)
DK: Denmark
D: Federal Republic of Germany
GR: Greece
E: Spain
F: France
URL: Ireland
I: Italy
NL: Netherlands
P: Portugal
UK: United Kingdom
USA: United States of America
0: Data less than half the unit used
Mio: Million
Mrd: 1000 millions
ECU: European currency unit
Eurostat: Statistical Office of the European Communities
SITC: Standard International Trade Classification
Data sources
European Union
B:
DK:
D:
GR:
E:
F:
IRL:
I:
NL:
P:
UK:
Belgique / Luxembourg
Danmark
Deutschland
Ελλάδα
España
France
Ireland
Italia
Nederland
Portugal
United Kingdom
Institut national de statistiques, Bruxelles
Danmarks Statistik, København
Statistisches Bundesamt, Wiesbaden
Εθνική Στατιστική Υπηρεσία Ελλάδας, Αθήνα
Dirección General de Aduanas e Impuestos Especiales, Madrid
Direction générale des douanes et droits indirects, Paris
Central Statistics Office, Dublin
Istituto centrale di statistica, Roma
Centraal Bureau voor de statistiek, Heerlen
Instituto Nacional de Estatistica, Lisboa
HM Customs and Excise, Statistical Office, Southend-on-Sea
Other countries
International Monetary Fund, Direction of Trade
Commentary and graphs
The commentary refers to the state of the CRONOS database on 30.05.1994
Available data in this Issue
November 1993 December 1993 January 1994 February 1994 March 1994
EU X
UEBL X X
DK X X
D X X
GR Χ
E Χ Χ Χ
F Χ Χ Χ Χ
IRL Χ
Ι Χ Χ Χ
NL Χ
Ρ χ χ χ
υκ
Seasonal Adjustments: Results
After a period of relative stability lasting from
mid-1991 to early 1993, figures for the
European Union's exports to the rest of the
world, adjusted for seasonal variations, have
since climbed steeply (+9.6% for the first 11
months of the year compared with the same
period in 1992). This tendency was amplified
by the figure for November 1993, up 1.5% on
the previous month's.
Seasonally-adjusted figures for the Union's
imports from the rest of the world had been
falling fairly steadily since mid-1991, but
became extremely volatile during the early
months of 1993. Since then imports have
remained relatively stable and, after peaking
in August, imports in November showed
growth of just 0.7% over October.
The Union's balance of trade has been
improving since the third quarter of 1991
and, adjusted for seasonal variations, was in
surplus during November for the sixth time in
1993 (+1.4 bn ecus). Over the past twelve
months the balance of trade has been
reduced to 10.9 bn ecus.
Exports
Mrd. ECU
Imports
Mrd. ECU1985 1986 1987 1988 1989 1990 1991 1992 1993 1985 1986 1987 1988 1989 1990 1991 1992 1993
Trade Balance
Mrd. ECU1985 1986 1987 1988 1989 1990 1991 1992 1993
Unadjusted Seasonally Adjusted
TABLE OA - EUR 12 EXPORTS, IMPORTS, TRADE BALANCE (1)
Period
Jan-90 Feb-90 Mar-90 Apr-90 May-90 Jun-90 Jul-90 Aug-90 Sep-90 Oct-90 Nov-90 Dec-90 Jan-91 Feb-91 Mar-91 Apr-91 May-91 Jun-91 Jul-91 Aug-91 Sep-91 Oct-91 Nov-91 Dec-91 Jan-92 Feb-92 Mar-92 Apr-92 May-92 Jun-92 Jul-92 Aug-92 Sep-92 Oct-92 Nov-92 Dec-92 Jan-93 Feb-93 Mar-93 Apr-93 May-93 Jun-93 Jul-93 Aug-93 Sep-93 Oct-93 Nov-93
Seasonally Adjusted Series (2) ·
Exports Not Adjusted
34,1 33,6 37,7 33,3 35,6 35,1 35,5 31,4 31,2 38,8 36,9 35,4 32,6 31,7 34,4 34,5 34,4 34,7 38,6 32,1 34,3 40,0 37,5 38,4 32,7 34,2 38,3 37,1 34,0 35,9 39,4 30,1 35,7 39,8 36,6 40,9 31,1 35,1 40,4 38,7 37,7 42,4 41,9 35,3 40,7 44,2 44,1
Seasonally Adjusted
37,1 36,0 35,6 35,0 35,4 34,9 34,0 34,7 33,0 35,1 35,0 33,9 34,9 33,9 34,3 34,2 34,5 34,9 36,3 36,6 35,7 35,5 36,7 35,7 35,6 36,2 36,2 37,2 35,9 34,7 36,6 35,5 35,9 36,6 35,6 36,8 35,8 37,6 37,6 38,9 39,9 40,3 39,8 40,2 41,0 41,5 42,1
- Bio. ECU
Imports Not Adjusted
39,6 35,6 40,2 37,1 39,4 37,8 36,8 35,2 36,6 43,9 41,9 36,0 43,0 37,3 39,2 43,3 42,3 40,4 43,9 37,0 41,6 44,5 42,2 38,3 41,4 39,8 44,0 42,5 40,0 40,6 42,0 33,3 39,8 41,4 39,4 40,5 36,4 39,6 43,4 40,8 37,8 41,1 39,8 37,9. 41,9 41,2 42,5
Seasonally Adjusted
38,5 37,7 38,0 37,8 37,7 37,8 36,6 38,8 37,8 40,3 40,3 38,9 41,5 39,5 39,1 40,9 41,1 41,4 42,6 41,8 42,2 40,4 41,8 40,1 40,8 41,5 41,2 41,3 41,0 39,3 40,8 39,0 38,3 39,4 39,4 41,0 38,1 41,5 39,6 39,8 39,2 39,4 39,5 42,3 40,8 40,5 40,7
Trade Balance Not Adjusted
-5,5 -2,0 -2,5 -3,8 . -3,8
-2,7 -1,3 -3,8 -5,4 -5,1 -5,0 -0,6 -10,4 -5,6 -4,8 -8,8 -7,9 -5,7 -5,3 -4,9 -7,3 -4,5 -4,7 0,1 -8,7 -5,6 -5,7 -5,4 -6,0 -4,7 -2,6 -3,2 -4,1 -1,6 -2,8 0,4 -5,3 -4,5 -3,0 -2,1 -0,1 1,3 2,1 -2,6 -1,2 2,9 1,6
Seasonally Adjusted
-1,4 -1,6 -2,4 -2,8 -2,3 -2,9 -2,7 -4,1 -4,8 -5,1 -5,3 -5,0 -6,6 -5,6 -4,8 -6,8 -6,6 -6,6 -6,3 -5,2 -6,5 -4,9 -5,1 -4,4 -5,2 -5,3 -4,9 -4,1 -5,2 -4,6 -4,2 -3,6 -2,4 -2,8 -3,8 -4,2 -2,3 -4,0 -1,9 -0,9 0,7 0,9 0,3 -2,1 0,3 1,0 1,4
(1 ) As from October 1990, the territory of the Federal Republic of Germany includes the territory of the former German Democratic Republic, including East Berlin. Community results are drawn up accordingly.
(2) Seasonal Adjustment via X11/ARIMA procedure.
GLOBAL TRENDS IN EXTERNAL TRADE
EXTERNAL TRADE OF THE EUROPEAN UNION: Results for November 1993.
The difference in export and import trends between the first eleven months of 1992 and 1993
was + 10 points for the European Union, 7 points for the United States, + 3 points for Japan.
The trade deficit of the
European Union
for the first
eleven months of 1993 was around ECU 10 billion,
compared with almost 50 billion for the corresponding
period of 1992. Imports into the EU fell slightly be
tween JanuaryNovember (0.2%), while exports to
countries outside the European Union rose sharply:
9.9%.
The trade balance of the
United States
was in deficit
by ECU 110.8 billion for the period JanuaryNovem
ber 1993, a deterioration of some 37 billion compared
with the corresponding months of 1992. Imports to
the United States increased by 21.1% in ecus be
tween the first eleven months of 1992 and 1993, and
by 9% in dollars. Exports from the United States
were up by 14.1% in ecus and by 3% in dollars.
In November 1993, Japan's cumulative trade surplus
as from January 1993 was ECU 93 billion, an in
crease of ECU 18 billion compared with JanuaryNo
vember 1992. Exports from Japan increased by
17.2% in ecus and by 6% in dollars and fell by 6% in
yen. Imports to Japan rose by 14.1 % in ecus and by
3% in dollars, and recorded a drop of almost 5% in
yen.
GR.0B I IMPORTS AND EXPORTS (CIF, FOB)
(Annual % change)
L π π
"al
g
_
¡J
30
•Id
ei 92 92 93 92
0111 11
EUR12
•20
: í —ι SS
¡li
91 92 92 93 92 93
0111
11
1
π»
ι
I
Π
h
à
si
S
1
:
Γ
i i
¡
!
P
USA
i
Imports
91
92 92 93 92 93
01-11
11
JAPAN
U
Exports
1 billion = 10'
TABLE OB I - TRADE BALANCE, IMPORTS AND EXPORTS (1)
COUNTRIES
EUR-12 United States" Japan
BLEU Denmark Germany Greece Spain France Ireland Italy Netherlands Portugal United Kingdom
EUR-12 United States "
Japan
BLEU Denmark Germany Greece Spain France Ireland Italy Netherlands Portugal United Kingdom
EUR-12 United States " Japan
BLEU Denmark Germany Greece Spain France Ireland Italy Netherlands Portugal United Kingdom
Memorandum Item 1 USDs...ECU 1 YEN = ..ECU
(1) External Trade Statist (2) Bn=1000.000.000 * Estimate.
** CIF component estima : Not available.
1991
-70,5 -68,9 62,9
-7,2 1,2 6,2 - 4 , * -12,5 -3,9 -0,2 -6,2 -20,5 -2,8 -20,2
6,8 1,3 4,0
4,7 3,7 15,6 24,1 7,8 6,2 9,9 2,2 6,1 -2,2 -1,9
0,9 10,1 12,9
2,2 0,6 1,7 12,2 6,9 3,4 6,8 0,3 2,5 -4,2 -5,7
2,8 10,4
1992
-52,1 -80,9 82,2
-5,3 2,2 8,5 -4,1 -11,8 3,1 0,9 -1,6 -20,9 -2,7 -20,4
1993 II
1993 III
1992 01-11
1993 01-11
T R A D E BALANCE (Bn ECU) (2)
-0,7 -27,0 24,6
-0,1 0,7 4,3 -1,1 -1,4 2,9 0,3 2,6 -3,2 -0,7 ^,9
-0,9 -37,4 26,1
0,0 0,6 3,5 -1,2 -1,1 1,7 0,5 3,6 -3,1 -0,5 -5,0
-50,3 -73,4 74,6
-5,3 1,9 7,0 -3,4 -11,0 1,9 0,8 -2,9 -17,3 -2,5 -19,6
IMPORTS
-10,2 -110,8 92,7
-0,4 2,3 15,9 -3,8 -4,2 3,2 1,0 8,7 -12,2 -2,4 -18,2
1992 11
-2,9 -8,4 7,2
-0,0 0,4 0,8 -0,2
-o»
0,7 0,1 -0,4 -1,4 -0,2 -1,7
% change o n the corresponding period of the previous year -1,3
4,2 -5,8
-4,6 -2,3 -0,1 -4,1 1,2 -4,5 -9,2 -3,8 3,1 1,7 0,0
-2,7 16,4 11,0
-6,3 -9,0 0,3 17,4 -16,6 -6,7 13,6 -7,7 -2,5 -8,8 4,2
4,4 29,4 23,5
-0,5
10,1 3,8 25,3 -10,5 6,7 52,7
-3,8 0,3 -22,6 15,2
-2,3 3,0 -6,7
-4,6 -2,9 -1,4 -7,7 0,3 -4,9 -9,9 -2,9 -2,1 1,9 -0,5
EXPORTS
-0,2 21,1 14,0
-3,3 -1,3 0,0 16,6 -15,4 -2,0 37,7 -6,0 -2,2 -3,5 9,4
-6,6 12,4 -4,2
-12,7 -8,0 -3,1 -56,9 -13,2 -9,1 -7,2 -4,8 -2,7 10,0 -2,0
% change o n the corresponding period of the previous year 2,9
1,5 3,2
2,2 5,1 1,5 2,5
6,5 5,6
13,0 4,0 4,1 5,8 -0,3
11,4 9,8 14,3
19,0 5,9 8,9 72,5 16,1 7,7 12,1 16,4 17,2 -12,3 10,0
12,7 23,3 27,9
24,9 7,8 4,9 13,0 24,7 7,3 66,2 18,6 23,3 -22,0 19,5
2,5 0,3 2,5
0,8 5,6 0,8 4,1 6,1 4,9 11,8 4,9 3,5 7,0 -0,4
9,9 14,1 17,2
19,4 1,5 6,4 21,1 16,9 0,2 36,1 15,8 17,7 -4,3 15,0
-2,5 3,7 2,1
7,5 14,4 -4,5 3,5 -11,1 3,5 2,0 -3,3 -5,6 -11,2 -6,7
% change o n the corresponding period of the previous year
-4,5 1,4
5,2 24,8 cs excluding intra flows (Imports CIF, Exports FOB).
ted.
20,6 42,6
-5,3 0,8
10,9 26,4
1,5 6,2
1993 11
1,6 -11,7 8,3
0,0 0,3 1,9 -0,4 -0,0 0,8 0,2 1,2 -0,8 -0,2 -1,4
7,8 22,0 18,2
24,7 10,0 7,4 36,2 -8,5 1,9 40,8 -2,1 4,0 4,9 18,4
20,7 17,2 17,7
27,8 1,1 15,2 23,7 36,9 3,5 64,7 33,3 33,4 19,2 31,4
9,8 26,1
GLOBAL TRENDS IN EXTERNAL TRADE
EXTERNAL TRADE OF THE MEMBER STATES: Results for November 1993.
Germany and Italy had the highest surpluses for JanuaryNovember 1993 and also recorded the
most marked improvements compared to the corresponding period of 1992.
Germany
and
Italy
had the highest external trade
surpluses for the first eleven months of 1993, with
balances of ECU 15.9 billion and ECU 8.7 billion
respectively. The Italian surplus was ECU 11.6 bil
lion higher than in JanuaryNovember 1992. Italian
exports rose by 15.8% between the first eleven
months of 1992 and 1993. Imports to Italy fell by 6%
between the two periods.
The German surplus increased by ECU 8.7 billion.
Germany's exports rose by 6.4%, whereas imports
remained stable.
The trade deficits of
Spain,
the
Netherlands
and the
BLEU
rose by ECU 6.8 billion, 5.1 billion and 4.9
billion respectively between the first eleven months of
1992 and 1993. Exports by these countries grew by
around 18%. Imports fell by 15% in Spain, whereas
those of the Netherlands and the BLEU were down
by almost 3%.
The external trade balances of the
United Kingdom
and
France
improved by ECU 1. 4 billion each.
United Kingdom exports rose by 15%, compared to a
9% increase in the country's imports. Trade flows in
France were more subdued: +0.2% for exports and
2% for imports.
The trade balances of
Denmark, Ireland
and
Portu
gal
increased by less than ECU 0.2 billion compared
to JanuaryNovember 1992. Danish imports recorded
a decline of 1.3%, while exports fell by 1.5%. Trade
flows in Ireland increased by 38% in the case of
imports and 36% in the case of exports. Portugal's
external trade recorded a fall of 3.5% in the case of
imports, and of 4.3% in the case of exports.
Only the
Greek
trade deficit declined (by ECU 0.4
billion) with exports rising more sharply (21.1%) than
imports (16.6%).
GR.OB II MEMBER STATE'S EXTRATRADE BALANCE
(BN ECU)
2 0 -ι
1 0
■ 1 0
■20
3 0
κΐΐπ ι
B-L DK D GR E F IRL I NL Ρ
H extra 92 01-11 CU extra 93 01-11
U K
EUR-12
BLEU
DENMARK
GERMANY
GREECE
SPAIN
FRANCE
IRELAND
ITALY
NETHERLANDS
PORTUGAL
UNITED KINGDOM
1991
-70,5
- 7 , 2
1,2
6,2
- 4 , 4
-12,5
-3,9
- 0 , 2
- 6 , 2
- 2 0 , 5
- 2 , 8
-20,2
TABLE OB II - EXTRA - EU TRADE BALANCE (1) 1992
-52,1
-5,3
2,2
8,5
-4,1
-11,8
3,1
0,9
-1,6
-20,9
-2,7
-20,4
1993 II
1993 III
1992 01-11
1993 01-11
TRADE BALANCE (Bn ECU) (2)
-0,7
-0,1
0,7
4,3
-1,1
-1,4
2,9
0,3
2,6
-3,2
-0,7
-4,9
-0,9
0,0
0,6
3,5
-1,2
-1,1
1,7
0,5
3,6
-3,1
-0,5
-5,0
-50,3
-5,3
1,9
7,0
-3,4
-11,0
1,9
0,8
-2,9
-17,3
-2,5
-19,6
-10,2
-0,4
2,3
15,9
-3,8
-4,2
3,2
1,0
8,7
-12,2
-2,4
-18,2
1992 11
-23
-0,0
0,4
0,8
-0,2
-0,8
0,7
0,1
-0,4
-1,4
-0,2
-1,7
1993 11
1,6
0,0
0,3
1,9
-0,4
-0,0
0,8
0,2
1,2
-0,8
-0,2
-1,4
(1) External Trade Statistics excluding intra flows (Importe CIF, Exports FOB). (2)Bn-1000.000.000
* Estimate. : Not available.
EUROPEAN UNION EXTERNAL TRADE BY PARTNER COUNTRY
TRADE BY VALUE: Results for November 1993.
In the first eleven months of I993 trade with the United States was in deficit by ECU 2.5 billion,
compared with ECU 12.8 billion for the corresponding months of 1992.
The European Union's trade deficit with the
industri-alised
countries was ECU 23.4 billion in the first
eleven months of 1993. This was almost half the
deficit for the corresponding months of 1992. Trade
with the United States and Canada showed a deficit
of ECU 2.5 billion, a reduction of some ECU 10 billion.
The trade deficit with Japan improved by almost ECU
5 billion and was now equal to the deficit with the
industrialised countries. The trade balance with EFTA
countries was - ECU 3.3 billion in January-November,
which was identical to the balance for the
correspond-ing months of 1992. Trade with the other countries of
Western Europe recorded a surplus of ECU 6.5
billion, an increase of ECU 4.2 billion.
Imports from the industrialised countries fell by 3.8%
between January-November 1992 and 1993. This
decline affected all zones. Made more expensive
owing to the change in the dollar-ecu parity (more
than+10%), imports from the United States and
Canada fell by 2%. Imports from the EFTA countries
declined by 2.3%. Imports from Japan were 7.8%
down on the level for the corresponding eleven
months of 1992, while the yen rose more than a
quarter against the ecu between January-November
1992 and January-November 1993.
Exports to the industrialised countries rose by 5.3%.
This increase was sustained by exports to the United
States and Canada (11.4%), encouraged by the
dol-lar-ecu parity. Exports to Japan benefited from a
similar exchange-rate phenomenon and increased
by 7.9% compared to January-November 1992.
Ex-ports from the European Union to the EFTA countries
fell by 2.5%, while those to the other Western
Euro-pean countries rose by more than a fifth.
Trade with the developing countries recorded a
sur-plus of ECU 19.5 billion in the first eleven months of
1993, or ECU 13.7 billion more than in
January-No-vember 1992. The trade balance with the
Mediterra-nean countries improved by some ECU 9 billion to
ECU 12.2 billion. The deficits observed in the first
eleven months of 1992 with the Latin American
coun-tries, Asian NICs and ACP countries were
trans-formed into surpluses in the corresponding period of
1993, improving by almost ECU 5.4 billion and 3
billion respectively. Trade with the OPEC countries
showed a slight surplus (ECU 1 billion) in
January-November 1993, whereas they had recorded a deficit
of ECU 1.2 billion in the first eleven months of 1992.
Imports from the developing countries fell sharply
(-0.7%). Imports from the OPEC countries fell by
6.8%, whereas the cost of the Community's crude oil
supplies expressed in ecu per barrel showed a
sus-tained downturn after September 1993. Products
imported from Mediterranean countries declined by
7%. Imports from Latin American countries showed
the same trend (-9.8%), while those from the ACP
countries fell by about a fifth between the first eleven
months of 1992 and those of 1993. Only imports from
Asian NICs increased, by 6.4%.
Exports to the developing countries rose sharply in
January-November 1993: +9.3%. Exports to the
Mediterranean countries, the Latin American
coun-tries and the Asian NICs recorded the highest
in-crease: +16%,+ 17% and +22.1%. Exports to the
OPEC countries and to the ACP countries fell by
3.5%.
The trade balance with the countries of
Central and
Eastern Europe
was in surplus by almost ECU 2
billion for the period January-November 1993,
whereas it was in deficit by ECU 1.7 billion in
Janu-ary-November 1992. Imports from the Central and
Eastern European countries rose by 7.3%. Exports
from the European Union to this zone rose sharply:
+19.4%.
Trade with
China
was in deficit by ECU 7.9 billion
compared with ECU 9.4 billion for the first eleven
months of 1992. Imports from China increased by
some 17%, whereas exports from the European
Union to China rose by 68.4%.
GR.OC I- EXTRA-TRADE BALANCE BY MAIN PARTNER COUNTRIES
(BN ECU)
USA-CANADA
EFTA
JAPAN
DC
E F T A »
-91 92
. USA-CANADA
92
JAPAN
DC
USA-CANADA
EFTA
01-11 9 3 92
JAPAN
93
TABLE OC I - EUR-12 TRADE BALANCE AND TRADE FLOWS BY MAIN PARTNERS (1)
EXTRA-EU whose INDUSTRIALIZED THIRD COUNTRIES
- United States - Canada -Japan
-EFTA
COUNTRIES IN MIDDLE AND EASTERN EUROPE DEVELOPING COUNTRIES (2)
-Asian NICs (3) -OPEC
- Mediterranean Basin -ACP
- Latin America CHINA
EXTRA-EU whose
INDUSTRIALIZED THIRD COUNTRIES
- United States - Canada -Japan
-EFTA
COUNTRIES IN MIDDLE AND EASTERN EUROPE DEVELOPING COUNTRIES (2)
-Asian NICs (3) -OPEC
- Mediterranean Basin -ACP
-Latin America CHINA
EXTRA-EU whose
INDUSTRIAUZED THIRD COUNTRIES
- United States - Canada -Japan
-EFTA
COUNTRIES IN MIDDLE AND EASTERN EUROPE DEVELOPING COUNTRIES (2)
- Asian NICs (3) -OPEC
- Mediterranean Basin -ACP
-Latin America CHINA
1992 STRUC-TURE·/«
-100,0 59,0 19,6 10,6 22,9 7,5
29,9 6,1 8,8 8,4 3,7 5,0 3,4
100,0 55,1 18,9 4,7 24,7 8,1
35,1 6,3 9,6 10,4 3,9 4,6 1,6
1991
-70,5 -51,1
-21,3
-29,7 -1,9 -2,7
- 7 , 6 ^ , 8 - 7 , 5 2,4 -3,2 -8,4 -9,4
6,8 6,2 7,6 12,1 2,0 15,1
4,4 15,9 4,2 2,8 -4,9 2,2 41,2
0,9 -3,4 - 6 , 2 - 2 , 5 -2,2 17,2
6,1 10,3 10,9 0,5 -4,3 16,2 5,4
1992
-52,1 -48,0 -13,4 -31,0 -3,9
-1,4
7,1 -2,1 -0,7 4,2 -0,9
-4,5
-9,9
1993 II
1993 III
1992 01-11
1993 01-11
TRADE BALANCE (Bn ECU)
-0,7 -7,2 -0,3 -6,9 -1,3 1,1
7,2 1,1 0,5 3,7 0,9 0,2 -1,6
-0,9 -3,0 1,6 -5,8 -0,9 -0,2
4,5 0,4 -0,2 3,4 0,2 0,3 -2,4
-50,3 -45,1 -12,8 -28,7 -3,3 -1,7
5,8 -1,8 -1,2 3,1 -0,8 -4,1 -0,4 IMPORTS
-10,2 -23,4 -2,5 -23,5 -3,3 1,9
19,5 2,0 0,1 12,2 1,8 1,2 -7,9
1992 11
-2,9 - 3 , 5 -0,5 -2,6 -0,5 -0,1
1,6 -0,2 0,1 0,6 0,3 0,0 -0,8
% change on the corresponding period of the previous year -1,3
-1,9
-6,0 -0,6
0,8 5,7
-3,1
-2,7 -8,8 -5,4 -6,2
-5,4
12,1
-2,7 -5,9 -7,0 -10,4 -2,3 8,7
-5,1 3,6 -8,7 -7,7 -27,9 -14,2 18,6
4,4 1,1 7,4 -5,3 -0,2 5,7
4,6 12,0 -3,3
-4A
-9,1 -4,7
20,2
-2,3 -2,3 -6,4 -0,8 0,3 3,2
^ , 9 ^ , 6 -9,7 -6,2 -7,7 -7,9 10,2
EXPORTS
-0,2 -3,8 -2,0 -7,8 -2,3 7,3
-0,7 6,4 -€,8 -7,0 -19,0 -9,8 16,6
-6,6 -6,4 -11,1 -9,3 0,2 0,9
-10,6 -2,9 -17,8 -9,6 -26,0 -10,7 10,2
% change on the corresponding period of the previous year
2,9 -1,0 2,3
-7,4
-1,1 10,4
7,1 7,5 6,9 -1,0 7,0 14,5 22,2
11,4 6,1 13,1 7,7 -1,9 27,8
9,5 23,3 -3,7 17,5 2,0 16,8 104,7
12,7 8,9 16,2 11,6 -1,6 14,7
11,7
255 -1,2 253 -11,2 16,8 71,4
2,5 -1,5 1,6 -7,7 -1,2 9,1
7,3 7,3 7,2 -1,5 7,0 15,1 20,4
9,9 5,3 11,4 7,9 - 2 , 5 19,4
9,3 22,1 -3,5 16,0 -3,4 17,0 68,4
-2,5 -5,4 -4,1 -15,8 -0,2 1,7
0,9 8,0 2,2 -2,9 12,8 6,5 4,5
1993 11
1,6 -0,8 1,0 -2,0 -0,5 0,4
3,0 0,4 0,4 1,6 0,0 0,4 -0,9
7,8 4,5 6,5 -4,1 6,4 11,3
6,3 9,4 -7,3 0,7 9,7 1,6 29,0
20,7 19,0 28,7 27,6 6,9 31,2
16,4 35,6 -1,2 24,9 -13,0 21,0 45,2
(1) External Trade Statistics (Imports CIF, Exports FOB). Bn = 1000.000.000. * Estimate. (2) Some countries belong to several zones.
(3) Asian NICs include the following countries: Singapore, South Korea, Taiwan and Hong Kong.
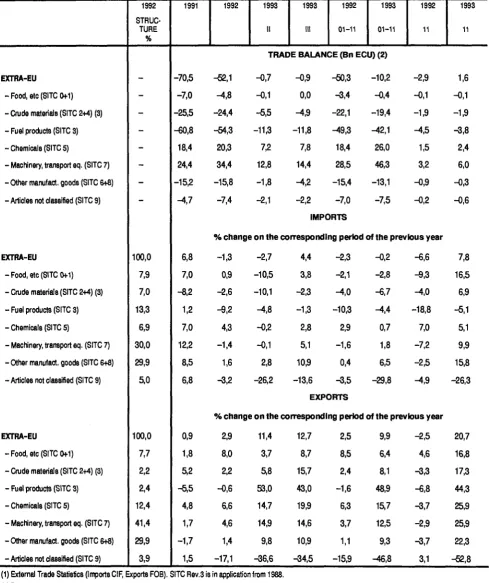
EUROPEAN UNION EXTERNAL TRADE BY PRODUCT
TRADE BY VALUE: Results for November 1993.
Exports of manufactured goods (SITC 58) increased by 11.8% between JanuaryNovember 1992
and JanuaryNovember 1993.
Trade in
machinery and transport equipment
(SITC 7) recorded a surplus of ECU 46.3 billion in the
first eleven months of 1993, an increase of some 18
billion over JanuaryNovember 1992. The balance in
chemicals
(SITC 5) improved by ECU 7.0 billion to
reach ECU 26 billion. The deficit in other manufac
tured goods (SITC 6+8) was down by 2.3 billion,
finishing at around ECU 13 billion.
The trade deficit in fuel products (SITC 3) improved
by ECU 7.2 billion between JanuaryNovember 1992
and 1993. Trade in crude materials (SITC 2+4) re
corded a smaller deficit than in the first eleven
months of 1992 (a difference of ECU 2.7 billion).
Trade in food etc. (SITC 0+1), which was ECU 3.4
billion in the first eleven months of 1992, was almost
in balance ( ECU 0.4 billion) for the corresponding
period of 1993.
Imports of
other manufactured goods
rose sharply
between JanuaryNovember 1992 and 1993: +6.5%,
with a lower increase for machinery and transport
equipment: +1.8%. Imports of chemicals rose slightly
(+0.7%). Imports of fuel products and crude maten
als fell by 4.4% and 6.7% respectively between the
first eleven months of 1992 and those of 1993. Im
ports of food etc. fell by 2.8%.
Exports of
machinery and transport equipment
rose by 12.5%, while other manufactured goods and
chemicals also recorded marked increases: +9.3%
and +15.7%. Exports of food etc.were 6.4% higher
than the level in JanuaryNovember 1992.
GR.OD I EXTRATRADE BALANCE (PRODUCTS GROUPS)
(BN ECU)
so·
40·
2 0 +
0
■20·
•40
•60·
Manufactures
92
Manufactures
10r
5
Prim.goods
•5-Fuels
Manufactures.
Prim.goods
Fuels
92
011193
92 11 93TABLE OD 1 - EUR-12 TRADE BALANCE AND TRADE FLOWS BY BROAD PRODUCT GROUPS (1)
EXTRA-EU
-Food, etc (SITC 0+1) - Crude materials (SITC 2+4) (3) - Fuel products (SITC 3) - Chemicals (SITC 5)
- Machinery, transport eq. (SITC 7) - Other manuf act. goods (SITC 6+8) - Articles not classified (SITC 9)
EXTRA-EU
-Food, etc (SITC 0+1) - Crude materials (SITC 2+4) (3) - Fuel products (SITC 3) -Chemical8(SITC5)
- Machinery, transport eq. (SITC 7) - Other manufact. goods (SITC 6+8) - Articles not classified (SITC 9)
EXTRA-EU
-Food, etc (SITC 0+1) - Crude materials (SITC 2+4) (3) -Fuel products (SITC 3) - Chemicals (SITC 5)
- Machinery, transport eq. (SITC 7) - Other manufact. goods (SITC 6+8) - Articles not classified (SITC 9)
1992
STRUC-TURE %
-100,0 7,9 7,0 13,3 6,9 30,0 29,9 5 0
100,0 7,7 2,2 2,4 12,4 41,4 29,9 3,9
1991
-70,5 -7,0 -25,5 -60,8 18,4 24,4 -15,2 -4,7
6,8 7,0 -8,2 1,2 7,0 12,2 8,5 6,8
0,9 1,8 5 2 - 5 , 5 4,8 1,7 -1,7 1,5
1992
-52,1
-4,8
-24,4
-54,3 20,3 34,4 -15,8 -7,4
1993
II
1993
III
1992
01-11
1993
01-11
TRADE BALANCE (Bn ECU) (2)
-0,7 -0,1 -5,5 -11,3 7,2 12,8 -1,8 -2,1
-0,9 0,0 ^ , 9 -11,8
7,8 14,4 -4,2 -2,2
-50,3 -3,4 -22,1 -49,3 18,4 28,5 -15,4 -7,0
IMPORTS
-10,2 -0,4 -19,4 -42,1 26,0 46,3 -13,1 -7,5
1992
11
-2,9 -0,1 -1,9 ^ , 5 1,5 3,2 -0,9 -0,2
% change on the corresponding period of the previous year
-1,3
0,9
-2,6
-9,2
4,3
-1,4
1,6
-3,2
-2,7 -10,5 -10,1 -4,8 -0,2 -0,1 2,8 -26,2
4,4 3,8 -2,3 -1,3 2,8 5,1 10,9 -13,6
-2,3 -2,1 -4,0 -10,3 2,9 -1,6 0,4 -3,5
EXPORTS
-0,2 -2,8
SJ
-4,4 0,7 1,8 6,5 -29,8
-3,6 -9,3 ^ , 0 -18,8
7,0 -7,2 -2,5 -4,9
% change on the corresponding period of the previous year
2,9 8,0 2,2 -0,6 6,6 4,6 1,4 -17,1
11,4 3,7 5,8 53,0 14,7 14,9 9,8 -36,6
12,7 8,7 15,7 43,0 19,9 14,6 10,9 -34,5
2,5 8,5 2,4 -1,6 6,3 3,7 1,1 -15,9
9,9 6,4 8,1 48,9 15,7 12,5 9,3 -46,8
-2,5 4,6 -3,3 -6,8 -3,7 -2,9 -3,7 3,1
1993
11
1,6 -0,1 -1,9 -3,8 2,4 6,0 -0,3 -0,6
7,8 16,5 6,9 -5,1 5,1 9,9 15,8 -26,3
20,7 16,8 17,3 44,3 255 25,9 22,3 -52,8
(1) External Trade Statistics (Imports CIF, Exports FOB). SITC Rev.3 is in application from 1988. (2) Bn-1000.000.000
(3) Petroleum not included. * Estimate.
Ξ
INDICES
TRENDS IN EXTRA-EU TRADE
SITC Rev. 3
1990 = 100
Period
1989 1990 1991 1992
1992 Dec
1993 Jan Feb Mar Apr May Jun
Jul Aug Sep Oct Nov Dec
1989 1990 1991 1992
1992 Dec
1993 Jan Feb Mar Apr May Jun
Jul Aug Sep Oct Nov Dec
IMPORTS
0-9
98 100 107 106
105
94 102 117 105 97 105
102 98 106 106 109 106
95 100 107 107
105
92 99 113 101 95 103
98 93 102 102 105 102
0+1
103 100 107 108
116
93 98 123 107 97 104
105 95 105 110 124 125
93 100 104 108
117
91 95 118 104 97 106
103 92 100 105 117 117
2+4
115 100 92 90
85
71 87 99 86 79 92
82 69 86 83 90 90
105 100 98 100
96
81 99 112 99 92 106
92 76 94 91 100 100
3
90 100 103 93
100
89 82 99 92 87 86
89 96 83 91 90 92
97 100 110 110
117
107 97 113 106 101 101
106 115 104 113 114 121
5-8
EXPORTS
0-9
VALUE
97 100 110 112
109
102 114 129 115 105 116
111 107 119 117 120 115
99 100 102 104
118
87 101 121 111 108 122
121 102 116 127 126 139
VOLUME
93 100 107 107
102
93 103 116 104 96 106
99 95 106 104 106 101
100 100 100 100
112
81 93 111 102 100 113
111 93 107 117 116 127
0+1
103 100 103 111
116
102 115 139 122 115 128
114 114 137 140 141 148
102 100 105 111
117
99 113 135 117 110 122
112 111 134 139 137 143
2+4
112 100 105 108
110
109 114 143 122 113 119
113 111 131 134 129 137
104 100 107 113
116
114 118 147 127 117 124
118 115 136 142 135 139
3
86 100 95 95
108
90 109 122 119 128 129
119 117 122 147 121 138
95 100 95 103
114
97 117 126 124 132 137
124 125 134 166 138 160
5-8
100 100 102 105
121
89 105 125 116 112 127
128 105 119 131 131 145
100 100 99 100
114
81 95 113 105 102 116
116 95 108 119 119 131
Estimated data : Ireland.Greece and Netherlands tor December 1993.
Ξ
INDICES
TRENDS IN EXTRA-EU TRADE
SITC Rev. 3
1990 = 100
Period
1989 1990 1991 1992
1992 Dec
1993 Jan Feb Mar Apr May Jun
Jul Aug Sep Oct Nov Dec
IMPORTS
0-9
103 100 101 99
101
102 103 104 104 102 102
104 105 104 104 104 104
0+1
111 100 103 100
99
102 103 104 103 100 99
101 104 105 105 106 107
2+4
109 100 94 89
89
88 88 88 87 86 87
90 91 92 91 90 91
3
93 100 94 84
86
83 84 88 87 86 84
84 83 80 80 79 76
5-8
EXPORTS 0-9
UNIT VALUE
104 100 103 104
107
110 110 111 111 110 110
112 113 113 113 113 114
100 100 102 104
105
108 109 109 109 109 108
109 110 109 109 109 109
0+1
101 100 99 101
99
103 102 103 104 104 105
102 103 102 101 103 104
2+4
109 100 98 95
95
96 97 98 96 97 96
96 97 97 94 96 99
3
91 100 100 92
95
93 93 97 97 97 95
96 94 91 89 88 86
5-8
100 100 103 106
106
110 110 111 111 110 109
110 111 111 111 111 111
Ξ
INDICES
TRENDS IN EXTRA-EU TRADE ( ratios
)
SITC Rev. 3
1990 = 100
Period
1989 1990 1991 1992
1992
1993
1989 1990 1991 1992
1992
1993 Dec
Jan Feb Mar Apr May Jun
Jul Aug Sep Oct Nov Dec
Dec
Jan Feb Mar Apr May Jun
Jul Aug Sep Oct Nov Dec
0-9
102 100 95 98
112
93 100 103 106 112 116
118 104 109 120 116 131
105 100 94 93
107
88 94 99 101 105 109
113 100 104 115 111 124
0+1
100 100 97 103
100
110 117 113 114 119 122
109 120 130 128 114 119
2+4
COVER RATE 0)
98 100 114 121
129
154 130 145 142 143 128
137 160 154 162 144 152
VOLUMES RATIO (2)
110 100 101 102
100
109 118 114 113 113 115
108 121 134 132 118 122
98 100 109 113
121
141 118 131 129 128 118
129 151 145 155 134 139
3
96 100 92 102
108
101 133 123 130 148 151
134 123 147 162 135 150
97 100 87 93
98
91 121 112 117 131 135
117 108 129 147 122 132
5-8
103 100 92 94
111
88 92 97 101 107 110
116 99 100 113 110 126
108 100 93 93
112
87 92 98 101 107 110
117 100 102 114 112 129
(1) The indicator "cover rate" is equal to the ratio of the export value index to the import value index. (2) The indicator "volumes ratio" is equal to the ratio of the export volume index to the import volume index.
Ξ
INDICES
TRENDS IN EXTRA-EU TRADE ( ratios
)
SITC Rev. 3
1990 = 100
Period
1989 1990 1991 1992
1992
1993
Dec
Jan Feb Mar Apr May Jun
Jul Aug Sep Oct Nov Dec
0-9
96 100 102 106
104
106 106 105 105 106 106
105 105 105 104 105 105
0+1 2+4 3
TERMS OF TRADE d>
91 100 96
101
100
101
99 99
101 105 106
101
99 97 97 97 97
99
100
104
107
107
109
110 111 110 112
109
106 106 106
104
107 109
98 100 107
109
111
112 110 110 111 113 112
115
113
114 110 111 114
5-8
95
100 100 101
99
100
100
99 100
100
100
98 99 98 98 98 97
(1 ) The indicator "terms of trade" is equal to the ratio of the unit value export index to the unit value import index.
Β
DEVELOPMENT OF INDICES OF EUROPEAN UNION TRADE
SITC Rev. 3
1990=100
Volume
ExtraEU Imports
ExtraEU Exports
1989 1990 1991 1992 1993
Unit Value
110ExtraEU Imports
ExtraEU Exports
Exports / Imports
125120
115
110
105
100
95 90
85 80 1!
¡r\
^y
^
ƒ V
A
\ /
f \/
\ yV,
U-J
wA
■' "~"v ' ..·—\„
■ir ^ ' Z
I
-ƒ,...
Terms of tradeVolume ratios
1990 1991 1992 1993
Ξ
TRENDS IN WORLD TRADE
TRADE BALANCE
Values in Mio ECU Period
1988 1989 1990 1991 1992
1992
1993 Nov
Dec
Jan
Feb
Mar
Apr
May
Jun
Jul
Aug
Sep
Oct
Nov
World (1) EU
-24 836 -34 632 -46319 -69 330 -52019
-3 071 386
-5 091 -3 952 -2 846 -2 028 -116 1389
2159 -2 498 -790 3 078 1630
EFTA
-6 059 -7 621 -3 467 386
6 418
766
13
1581 850
583
834
1681 1242
1720
11
382
1735 1016
United States
-102 240 -117 424 -97 908 -70 522 -81786
-8 509 -7422
-6 569 -6169 -9012 -8 676 -6 849 -11553
-12 678 -11965 -12 557 -12 279 -12 911
Japan
65 594 58 387 40 958 62 775 82143
6 039 9 038
4 320 9127 11427 8 584 6 447 8 373
10 397 6 611 10 631 9 392 6 571
Canada Hong Kong
VALUES
-1343 -8107 -3 364 -5 075 -2 980
-153 197
447
-359 -696 -667 -114 -165
-673 -889 -811 -764 -1098
-606 876
-263 -1368 -3 018
-154 -447
40
-490 -663 -871 -600 -415
-93
-57
278
311
-112 China
-6 502 -6174
8 952 6 529 2 875
722
-1631
126
-548 -572 -491 -1070 -357
-997 -975 -616 -503 -528
South Korea
7 334 260
-3 646 -9 415 -5 096
183
-308
-1064 -697 -792 -925 -587 -813
-857
83
253
-365 -130
Switzer land
-4 779 -6 067 -4 626 -4 023 -34
293
-61
331
221
-10
2
337
192
174
-76
-21
518
430
Sweden
3 518 2 403 2 252 4 332 4 736
361
339
497
542
478
543
527
555
1 144 -43
230
444
328 Singa
pore
-3 848 -4 470 -6441 -5 707 -13 899
-1595 -1794
-2 225 6195 -2 405 -2118 -2 150 -2 398
-2 700 -2 238 -2428 -2 517 -1845
Australia
-3 312 -7 239 -3 209 -610 -1758
-290
77
-19
-109 -630 -275 -88
-323
-292 -601 -232 -244 -562
Ξ
TRENDS IN WORLD TRADE
IMPORTS
Values in Mio ECU
Period
1988
1989
1990
1991
1992
1992
1993
1988
1989
1990
1991
1992 Nov
Dec
Jan
Feb
Mar
Apr
May
Jun
Jul
Aug
Sep
Oct
Nov
World (1)
1919 012
2 239 479
2134 607
2 132 848
2178 666
100.0
100.0
100.0
100.0
100.0 EU
387 724
448 015
461 823
492 660
487 674
39 659
40 495
36486
39 506
43 622
41020
37 891
41 142
39 900
37 900
41262
41 103
42 491
20.2
20.0
21.6
23.1
22.4 EFTA
156 088
177 642
180 586
174 325
167 974
14 421
13 709
11256
13 055
15 277
14 154
12 642
14 203
12 688
12 826
15 037
14 674
15 020
United States
373183
447 475
406 469
410 717
426 393
38 814
38 512
36102
36 798
44 642
40 842
39 521
44 150
43 876
44 422
44 819
47 718
47 722 Japan
158 441
191 374
184413
191 046
179 511
15 776
15 885
15 591
15 104
18196
17118
15 789
17 363
17 910
17 977
17 647
17 567
18 605
Canada Hong Kong
VALUES
99188
117 095
102 677
106 888
105 781
9 212
8 628
8369
9627
11761
10 705
10388
11 192
9 775
10 825
10 747
11362
11779
54 039
65 486
64 793
80 921
95 086
8 881
9 406
6 753
9 061
9 529
9 922
9 645
9 742
11 178
10 590
10 087
10 400
10 601 China
46 810
52 930
41475
51 547
63 084
6163
10 770
2644
5 474
6431
6142
6 997
6 226
7 696
7 714
8115
7 421
8 452 South Korea
43 817
54 649
54 866
67 799
62 711
5 004
5 505
5 563
5 324
6144
5 093
4 622
6392
6766
5 594
5 668
6 082
6187
Switzer land
47 684
52 858
54 732
53 677
50 630
4 253
4 064
3 455
4 084
4 716
4 461
3 868
4 672
4 256
3 738
4 701
4 562
4 518
Sweden
38 749
44 426
42 857
40180
38 418
3148
2 897
2 597
2 757
3 334
2 974
2 849
3149
2167
3 007
3 593
3 420
3 374
PERCENTAGE SHARE OF WORLD TRADE (EXCLUDING INTRA-EU)
8.1
7.9
8.5
8.2
7.7
19.4
20.0
19.0
19.3
19.6
8.3
8.5
8.6
9.0
8.2
5.2
5.2
4.8
5.0
4.9
2.8
2.9
3.0
3.8
4.4
2.4
2.4
1.9
2.4
2.9
2.3
2.4
2.6
3.2
2.9
2.5
2.4
2.6
2.5
2.3
2.0
2.0
2.0
1.9
1.8 Singa
pore
37 099
45104
47 874
53 472
58 554
5 108
5 494
5 695
5 560
6 393
5840
5 869
6368
6 930
6 435
6 734
6 925
6 287
1.9
2.0
2.2
2.5
2.7
Australia
31009
40 876
33 813
34 402
34 531
3 206
2 985
2 623
2 810
3 681
3 087
3 041
3 247
3 522
3 722
3 272
3 527
3 830
1.6
1.8
1.6
1.6
1.6