^¿L
eurostat
Theme 2
Economy and finance Series Β
Shortterm trends
ISSN 10110844
ECUEMS information
9 D 1992
Monthly
European Council confirms adherence to the EMS
In his closing speech at the extraordinary meeting of the Council in Birmingham on 16 October 1992, the President of the European Council confirmed the Council's support of the EMS as a key factor in the economic stability and prosperity of Europe. However, the European Council (also) shares the opinion of the Ministers for Economic Affairs and Finance that the recent turbulence on the financial markets should be analysed in the light of developments on the capital markets and in the context of the European and international monetary systems.
In his statement before the European Parliament on 28 October, the VicePresident of the European Commission said that the currency turbulence last September was due to a combination of factors: (a) global currency problems combined with speculation on the capital markets, (b) finance problems in certain countries (the serious financial problems of the Italian state, the cost of German unification, etc.), (c) psychological factors (in particular the debate in the United Kingdom over its participation in the EMS during the recession). As the VicePresident of the Commission stressed, these problems would have been easier to solve (or would not have arisen in this form) if the Community had already been in phase 2 of EMU, since the monetary system would then have functioned better with the increase in surveillance.
The ratification of the Maastricht Treaty continues to make progress. Belgium is now the seventh country to have ratified the Treaty after Luxembourg, Greece, Ireland, France, Italy and Spain, although in some countries the formal process of ratification is not yet quite complete.
While the general political conditions for the EMS are being established in a basically positive manner, the ecu bond market has also revived. The Bank of France has announced that it will be making OATs (tangible Treasury bonds) to the value of ECU 700 million available on the market on the basis of repo arrangements from 2 November. These bonds are held by the Fonds de Soutien des Rentes (bond support fund) and are used to improve the liquidity of the secondary market. Even the Bank of England, which had cancelled its issue of ecu treasury bills in October owing to lack of interest, has announced that it will be putting treasury bills to the value of ECU 1 billion on the market in midNovember.
eurostat
OFICINA ESTADÍSTICA DE LAS COMUNIDADES EUROPEAS DE EUROPÆISKE FÆLLESSKA8ERS STATISTISKE KONTOR STATISTISCHES AMT DER EUROPÄISCHEN GEMEINSCHAFTEN ΣΤΑΤΙΣΤΙΚΗ ΥΠΗΡΕΣΙΑ ΤΩΝ ΕΥΡΩΠΑΪΚΩΝ ΚΟΙΝΟΤΗΤΩΝ STATISTICAL OFFICE OF THE EUROPEAN COMMUNITIES
OFFICE STATISTIQUE DES COMMUNAUTÉS EUROPÉENNES
ISTITUTO STATISTICO DELLE COMUNITÀ EUROPEE
BUREAU VOOR DE STATISTIEK DER EUROPESE GEMEENSCHAPPEN SERVIÇO DE ESTATÍSTICA DAS COMUNIDADES EUROPEIAS
L2920 Luxembourg Tél. 43011 Télex: Comeur Lu 3423
B1049 Bruxelles, bâtiment Berlaymont, rue de la Loi 200 (bureau de liaison) Tél. 2351111
Note
For any
TEL:
FAX:
information on 1
430132022
430133288
430134150
he statistics in this bulletin
D.
G.
GLATZEL
THOUVENIN
contact Luxe ι η bourg:
Contents
I.
A graph of the bilateral fluctuations of the ERM currencies.
II.
Yearly and monthly issues of ecu bonds.
III. EMCF rate, interest rates on ecu deposits and yields on ecu bonds.
IV. Last month's ecu bond issues.
V. Consumer price indices in national currencies.
VI. Consumer price indices in ecus.
VII. Yearly, monthly and daily ecu exchange rates.
ECSCEECEAEC, Brussels · Luxembourg, 1992
Reproduction is authorized, except for commercial purposes, provided the source is acknowledged.
TABLE I
BILATERAL FLUCTUATIONS OF THE ERM CURRENCIES
2.7
-T-August
September
CENTRAL RATES AND INTERVENTION LIMIT RATES, IN FORCE SINCE 23 NOVEMBER1992,
FOR THE CURRENCIES OF COUNTRIES PARTICIPATING IN THE EMS EXCHANGE MECHANISM.
100
100
100
100
100
1
100
1000 1
BLF
DKF
DM
PTA
FF
IRL
HFL
ESC ECL
+
= ...
-+
-+
= ...
-+
= ...
-+
= ...
-+-+
= ...
-+
= ...
-=
BLF
100 553.000 540.723 528.700 2109.50 2062.55 2016.55 30.0880 28.3364 26.6875 628.970 614.977 601.295 56.5115 55.2545 54.0250 1872.15 1830.54 1789.85 236.785 223.006 210.025 40.6304
DKR
18.9143 18.4938 18.0831
100 390.160 381.443 373.000 5.56450 5.24047 4.93540 116.320 113.732 111.200 10.4511 10.2186 9.9913 346.240 338.537 331.020 43.7910 41.2423 38.8420 7.5141
DM 4.95900 4.84837 4.74000 26.8100 26.2162 25.6300
100 1.45900 1.37386 1.29400 30.4950 29.8164 29.1500 2.74000 2.67894 2.61900 90.7700 88.7526 86.7800 11.4800 10.8122 10.1800 1.96992
PTA
374.710 352.903 332.360 2026.20 1908.23 1797.10 7728.00 7278.77 6854.00
100 2304.40 2170.27 2043.90 207.045 194.994 183.645 6859.20 6460.05 6084.00 835.630 786.999 741.180 143.383
FF
16.6310 16.2608 15.8990 89.9250 87.9257 85.9700 343.050 335.386 327.920 4.89260 4.60772 4.33960
100 9.18900 8.98480 8.78500 304.440 297.661 291.040 38.5030 36.2626 34.1520 6.60683
IRL
1.85100 1.80981 1.76950 10.00870 9.78604 9.56830 38.1825 37.3281 36.4964 0.544528 0.512835 0.482988 11.3830 11.1299 10.8825
1 33.8868 33.1293 32.3939 4.28541 4.03599 3.80110 0.735334
HFL
5.58700 5.46286 5.34150 30.2100 29.5389 28.8825 115.2350 112.6730 110.1675 1.64365 1.54798 1.45789 34.3600 33.5953 32.8475 3.08700 3.01848 2.95100
100 12.9350 12.1825 11.4740 2.21958
ESC
476.130 448.418 422.320 2574.50 2424.69 2283.60 9823.20 9248.80 8710.80 134.920 127.065 119.670 2928.10 2757.66 2597.20 263.082 247.770 233.350 8715.40 8208.49 7731.00 1000 182.194
TABLE II
ECU BOND ISSUES (Mio ECU)
1986 1987
1988 1989 1990 1991
1990
1991
1992
June July
IV
I II
III IV
I II
August
T O T A L
6 840 7 236 9 248 11 127 15 040 26 379
4 850
11 795 5 556 3 940 5 088
11 665 7 0 1 0 2 305 850 0
European Community
Total
4 226 4 303 5 335 6 461 10 525 18 301
3 625
9 760 4 656 1 950 1 935
6 740 3 795 430 700 0
Business sector
2 358 2 058 3 390 4 400 3 990 7 056
1 125
1 100 2 906 1 115 1 935
3 400 1 645
430 150 0
Govern ments
558 900 100 500 5 000 7 650
2 500
6 250 1 400
0 0
1 625 1 750 0 0 0
Insti tutions
1 310 1 345 1 845 1 561 1 535 3 595
0
2 4 1 0 350 835 0
1 715 400
0 550 0
NonEuropean Community
Total
2 6 1 4 2 933 3 9 1 3 4 666 4 5 1 5 8 078
1 225
2 035 900 1 990 3 153
4 925 3 215 1 875
150 0
Business sector
2 204 2 180 3 138 4 141 3 565 4 478
975
1 535 800 990 1 153
■ 2 075 2 465 1 875
100 0
Govern ments
350 453 575 425 550 2 500
250
500 0 1 000 1 000
1 650 150
0 0 0
Insti tutions
60 300 200 100 400 1 100
0
0 100 0 1 000
1 200 600
0 50 0
Q Recording based on the payment date
TABLE III
OPERATIONS RATES OF THE EMCF (CALCULATION MONTH) AND INTEREST RATES AND YIELDS OF ECU INVESTMENTS (%)
1988 1989 1990 1991
1991 August September October November December 1992
January February March April May June July August
EMCF Deposits
1 month
6.71 6.67
9.25 9.10
10.52 10.07
10.06 9.73
10.00 9.70
9.75 9.64
9.75 9.64
10.00 9.69
10.25 9.69
10.25 10.31
10.25 10.11
10.25 9.98
10.25 9.73
10.25 10.04
10.25 10.25
10.50 10.61
10.50 10.83
3 months
6.88 9.30 10.32 9.80
9.84 9.76 9.66 9.75 9.88
10.26 10.11 10.08 9.94 10.04 10.34 10.63 10.86
6 months
7.05 9.41 10.55 9.84
9.94 9.88 9.67 9.81 9.88
10.15 10.09 10.11 10.00 10.06 10.31 10.63 10.84
1 year
7.18 9.49 10.69 9.83
9.92 9.91 9.72 9.78 9.88
9.95 9.92 10.02 10.00 9 9 9 10.23 10.53 10.77
Bonds
< 5 years
7.70 8.86 10.83 9.73
9.77 9.82 9.56 9.40 9.51
9.30 9.32 9.52 9.62 9.36 9.57 9.82 10.30
57 years
7.89 8.70 10.42 9.19
9.24 9.23 9.03 8.99 9.10
8.74 9.65 8.71 8.86 8.76 9.00 9.39 9.80
> 7 years
8.18 8.76 10.37 9.15
9.21 9.18 8.95 8.87 8.95
TABLE IV
LAST MONTH'S ECU BOND ISSUES
issue Payment
Date
Borrower (country)
Issued (Mio Ecu)
Issue Price
Coupon Term (years)
Maturity Yields
%
Lead Manager
TABLE V
CONSUMER PRICE INDICES IN NATIONAL CURRENCY
1985=100 B DK D ELL E F IRL I L NL Ρ UK
EUR 12 ERM 1980 71.2 68.3 82.6 39.1 56.2 63.3 56.1 52.5 70.3 81.8 35.2 70.7 65.3 66.7
1990 1986
111.0 101.3
121.2 103.6
107.0 99.9
222.6 123.0
136.8 108.8
116.3 102.7
117.6 103.8
131.8 105.8
109.0 100.3
104.3 100.2
170.9 111.7
133.3 103.4
123.0 103.5
116.9 102.3 1987 102.9 107.8 100.1 143.2 114.5 105.9 107.1 110.9 100.2 99.8 122.2 107.7 106.9 104.7 1988 104.1 112.7 101.4 162.5 120.0 108.7 109.4 116.5 101.7 100.6 133.9 113.0 110.7 107.6 1989 107.3 118.1 104.2 184.9 128.2 112.7 113.9 123.7 105.1 101.7 150.8 121.8 116.4 111.9 1990 111.0 121.2 107.0 222.6 136.8 116.3 117.6 131.8 109.0 104.3 170.9 133.3 123.0 116.9
1991 1991 01
114.6 116.0
124.1 125.1
110.7 113.1
264.7 290.4
145.0 150.6
120.0 121.9
121.3 122.9
140.2 144.8
112.4 114.5
108.4 110.3
189.5 197.3
141.1 143.3
129.1 132.2
122.4 125.6 02 116.4 125.7 113.8 291.2 151.6 122.2 124.0 145.2 114.5 110.7 199.9 144.1 132.8 126.1 03 116.4 126.2 114.2 297.1 152.2 122.5 124.0 145.8 115.0 111.4 201.6 144.5 132.2 126.4 1992 04 116.5 126.4 114.5 301.6 152.1 122.8 124.0 146.3 115.1 111.9 204.8 146.7 134.0 126.4 05 117.0 127.3 115.0 301.6 152.5 123.2 124.9 147.0 115.7 112.0 206.9 147.3 134.5 126.0 06 117.3 127.3 115.2 306.7 152.5 123.3 124.9 147.4 115.9 111.8 207.7 147.3 134.7 126.8 07 117.9 126.7 115.2 301.0 153.0 123.6 124.9 147.7 116.2 112.4 208.7 146.7 134.7 126.8
Annual rate of increase (%)
Β DK D ELL E F IRL I L N L Ρ UK
EUR 12 ERM
EUR 12 ERM
EUR 12 ERM 71-80 7.4 9.8 5.1 14.5 15.4 9.7 13.7 14.1 6.7 7.4 18.7 13.8 9.9 8.4 3.5 3.0 4.8 3.3
81-90 1986
4.6 1.3
5.9 3.6
2.6 -0.2
19.0 23.1
9.3 8.8
6.3 2.7
7.8 3.8
9.7 5.8
4.5 0.3
2.5 0.3
17.3 11.7
6.6 3.4
6.6 3.2
5.4 2.2
2.4 2.8
2.5 1.8
4.1 3.9
2.9 2.5 1987 1.6 4.0 0.2 16.1 5.3 3.1 3.1 4.8 -0.1 -0.2 9.4 4.1 3.4 2.4 1.9 1.8 3.8 2.8 1988 1.2 4.6 1.2 13.5 4.8 2.7 2.1 5.1 1.4 0.9 9.6 4.9 3.6 2.7 1.8 1.4 Disp 2.8 1.9 1989 3.1 4.8 2.8 13.8 6.8 3.7 4.1 6.2 3.3 1.1 12.6 7.8 5.1 4.0 Avéra 2.2 1.4 arity bet 4.1 2.9 1990 3.4 2.6 2.7 20.4 6.7 3.2 3.2 6.5 3.7 2.5 13.3 9.4 5.7 4.5
ge dévié
2.7
1.8
ween th
3.5
2.3
1991 1991 01
3.2 2.3
2.4 2.1
3.5 4.0
18.9 18.1
6.0 5.9
3.2 2.9
3.1 3.6
6.4 6.3
0.1 2.9
3.9 4.1
10.9 8.6
5.9 4.1
5.0 4.7
4.7 4.4
ition around the mea
1.8 1.5
1.4 1.1
3 average and the m
2.7 2.6
TABLE VI
CONSUMER PRICE INDICES IN ECU
1985=100 Β DK D ELL E F IRL I L NL Ρ UK EUR 12 ERM ECU 1980 30.9 28.0 30.0 34.9 24.5 30.3 25.9 32.2 32.5 27.1 28.3 27.1 29.5 30.3 29.9
1990 1986
117.5 103.9 123.7 104.7 116.1 104.5 114.9 93.1 136.4 102.0 114.3 102.4 109.3 101.1 125.2 104.7 115.4 102.9 113.2 104.8 122.6 98.8 110.0 91.0 117.8 101.3 119.0 104.0 117.0 102.1 1987 107.3 109.7 107.6 95.3 103.9 103.8 98.5 107.2 104.6 107.3 97.7 90.0 103.1 106.5 104.3 1988 107.6 113.7 108.8 100.9 112.5 105.0 100.6 109.6 105.2 108.2 102.3 100.2 106.8 108.0 106.9 1989 111.1 117.7 112.1 107.5 126.8 108.9 104.4 118.5 108.8 109.4 112.9 106.6 112.5 112.9 111.3 1990 117.5 123.7 116.1 114.9 136.4 114.3 109.3 125.2 115.4 113.2 122.6 110.0 117.8 119.0 117.0
1991 1992
01 121.9 124.0 125.8 126.7 120.2 123.4 122.2 128.4 145.5 150.3 116.9 119.1 112.7 114.7 132.2 136.2 119.6 122.4 117.8 120.6 138.4 145.1 118.5 118.2 123.3 125.9 123.2 125.7 122.0 124.5 02 124.2 127.2 123.9 128.3 152.2 119.3 115.4 136.5 122.2 120.8 147.6 119.4 126.5 126.3 125.1 03 124.3 127.6 124.4 130.8 152.2 120.0 115.8 137.0 122.8 121.6 148.9 119.2 126.9 126.7 125.5 04 124.2 127.7 124.5 131.1 152.1 120.5 115.8 137.2 122.7 121.9 152.0 122.2 127.7 127.4 126.1 05 124.2 128.6 124.6 129.0 153.0 121.2 115.9 137.5 122.9 121.6 157.1 123.8 128.3 128.0 126.6 06 124.8 129.2 125.0 128.3 152.4 121.3 116.3 137.5 123.3 121.5 158.3 123.3 128.3 128.1 126.7 07 125.8 129.2 125.6 125.0 151.7 121.9 116.9 137.9 124.0 122.5 156.8 121.0 128.2 128.0 128.1
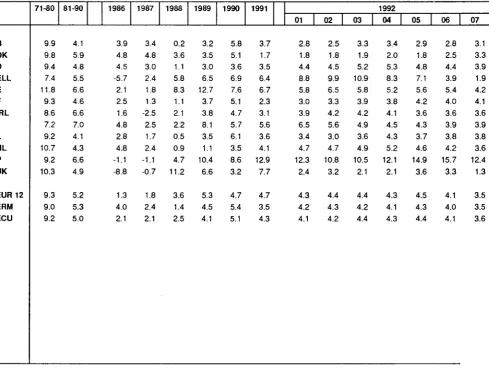
Annual rate of increase (%)
Β DK D ELL E F IRL I L NL Ρ UK EUR 12 ERM ECU 71-80 9.9 9.8 9.4 7.4 11.8 9.3 8.6 7.2 9.2 10.7 9.2 10.3 9.3 9.0 9.2
81-90 1986
4.1 3.9 5.9 4.8 4.8 4.5 5.5 -5.7 6.6 2.1 4.6 2.5 6.6 1.6 7.0 4.8 4.1 2.8 4.3 4.8 6.6 -1.1 4.9 -8.8 5.2 1.3 5.3 4.0 5.0 2.1
1987 3.4 4.8 3.0 2.4 1.8 1 3 -2.5 2.5 1.7 2.4 -1.1 -0.7 1.8 2.4 2.1 1988 0.2 3.6 1.1 5.8 8.3 1.1 2.1 2.2 0.5 0.9 4.7 11.2 3.6 1.4 2.5 1989 3.2 3.5 3.0 6.5 12.7 3.7 3.8 8.1 3.5 1.1 10.4 6.6 5.3 4.5 4.1 1990 5.8 5.1 3.6 6.9 7.6 5.1 4.7 5.7 6.1 3.5 8.6 3.2 4.7 5.4 5.1
1991 1992
01 3.7 2.8 1.7 1.8 3.5 4.4 6.4 8.8 6.7 5.8 2.3 3.0 3.1 3.9 5.6 6.5 3.6 3.4 4.1 4.7 12.9 12.3 7.7 2.4 4.7 4.3 3.5 4.2 4.3 4.1
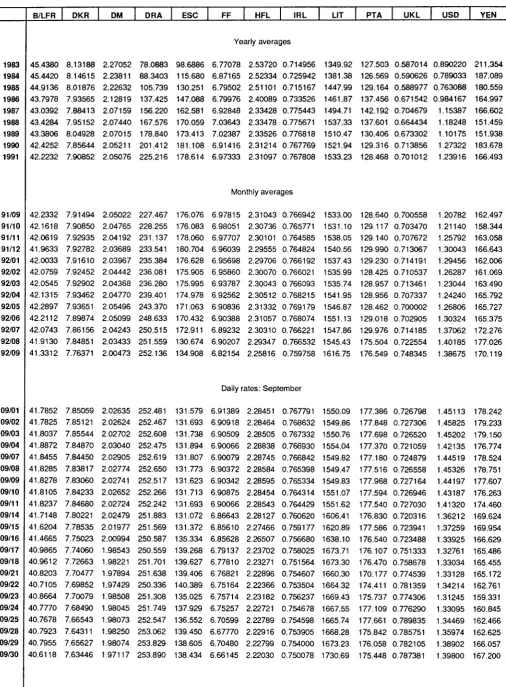
TABLE VII
ECU EXCHANGE RATES
1983 1984 1985 1986 1987 1988 1989 1990 1991 91/09 91/10 91/11 91/12 92/01 92/02 92/03 92/04 92/05 92/06 92/07 92/08 92/09 B/LFR 45.4380 45.4420 44.9136 43.7978 43.0392 43.4284 43.3806 42.4252 42.2232 42.2332 42.1618 42.0619 41.9633 42.0033 42.0759 42.0545 42.1315 42.2897 42.2112 42.0743 41.9130 41.3312 DKR 8.13188 8.14615 8.01876 7.93565 7.88413 7.95152 8.04928 7.85644 7.90852 7.91494 7.90850 7.92935 7.92782 7.91610 7.92452 7.92902 7.93462 7.93651 7.89874 7.86156 7.84851 7.76371 DM 2.27052 2.23811 2.22632 2.12819 2.07159 2.07440 2.07015 2.05211 2.05076 2.05022 2.04765 2.04192 2.03689 2.03967 2.04442 2.04368 2.04770 2.05496 2.05099 2.04243 2.03433 2.00473 DRA 78.0883 88.3403 105.739 137.425 156.220 167.576 178.840 201.412 225.216 227.467 228.255 231.137 233.541 235.384 236.081 236.280 239.401 243.370 248.633 250.515 251.559 252.136 ESC 98.6886 115.680 130.251 147.088 162.581 170.059 173.413 181.108 178.614 176.076 176.083 178.060 180.704 176.628 175.905 175.995 174.978 171.063 170.432 172.911 130.674 134.908
FF HFL IRL
Yearly averages 6.77078 6.87165 6.79502 6.79976 6.92848 7.03643 7.02387 6.91416 6.97333 2.53720 2.52334 2.51101 2.40089 2.33428 2.33478 2.33526 2.31214 2.31097 0.714956 0.725942 0.715167 0.733526 0.775443 0.775671 0.776818 0.767769 0.767808 Monthly averages 6.97815 6.98051 6.97707 6.96039 6.95698 6.95860 6.93787 6.92562 6.90836 6.90388 6.89232 6.90207 6.82154 2.31043 2.30736 2.30101 2.29555 2.29706 2.30070 2.30043 2.30512 2.31332 2.31057 2.30310 2.29347 2.25816 0.766942 0.765771 0.764585 0.764824 0.766192 0.766021 0.766093 0.768215 0.769179 0.768074 0.766221 0.766532 0.759758 LIT 1349.92 1381.38 1447.99 1461.87 1494.71 1537.33 1510.47 1521.94 1533.23 1533.00 1531.10 1538.05 1540.56 1537.43 1535.99 1535.74 1541.95 1546.87 1551.13 1547.86 1545.43 1616.75 PTA 127.503 126.569 129.164 137.456 142.192 137.601 130.406 129.316 128.468 128.640 129.117 129.140 129.990 129.230 128.425 128.957 128.956 128.462 129.018 129.976 175.504 176.549 UKL 0.587014 0.590626 0.588977 0.671542 0.704679 0.664434 0.673302 0.713856 0.701012 0.700558 0.703470 0.707672 0.713067 0.714191 0.710537 0.713461 0.707337 0.700002 0.702905 0.714185 0.722554 0.748345 USD 0.890220 0.789033 0.763088 0.984167 1.15387 1.18248 1.10175 1.27322 1.23916 1.20782 1.21140 1.25792 1.30043 1.29456 1.26287 1.23044 1.24240 1.26806 1.30324 1.37062 1.40185 1.38675 YEN 211.354 187.089 180.559 164.997 166.602 151.459 151.938 183.678 166.493 162.497 158.344 163.058 166.643 162.006 161.069 163.490 165.792 165.727 165.375 172.276 177.026 170.119
Daily rates: September
EXPLANATORY NOTES
Bilateral currency deviation (graph on page 3).
The various curves should be compared in pairs. To find the differential between two currencies, subtract the (positive or negative) values along the y-axis corresponding to each currency.
The graph is drawn with the curve of the strongest currency above that of the weakest. It shows therefore the relative position of each currency vis-à-vis the other currencies.
When two curves intersect or merge over a period of time there is no differential between the two currencies and their market exchange rate equals their bilateral central rate.
The graph is drawn within a horizontal band corresponding to the maximum 2,25% margin of fluctuation applying at any given moment to market exchange rates and the bilateral central rates of the ERM currencies, with the exception of the peseta, Sterling and escudo, currencies which have a maximum authorized fluctuation of 6%. This band is divided symmetrically by a horizontal axis along which the points would be plotted if ail currencies were at their bilateral central rate and there were therefore no fluctuations.
The daily market exchange rates of all currencies are compared with the relevant bilateral central rates and the differentials between the two calculated.
The maximum fluctuation between two currencies (with the exception of the peseta, Sterling and escudo) is shown within the band, symmetrical with the horizontal axis. The fluctuations of the other currencies in relation to either of the two currencies in question are shown within the maximum permissible fluctuation. The curves are drawn by linking the daily points showing the relative positions of each currency.
Exchange rate grid (Table I).
The intervention limit rates fixed in the official grid do not always correspond exactly to + or - 2.25% (+ or - 6% for the peseta, Sterling and escudo) of the central rates, since for each currency pair (whose exchange rates are inversely proportional to one another) the lower limit of the one corresponds to the upper limit of the other.
Ecu bond issues (Table II & IV).
In table II, issues are recorded as at the payment date. This bulletin only covers international and foreign issues in ecus, including ecu issues offering the option of conversion into other currencies. Main source: International Financing Review
Table II shows, under the headings:
-Business sector and Governments: national issuers, both private and public.
-Institutions: the European Investment Bank and the Commission of the European Communities (EEC, ECSC, Euratom).
-Organizations: the specialist institutions of the United Nations, the World Bank, the Council of Europe, etc
Table IV shows detailled information of the latest known issues, whatever the payment date.
Interest rates and yields on ecu Investments (Table III).
The interest rates for 1, 3 and 6 month and 1 year deposits are calculated on the basis of the Friday London market rates (source: Financial Times, London Money Rates, ECU Linked Deposit Bid).
The bonds are classified according to three types of maturities: under 5 years, from 5 to 7 years and more than 7 years. The redemption yields of ecu bonds are calculated each Wednesday from a sample of fixed interest bonds, denominated in ecus and listed on the Luxembourg Stock Exchange. These yields are weighted by the amounts in circulation, (source: Luxembourg Stock Exchange).
The monthly and yearly averages are the arithmetic means of these weekly interest rates and bond yields.
Operations rates of the EMCF (Table III).
The interest rate for transactions in EMCF (European Monetary Cooperation Fund) ecus, is the weighted average of the most representative rates on the domestic money market of the countries whose currencies make up the ecu basket. It is based on the weighting of the currencies in the ecu basket as derived from the ecu central rates in force. The rate thus calculated for a given month applies to EMCF transactions for the following month. In table 3, this rate relates to the month upon which the calculations are based and not to the (following) month during which it is used by the EMCF.
Consumer price indices in national currency (Table V).
The consumer price indices in the national currency of each country measure changes in the purchasing power of one unit of national currency spent in the country concerned.
Two composite indices are calculated, covering all the Member States of the Community (EUR 12) and the eleven Member States with currencies participating in the European Monetary System exchange rate mechanism (ERM). (Although the peseta has been participating in the exchange rate mechanism since 19/06/89 and has been included in the calculation of the ecu since 21/09/89, it is only taken into account in the indices relating to the ERM which are included in this bulletin for data after 30/09/89.)
These indices are calculated as weighted arithmetic means (chain indices) of the national indices, the weighting for each Member State being its relative share in the final consumption of households of the group of countries in question (EUR 12, ERM), expressed in purchasing power standards, at current prices and purchasing power parities.
Consumer price indices in ecus (Table VI).
For each country the index of consumer prices in ecus is calculated by dividing the national consumer price index by the average movement of the national currency in relation to the ecu during the month. It measures the change in the purchasing power of one ecu in the country concerned.
Three composite indices are calculated, covering all the Member States of the Community (EUR 12 and ECU), the 11 Member States participating in the European Monetary System exchange rate mechanism (ERM). (Although the peseta has been participating in the exchange rate mechanism since 19/06/89 and has been included in the calculation of the ecu since 21/09/89, it is only taken into account in the indices relating to the ERM which are included in this bulletin for data after 30/09/89.)
These three indices are calculated as weighted arithmetic means (chain-indices). The weightings are defined as follows: for the EUR 12 and ERM indices, the relative share of each Member State in the final consumption of households for the group of countries in question (EUR 12 or ERM), expressed in ecus at current prices and exchange rates (annual weighting). For the ecu index, the relative share of each Member State's currency in the calculation of the ecu (monthly weighting).
The exchange rates for the ecu against the national currencies of the Member States of the Community, the USD and yen are shown as annual averages, monthly averages (for the current year), and daily rates (for the latest available month).
Ecu exchange rates (Table VII).
1 ecu = Σ
100= Σ
BFR DKR DM D R A * ESC FF HFL IRL LFR LIT PTA
From 21/09/89 the ecu basket has been made up made as follows :
3.301 0.1976 0.6242 1.44 1.393 1.332 0.2198 0.008552 0.13 151.8 6.885
Ecu central rates from 08/10/90
42.4032 7.84195 2.05586 205.311 178.735 6.89509 2.31643 0.767417 42.4032 1538.24 133.631
Weights of currencies on 08/10/90, calculated on the basis of current central rates, expressed in %:
7.78 2.52 30.36 0.70 0.78 19.32 9.49 1.11 0.31 9.87 5.15
UKL
0.08784
0.696904
12.60
' does not participate in the exchange rate mechanism
Venta y suscripciones * Sakj og abonnement · Verkauf und Abonnement · Πωλήσεις και συνδρομές
Sales and subscriptions · Vente et abonnements · Vendita e abbonamenti
Verkoop en abonnementen · Venda e assinaturas
B E L G I Q U E / B E L G I Ë FRANCE UNITED K I N G D O M YUGOSLAVIA M o n i t e u r belge /
Belgisch Staatsblad
Rue d e Louvain 42 / Leuvenseweg 42 1000 Bruxelles / 1000 Brussel Tél. (02) 512 00 26
Fax 511 01 84
CCP / Postrekening 0 0 0 2 0 0 5 5 0 2 2 7 Autres distributeurs /
Overige v e r k o o p p u n t e n Librairie e u r o p é e n n e / Europese Boekhandel Avenue Albert Jonnart 50 / Albert Jonnartlaan 50 1200 B r u x e l l e s / 1200 Brussel Tél. (02) 734 02 81
Fax 735 08 60 J e a n De Lannoy
A v e n u e du Roi 202 / K o n i n g s l a a n 202 1060 Bruxelles / 1060 Brussel Tél. (02) 538 51 69
Télex 63220 U N B O O K Β Fax (02) 538 08 41
CBEDOC
Rue de la M o n t a g n e 34 / Bergstraat 34 Bte 11 / B u s 11
1000 Bruxelles / 1000 Brussel
J. H. Schultz Information A / S EFPubli kationer
Ottiliavej 18 2500 Valby Tlf. 36 44 22 66 Fax 36 44 01 41 Girokonto 6 00 08 86
BR D E U T S C H L A N D Bundesanzeiger Verlag Breite Straße
Postfach 10 80 06 5000 Köln 1
Tel. (02 21) 20 29-0
Telex ANZEIGER B O N N 8 882 595 Fax 20 29 278
GREECE
G.C. Eleftheroudakis SA International B o o k s t o r e Nikis Street 4 10563 Athens Tel. (01) 322 63 23 Telex 219410 ELEF Fax 323 98 21
Boletín Oficial del Estado Trafalgar, 27
28010 M a d r i d Tel. (91) 44 82 135 M u n d i P r e n s a Libros, S.A. Castellò. 37
28001 Madrid
Tel. (91) 431 33 99 (Libros) 431 32 22 (Suscripciones) 435 36 37 (Dirección) Télex 4 9 3 7 0 M P L I E Fax (91) 575 39 98 Sucursal:
Librería Internacional A E D O S Consejo de Ciento, 391 08009 Barcelona Tel. (93) 301 86 15 Fax (93) 317 01 41 Llibreria di. la Generalität d e Catalunya
Rambla deis Estudis, 118 (Palau Moja) 08002 Barcelona
Tel. (93) 302 68 35 302 64 62 Fax (93) 302 12 99
Journal officiel Service des publications des C o m m u n a u t é s e u r o p é e n n e s 26. rue Desaix
75727 Paris Cedex 15 Tél. (1) 40 58 75 00 Fax (1) 40 58 75 74
IRELAND
G o v e r n m e n t Publications Sales Office
Sun Alliance House M o l e s w o r t h Street Dublin 2 Tel. (1) 71 03 09 or by post
Government Stationery Office EEC Section
6th floor Bishop Street Dublin 8 Tel. (1) 78 16 66 Fax (1) 78 06 45
ITALIA Licosa Spa
Via Benedetto Fortini, 120/10 Casella postale 552 50125 Firenze
Tel. (055) 64 54 15
Fax 64 12 57 Telex 570466 LICOSA I CCP 343 509 Subagenti: Libreria scientifica Lucio d e Biasio A E I O U Via Meravigli, 16 20123 Milano Tel. (02) 80 76 79 Herder Editrice e Libreria Piazza Montecitorio, 117120 00186 Roma
Tel. (06) 679 46 28/679 53 04
Libreria giuridica Via XII O t t o b r e , 172/R 16121 Genova Tel. (010) 59 56 93
G R A N D D U C H É DE L U X E M B O U R G M e s s a g e r i e s Paul Kraus 1 1 , rue Christophe Plantin 2339 L u x e m b o u r g Tél. 499 88 88 Télex 2515 Fax 499 88 84 44 C C P 4924263
NEDERLAND
S D U Overheidsinformatie Externe Fondsen Postbus 20014 2500 EA 'sGravenhage Tel. (070) 37 89 911 Fax (070) 34 75 778
PORTUGAL Imprensa Nacional Casa da M o e d a . EP
Rua D. Francisco Manuel de Melo, 5 1092 Lisboa Codex
Tel. (01) 69 34 14
Distribuidora de Livros Bertrand, Ld." Grupo Bertrand, SA Rua das Terras d o s Vales, 4A A p a r t a d o 37
2700 A m a d o r a C o d e x Tel. (01) 49 59 050 Telex 15798 BERDIS Fax 49 60 255
H M S O Books (PC 16) H M S O Publications Centre 51 Nine Elms Lane L o n d o n SW8 5DR Tel. (071) 873 2 0 0 0 Fax GP3 873 8463 Telex 29 71 138
ÖSTERREICH M a n z ' s c h e V e r l a g s
und Universitätsbuchhandlung Kohlmarkt 16
1014 Wien Tel. (0222) 531 61 0 Telex 11 25 00 BOX A Fax (0222) 531 6181
S U O M I
A k a t e e m i n e n Kirjakauppa Keskuskatu 1
PO Box 128 00101 Helsinki Tel. (0) 121 41 Fax (0) 121 44 41
NORGE
Narvesen information center Bertrand Narvesens vei 2 PO Box 6125 Etterstad 0602 Oslo 6
Tel. (2) 57 33 00 Telex 79668 NIC N Fax (2) 68 19 01
SVERIGE B T J Box 200 22100 Lund Tel. (046) 18 00 00 Fax (046) 18 01 25
SCHWEIZ / SUISSE / SVIZZERA O S E C
Stampfenbachstraße 85 8035 Zürich
Tel. (01) 365 54 49 Fax (01) 365 54 11
C E S K O S L O V E N S K O NIS
Havelkova 22 13000 Praha 3 Tel. (02) 235 84 46 Fax 4 2 2 2 6 4 7 7 5
M A G Y A R O R S Z A G Agroinform Budapest I. Kir. Attila ut 93
1012 Budapest Tel. (1) 56 82 11
Telex (22) 4717 AGINF H61
POLAND
Business Foundation ul. Krucza 38/42 00512 Warszawa
Tel. (22) 21 99 93. 6 2 8 2 8 8 2 International hax&Phone
(039) 120077
Privredni Vjesnik Bulevar Lenjina 171/XIV 11070 B e o g r a d Tel. (11) 123 23 40
CYPRUS
Cyprus C h a m b e r of C o m m e r c e a n d Industry
C h a m b e r Building 38 Grivas Dhigenis Ave 3 Deligiorgis Street PO Box 1455 Nicosia
Tel. (2) 449500/462312 Fax (2) 4 5 8 6 3 0
TURKIYE
Pres G a z e t e Kitap Dergi
P a z a r l a m a Dagitim Ticaret ve sanayi A S
Narlibançe Sokak N. 15 IstanbulCagalogiu
Tel. (1) 520 92 96 528 55 66 Fax 520 64 57
Telex 23822 DSVOTR
AUTRES PAYS OTHER COUNTRIES ANDERE LÄNDER
Office des publications officielles d e s C o m m u n a u t é s e u r o p é e n n e s 2, rue Mercier
2985 L u x e m b o u r g Tél. 49 92 81
Télex PUBOF LU 1 324 b Fax 48 85 73
C C bancaire BIL 8 1 0 9 / 6 0 0 3 / 7 0 0
Renouf Publishing C o . Ltd Mail orders — Head Office: 1294 A l g o m a Road Ottawa, Ontario K1B 3 W 8 Tel. (613) 741 43 33 Fax (613) 741 54 39 Telex 0534783 Ottawa Store: 61 Sparks Street Tel. (613) 238 89 85 Toronto Store: 211 Yonge Street Tel. (416) 363 31 71
UNITED STATES OF AMERICA U N I P U B
4611 F Assembly Drive Lanham, M D 207064391 Tel. Toll Free (800) 274 4888 Fax (301) 459 0056
AUSTRALIA Hunter Publications 58A Gipps Street C o l l i n g w o o d Victoria 3066
JAPAN
Kinokuniya C o m p a n y Ltd 177 Shinjuku 3 C h o m e Shinjukuku
Tokyo 160-91 Tel. (03) 3439-0121
Journal D e p a r t m e n t PO Box 55 Chitóse
Tokyo 156
Price (excl. VAT) in Luxembourg: Single copy ECU 9 ■ Subscription ECU 67
. * . OFICINA DE PUBLICACIONES OFICIALES DE LAS COMUNIDADES EUROPEAS I Q Q N " i n i 1 C\RAA ϊ·&η'. KONTORET FOR DE EUROPÆISKE FÆLLESSKABERS OFFICIELLE PUBLIKATIONER l ö ö l N I U I I U O H 4
's~ · AMT FÜR AMTLICHE VERÖFFENTLICHUNGEN DER EUROPÄISCHEN GEMEINSCHAFTEN ΥΠΗΡΕΣΙΑ ΕΠΙΣΗΜΩΝ ΕΚΔΟΣΕΩΝ ΤΩΝ ΕΥΡΩΠΑΪΚΩΝ ΚΟΙΝΟΤΗΤΩΝ
OFFICE FOR OFFICIAL PUBLICATIONS OF THE EUROPEAN COMMUNITIES OFFICE DES PUBLICATIONS OFFICIELLES DES COMMUNAUTÉS EUROPÉENNES UFFICIO DELLE PUBBLICAZIONI UFFICIALI DELLE COMUNITÀ EUROPEE BUREAU VOOR OFFICIËLE PUBLIKATIES DER EUROPESE GEMEENSCHAPPEN SERVIÇO DAS PUBLICAÇÕES OFICIAIS DAS COMUNIDADES EUROPEIAS