eurostat
TH
Basic statistics
Statistiques de base
~3Ά
eurostat
OFICINA ESTADÍSTICA DE LAS COMUNIDADES EUROPEAS
DE EUROPÆISKE FÆLLESSKABERS STATISTISKE KONTOR
STATISTISCHES AMT DER EUROPÄISCHEN GEMEINSCHAFTEN
ΣΤΑΤΙΣΤΙΚΗ ΥΠΗΡΕΣΙΑ TílN ΕΥΡΩΠΑΪΚΩΝ ΚΟΙΝΟΤΗΤΩΝ
STATISTICAL OFFICE OF THE EUROPEAN COMMUNITIES
OFFICE STATISTIQUE DES COMMUNAUTÉS EUROPÉENNES
ISTITUTO STATISTICO DELLE COMUNITÀ EUROPEE
BUREAU VOOR DE STATISTIEK DER EUROPESE GEMEENSCHAPPEN
SERVIÇO DE ESTATÍSTICA DAS COMUNIDADES EUROPEIAS
L2920 Luxembourg — Tél. 4 3011 — Télex: Comeur Lu 3423
B1049 Bruxelles, Bâtiment Berlaymont, Rue de la Loi 200 (Bureau de liaison) Tél. 2351111
Para obtener esta publicación se ruega dirigirse a las oficinas de venta que figuran en la tercera página de cubierta.
Denne publikation kan fås gennem de salgssteder, som er nævnt på omslagets tredje side i dette hætte.
Diese Veröffentlichung ist bei den auf der dritten Umschlagseite aufgeführten Vertriebsbüros erhältlich.
Την έκδοση αυτή μπορείτε να την προμηθευτείτε από τα γραφεία πωλήσεων τα οποία αναφέρονται στην τρίτη σελίδα του εξωφύλλου.
This publication is obtainable from the sales offices mentioned on the inside back cover.
Pour obtenir cette publication, prière de s'adresser aux bureaux de vente dont les adresses sont indiquées à la page 3 de la couverture.
Per ottenere questa pubblicazione, si prega di rivolgersi agli uffici di vendita i cui indirizzi sono indicati nella 3a pagina della copertina.
Deze publikatie is verkrijgbaar bij de verkoopkantoren waarvan de adressen op blz. 3 van het omslag vermeld zijn.
ACP
Basic statistics
Statistiques de base
Cataloguing data can be found at the end of this publication.
Une fiche bibliographique figure à la fin de l'ouvrage.
Luxembourg: Office des publications officielles
des Communautés européennes, 1989
ISBN 92-825-8867-X
Cat. : CA-52-88-889-2A-C
© CECA - CEE - CEEA, Bruxelles * Luxembourg, 1989
Reproduction autorisée, sauf à des fins commerciales, moyennant
mention de la source.
Contents
Table des matières
Introduction
Methodological notes and sources ACP exchange rates: USD 1 = Χ NCU ACP exchange rates: SDR 1 = Χ NCU ACP exchange rates: ECU 1 = X NCU Population and density
Total external public debt Origin of gross domestic product Current balance
PART I THE ACP COUNTRIES IN THE WORLD
Graphs Tables
1. Population 2. GNP per capita
3. Cereals, total 4. Maize 5. Rice, paddy 6. Bananas (fresh) 7. Sugar (centrifugal) 8. Coffee (green) 9. Tea 10. Cocoa beans 11. Groundnuts (in shell) 12. Cotton (lint) 13. Iron ore (Fe content) 14. Copper ore (Cu content) 15. Bauxite
16. Phosphate rock 17. Crude petroleum
7 9 14
16
18
20 22 24 26
31-48 49-71
49 50
51 52 53 54 55 56 57 58 59 60 61 62 63 64 65
Introduction
Notes méthodologiques et sources Taux de conversion des ACP: 1 USD =
X UMN
Taux de conversion des ACP : 1 DTS = X UMN
Taux de conversion des ACP: 1 ECU = X UMN
Population et densité Dette extérieure publique totale Origine du produit intérieur brut Balance courante
PARTIE I LES ACP DANS LE MONDE Graphiques
Tableaux 1. 2.
Population PNB par habitant
Production
3. 4. 5. 6. 7. 8. 9. 10. 11. 12. 13. 14. 15. 16. 17.
Céréales, total Maïs Riz
Bananes fraîches Sucre centrifugé Café vert Thé Fèves de cacao
Arachides non décortiquées Fibres de coton
Minerai de fer (Fe contenu) Minerai de cuivre (Cu contenu) Bauxite
External trade
18. Exports to world 19. Imports from world
20. Imports of European Community 2 1 . Exports of European Community
Assistance
22. Net official development assistance from DAC members
23. Net official development assistance per capita
PART II - PRINCIPAL ECONOMIC AND SOCIAL INDICATORS BY ACP STATE Angola
Antigua & Barbuda Bahamas Barbados Belize Benin Botswana Burkina Faso Burundi Cameroon Cape Verde Comoros Congo Cote d'Ivoire Djibouti Dominica Ethiopia Fiji Gabon Gambia Ghana Grenada Guinea-Bissau Guinea Equatorial Guinea Guyana Jamaica Kenya
Kiribati and Tuvalu Lesotho Liberia
Page
66 67 68 69
70 71
Commerce extérieur
18. Exportations vers monde 19. Importations provenance monde 20. Importations de la Communauté 2 1 . Exportations de la Communauté
Apports d'aide
22. Aide publique au développement net des membres du CAD
23. Aide publique au développement net par habitant
PARTIE II - PRINCIPAUX INDICATEURS ÉCONOMIQUES ET SOCIAUX PAR ÉTAT ACP
75 77 78 79 81 83 85 87 89 91 93 95 96 98 100 101 103 105 107 109 111 113 114
116 118
120 122 124 126 128 129
Angola
Antigua et Barbuda Bahamas Barbade Belize Bénin Botswana Burkina Faso Burundi Cameroun Cap-Vert Comores Congo Côte-d'IvoIre Djibouti Dominique Ethiopie Fidji Gabon Gambie Ghana Grenade Guinée-Bissau Guinée
Madagascar Malawi Mali Mauritius Mauritania Mozambique Niger Nigeria
Papua New Guinea Central African Republic Rwanda
St Kitts & Nevis St Lucia
St Vincent and the Grenadines Sao Tome and Principe Senegal
Seychelles Sierra Leone Solomon Islands Somalia Sudan Suriname Swaziland Tanzania Chad Togo Tonga
Trinidad and Tobago Uganda
Vanuatu Western Samoa Zaire Zambia Zimbabwe PART TIONS TIONS
\ - EDF AND EIB INTERVEN-UNDER THE LOME
CONVEN-Tables
1. Financing situation in 1986 by method of financing and by administrative body — Lomé I
2. Financing situation in 1986 by method of financing and by administrative body — Lomé II
3. 4th EDF: Aid by economic sector and beneficiary country (31.12.1986)
199
200
202 Page 131 133 135 137 139 141 143 145 147 149 151 153 154 156 158 160 162 163 165 167 169 171 173 175 177 179 181 183 185 187 188 190 192 194
Madagascar Malawi Mali Maurice Mauritanie Mozambique Niger Nigeria
Papouasie-Nouvelle-Gujnée République Centrafricaine Rwanda
Saint-Christophe-et-Nevis Sainte-Lucie
Saint-Vincent et Grenadines São Tomé et Principe Sénégal
Seychelles Sierra Leone Salomon Somalie Soudan Surinam Swaziland Tanzanie Tchad Togo Tonga Trinité et Tobago Ouganda Vanuatu
Samoa occidentales Zaïre
Zambie Zimbabwe
PARTIE III - LES INTERVENTIONS DU FED ET DE LA BEI AU TITRE DES CONVENTIONS DE LOMÉ
Tableaux
1. Situation des financements fin 1986 par mode de financement et des orga nismes gestionnaires — Lomé I 2. Situation des financements fin 1986
par mode de financement et des organismes gestionnaires — Lomé II 3. Le 4e FED: aides par secteur écono
4. 5th EDF: Aid by economic sector and beneficiary country (31.12.1986)
5. 5th EDF : Aid by type and beneficiary country
6. The six EDFs: A breakdown of the cumulative payments by beneficiary country (19601986)
7. Stabex: aggregate balance sheet by ACP State
8. Stabex: aggregate balance sheet by product
9. EIB loans (Lomé II) 10. EIB loans (Lomé III) PART IV
MEDITERRANEAN COUNTRIES Tables
Algeria Cyprus Egypt Israel Jordan Lebanon Libya Malta Morocco Syria Tunisia Turkey Yugoslavia
PART V ICP INTERNATIONAL COM PARISON PROJECT
Purchasing power parity
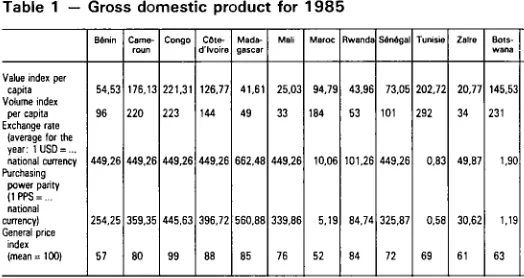
Table 1 — Gross domestic product for 1985
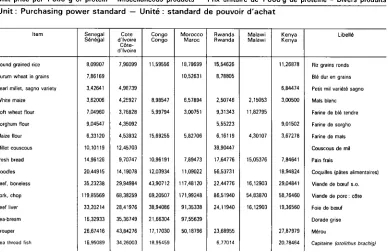
Table 2 — Foodstuffs by product group per head of population for 1985 Food prices and nutritive value in 1985 Table 3 — Unit price per kilocalorie : mis cellaneous products
Table 4 — Unit price per 1 000 g of pro tein: miscellaneous products
Page 204
206
208
210
211
212 214
218 220 221 223 225 227 228 229 230 232 234 236 238
243 244
246
249
250
252
4. Le 5Θ FED: aides par secteur écono mique et par pays bénéficiaire (31.12.1986)
5. Le 5Θ FED: aides par nature et par pays bénéficiaire
6. Les six FED: répartition des paie ments cumulatifs par pays bénéfi ciaire (19601986)
7. Stabex: bilan cumulatif par État ACP
8. Stabex: bilan cumulatif par produit 9. Prêts de la BEI (Lomé II) 10. Prêts de la BEI (Lomé III) PARTIE IV
PAYS MÉDITERRANÉENS Tableaux
Algérie Chypre Egypte Israël Jordanie Liban Libye Malte Maroc Syrie Tunisie Turquie Yougoslavie
PARTIE V PCI PROJET DE COMPA RAISON INTERNATIONAL
Notion de parité de pouvoir d'achat Tableau 1 — Produit intérieur brut: 1985
Tableau 2 — Produits alimentaires par groupe de produits et par habitant 1985 Prix et valeur nutritive des aliments en 1985
Tableau 3 — Prix unitaire de la kilocalo rie : divers produits
Introduction
Introduction
This volume brings together the principal economic indicators of the ACP States for recent years. Most of the statistics have been taken from the developing countries data bank set up by the Statistical Office of the European Communities (Cronos sys tem).
Three kinds of tables can be distin guished:
(i) summary tables presenting the situation of ACP countries in a wider context; (¡i) tables describing the situation in each
country;
(iii) tables related to the application of the agreements between the Community and the ACP countries.
In addition to the 66 countries who have signed the third Lomé Convention, this pub lication also includes the Mediterranean States which are linked to the European Community by special association agree ments.
This publication contains a certain number of results of Phase V (Africa) of the interna tional comparison project which was carried out in 23 African countries. This exercise was coordinated in Africa by the Statistical Office of the European Communities. Results in greater detail are available in the publica tion 'Comparison of price levels and eco nomic aggregates: the results for 23 Afri can countries'.
As for the previous edition, a 'paperback' format was chosen to encourage a wide readership and to give readers rapid acquaintance with the main trends in the ACP countries' economic development and the implementation of a number of the pro visions in the Lomé Convention between the European Communities and the ACP States.
This publication is produced every year.
Cette publication présente une synthèse des principaux indicateurs économiques des États ACP au cours des dernières années. La plupart des statistiques sont reprises de la banque de données des pays en dévelop pement (système Cronos) mise au point par l'Office statistique des Communautés euro péennes.
Trois types de tableaux sont à distinguer: — des tableaux de synthèse permettant de
situer, dans un contexte plus large, la situation des pays ACP,
— des tableaux décrivant la situation de chaque pays,
— des tableaux relatifs à l'application des accords entre la Communauté et les pays ACP.
Outre les 66 pays signataires de la troisième convention de Lomé figurent également, dans cette publication, les États de la Médi terranée qui sont liés à l'Europe communau taire par des accords d'association. Cette publication contient un certain nombre de résultats de la phase V du projet de com paraison internationale pour l'Afrique réalisé dans 23 pays africains. Cette opération a été coordonnée en Afrique par l'Office sta tistique des Communautés européennes. Des résultats plus détaillés sont disponibles dans la publication Comparaison des niveaux de prix et des agrégats économi-ques: le cas de 23 pays africains.
Remarks, comments or suggestions are Cette publication est réalisée annuellement. welcome; the ambition of Eurostat being to
provide a tool adapted to the needs of its L e s remarques, commentaires ou
sugges-u s e r s tions sont les bienvenus, l'ambiton
d'Euros-tat étant, avec cette publication, de mettre à This volume was prepared by Mrs Rosette disposition un instrument adapté aux Sprauer under the direction of Mr D. Byk, besoins de ses utilisateurs.
head of the specialized service 'Analyses
and developments*. C e t t e publication a été préparée par M™
Rosette Sprauer sous la direction de M. Luxembourg, June 1988 Daniel Byk, chef du service spécialisé «ana
Methodological notes and
sources
Notes méthodologiques et
sources
The methodology as well as the detailed sources of the data contained in this publi cation can be provided on request. It may however, be useful to repeat the general principles.
1. Data relating to GNP and per capita GNP were supplied by the World Bank. The per capita GNP growth rate is the true (annual) rate, whereas the GNP growth rate is the annual rate at current prices. GNP is calcu lated in accordance with the World Bank's own particular method : GNP data from countries expressed in local currency are converted into US dollars for the base period 1983-85 by applying an average rate of exchange. For earlier years the data are deflated by the true growth rate of the coun tries' GDP plus the rate of inflation in the USA. Reference to the rate of inflation in the USA enables comparisons to be made between the various countries. The GNP growth rate is therefore an indicator of growth of two kinds: the country's con stant-price GDP and the rate of inflation in the USA rather than the rate of inflation in the country under consideration.
2. External trade statistics were supplied by the United Nations and the ACP States. The nomenclature used is the SITC rev. 1, although the exports/GDP ratio was calcu lated from national accounts data. 3. The financial indicators came from a var iety of sources: balance of payments and international reserves data are from the IMF (BOP and IFS); details of the external public debt were supplied by the World Bank; lastly the ratio of debt service to exports, being a financial indicator, was calculated on the basis of export date extracted from the balance of payments.
La méthodologie ainsi que les sources détaillées des données reprises dans cette publication peuvent être fournies sur demande. Il convient néanmoins d'en rappe ler l'essentiel.
1. Les données concernant le PNB et le PNB/habitant proviennent de la Banque mondiale. Le taux de croissance du PNB/habitant est un taux réel (annuel). Au contraire, le taux de croissance du PNB est un taux courant (annuel). Le PNB est calculé par la Banque mondiale suivant une métho dologie très spécifique à cette institution: les données de PNB des pays exprimées en monnaie nationale sont converties en USD pour la période de base 1983-1985 par application d'une moyenne de taux de change. Pour les années antérieures, ces données sont déflatées de l'indice de crois sance réelle du PIB du pays et du taux d'inflation des USA. L'utilisation du taux d'inflation des USA permet de rendre les dif férents pays comparables entre eux. Le taux de croissance du PNB reflète donc deux croissances: celle du PIB du pays à prix constant et le taux d'inflation des USA et non pas le taux d'inflation du pays consi déré.
2. Les statistiques du commerce extérieur proviennent de l'ONU et des États ACP. La nomenclature utilisée est la CTCI rev. 1. Néanmoins, le ratio exportations/PIB a été calculé à partir des chiffres de la comptabi lité nationale.
3. Les indicateurs financiers ont des sources diverses: pour la balance des paie ments et les réserves internationales, il s'agit du FMI (BOP et IFS). Pour la dette extérieure publique, il s'agit de la Banque mondiale.
dette/expor-For a number of countries there are discre pancies between the changes in interna tional reserves and in the net balance of payments; these are explained by differ ences in the concepts used.
4. Data relating to official development assistance (ODA) were supplied by the Development Assistance Committee (DAC). ODA data cover only the aid flows from the DAC (OECD) and not those from OPEC (Organization of Petroleum Exporting Coun tries). ODA figures are net of loan repay ments.
5. As in last year's edition, figures on food aid are being published. They are derived from data collected by the Development Aid Committee (OECD).
6. In addition, we have added a breakdown of GDP by origin and also an index of GDP price trends. These figures are from the World Bank.
7. Agricultural production data came from the FAO, while data on industrial and mining production were taken from the United Nations' Statistical Yearbook.
8. Details of principal exports are given in millions of US dollars and as a percentage of total exports.
9. Statistics on the European Development Funds (EDFs) and the European Investment Bank (EIB) operations were taken from the report of the ACPEEC Council of Minis ters.
10. In order to complete this data, this edi tion contains the exchange rates of the US dollar, the ECU and the SDR into the national currencies of ACP and Mediterranean coun tries, as well as tables on population and density, total external public debt, origin of gross domestic product, and current bal ance.
tations a été calculé à partir des données d'exportations de la balance des paie ments.
Des différences conceptuelles expliquent que pour certains pays l'on puisse observer des divergences entre l'évolution des réser ves internationales et celle du solde de la balance des paiements.
4. Les donnée d'aide publique au dévelop pement (APD) proviennent du CAD. Les données d'APD nettes ne reprennent pas les flux en provenance de ΓΟΡΕΡ (Organisa tion des pays exportateurs de pétrole), mais seulement ceux en provenance du CAD (Comité d'aide au développement de l'OCDE). Les données d'APD sont nettes des remboursements des prêts. 5. Tout comme l'année dernière, les don nées concernant l'aide alimentaire sont publiées. Elles proviennent de la collecte réalisée par le Comité d'aide au développe ment (OCDE).
6. En plus, nous avons introduit la réparti tion du PIB par origine, ainsi que l'indice d'évolution des prix du PIB. Ces données proviennent de la Banque mondiale. 7. Les données de production proviennent de la FAO pour les produits agricoles et de l'ONU (Statistical Yearbook) pour les pro duits industriels et miniers.
8. Les principales exportations sont indi quées en millions de USD et en pourcentage des exportations totales.
11. The ACP group consists of the signa- 11. Le regroupement ACP comprend les tory States of the Lomé III Convention. pays signataires de Lomé III.
12. The EC data in the summary tables are 12. Les données CE des tableaux de syn-for EUR 12. thèse concernent EUR 12.
Abbreviations: EC GNP GDP BOP IFS IMF EDF FAO ODA DAC SDR EIB siTC OECD OPEC
European Community Gross national product Gross domestic product Balance of payments International financial statistics International Monetary Fund European Development Fund Food and Agriculture Organization of the United Nations
Official development assistance Development Assistance Commit tee
Special drawing rights European Investment Bank Standard international trade classifi cation
Organization for Economic Coopera tion and Development
Organization of Petroleum Exporting Countries
Signifii CE PNB PIB BOP IFS FMI FED FAO APD CAD DTS BEI CTCI OCDE OPEP
Signification des siglos: Communauté européenne produit national brut produit intérieur brut balance des paiements
statistiques internationales et finan cières
Fonds monétaire international Fonds européen de développement Organisation des Nations unies pour l'alimentation et l'agriculture aide publique au développement Comité d'aide au développement droits de tirages spéciaux Banque européenne d'investisse ment
classification tarifaire du commerce international
Organisation de coopération et de développement économiques Organisation des pays exportateurs de pétrole
ACP exchange rates: USD 1 = χ national currency units
Taux de conversion des ACP: 1 USD = χ unités monétaires nationales
ACP
Angola Antigua & Barbuda Bahamas Barbados Belize Benin Botswana Burkina Faso Burundi Cameroon Cape Verde Central African Rep. Chad
Comoros Congo Cote d'Ivoire Djibouti Dominica Equatorial Guinea Ethiopia Fiji Gabon Gambia Ghana Grenada Guinea Guinea-Bissau Guyana Jamaica Kenya Kiribati Lesotho Liberia Madagascar Malawi Mali Mauritania Mauritius Mozambique 1982
2 , 7 0 0 0 1.0000 2 , 0 1 0 0 2 , 0 0 0 0 3 2 8 , 6 0 0 0 1,0300 3 2 8 , 6 0 0 0 9 0 , 0 0 0 0 3 2 8 , 6 0 0 0 5 8 , 2 9 0 0 3 2 8 , 6 0 0 0 3 2 8 , 6 0 0 0 3 2 8 , 6 0 0 0 3 2 8 , 6 0 0 0 3 2 8 , 6 0 0 0 1 7 7 , 7 2 0 0 2 , 7 0 0 0 2 1 9 , 7 2 0 0 2 . 0 7 0 0 0 , 9 3 0 0 3 2 8 , 6 0 0 0 2 , 2 9 0 0 2 , 7 5 0 0 2 , 7 0 0 0 2 2 , 3 7 0 0 3 9 , 8 7 0 0 3 , 0 0 0 0 1,7800 1 0 , 9 2 0 0 0 , 9 9 0 0 1,0900 1,0000 3 4 9 , 7 4 0 0 1,0600 3 2 8 , 6 0 0 0 5 1 , 7 7 0 0 1 0 , 8 7 0 0
1983
2 , 7 0 0 0 1,0000 2 , 0 1 0 0 2 , 0 0 0 0 3 8 1 , 0 6 0 0 1,1000 3 8 1 , 0 6 0 0 9 2 , 9 5 0 0 3 8 1 , 0 6 0 0 7 1 , 6 9 0 0 3 8 1 . 0 6 0 0 3 8 1 , 0 6 0 0 3 8 1 , 0 6 0 0 3 8 1 , 0 6 0 0 3 8 1 , 0 6 0 0 1 7 7 , 7 2 0 0 2 , 7 0 0 0 2 8 6 , 8 6 0 0 2 . 0 7 0 0 1,0200 3 8 1 , 0 6 0 0 2 , 6 4 0 0 8 , 8 3 0 0 2 , 7 0 0 0 2 3 , 0 9 0 0 4 2 , 1 0 0 0 3 , 0 0 0 0 1.9300 1 3 . 3 1 0 0 1,1100 1,1100 1,0000 4 3 0 , 4 5 0 0 1,1700 3 8 1 , 0 6 0 0 5 4 , 8 1 0 0 1 1 , 7 1 0 0
1984
2 , 7 0 0 0 1,0000 2 , 0 1 0 0 2 , 0 0 0 0 4 3 6 , 9 6 0 0 1,3000 4 3 6 , 9 6 0 0 1 1 9 , 7 1 0 0 4 3 6 , 9 6 0 0 8 4 , 8 8 0 0 4 3 6 , 9 6 0 0 4 3 6 , 9 6 0 0 4 3 6 , 9 5 0 0 4 3 6 , 9 6 0 0 4 3 6 , 9 6 0 0 1 7 7 , 7 2 0 0 2 , 7 0 0 0 3 2 1 , 5 2 0 0 2 . 0 7 0 0 1,0800 4 3 6 , 9 6 0 0 3 . 5 8 0 0 3 5 , 9 9 0 0 2 , 7 0 0 0 2 4 , 0 9 0 0 1 0 5 , 2 9 0 0 3 , 8 3 0 0 3 , 9 4 0 0 1 4 , 4 1 0 0 1,1400 1,4700 1,0000 5 7 6 , 6 4 0 0 1,4100 4 3 6 , 9 6 0 0 6 3 , 8 0 0 0 1 3 , 8 0 0 0
1985
2 . 7 0 0 0 1,0000 2 , 0 1 0 0 2 , 0 0 0 0 4 4 9 , 2 6 0 0 1,9000 4 4 9 , 2 6 0 0 1 2 0 , 6 9 0 0 4 4 9 , 2 6 0 0 9 1 , 6 3 0 0 4 4 9 , 2 6 0 0 4 4 9 , 2 6 0 0 4 4 9 , 2 6 0 0 4 4 9 , 2 6 0 0 4 4 9 . 2 6 0 0 1 7 7 , 7 2 0 0 2 , 7 0 0 0 4 4 9 , 2 6 0 0 2 . 0 7 0 0 1,1500 4 4 9 , 2 6 0 0 3 , 8 9 0 0 5 4 , 3 6 0 0 2 , 7 0 0 0 2 4 , 3 3 0 0 1 5 9 , 6 2 0 0 4 , 2 5 0 0 5 , 5 6 0 0 1 6 , 4 3 0 0 1,4300 2 , 2 3 0 0 1,0000 6 6 2 , 4 8 0 0 1,7200 4 4 9 , 2 6 0 0 7 7 , 0 8 0 0 1 5 , 4 4 0 0
1986
2 , 7 0 0 0 1,0000 2 , 0 1 0 0 2 , 0 0 0 0 3 4 6 , 3 0 0 0 1,8800 3 4 6 , 3 0 0 0 1 1 4 , 1 7 0 0 3 4 6 , 3 0 0 0 8 0 , 1 4 0 0 3 4 6 , 3 0 0 0 3 4 6 , 3 0 0 0 3 4 6 , 3 0 0 0 3 4 6 , 3 0 0 0 3 4 6 , 3 0 0 0 1 7 7 , 7 2 0 0 2 , 7 0 0 0 3 4 6 , 3 0 0 0 2 . 0 7 0 0 1,1300 3 4 6 , 3 0 0 0 6 , 9 4 0 0 8 9 , 2 0 0 0 2 , 7 0 0 0 3 3 3 , 4 5 0 0 2 0 3 , 9 5 0 0 4 , 2 7 0 0 5 , 4 8 0 0 1 6 , 2 3 0 0 1,5000 2 , 2 8 0 0 1,0000 6 7 6 , 3 4 0 0 1,8600 3 4 6 , 3 0 0 0 7 4 , 3 7 0 0 1 3 , 4 7 0 0
ACP
Angola Antigua et Barbuda Bahamas Barbada Belize Bénin Botswana Burkina Faso Burundi Cameroun Cap-Vert
Niger Nigeria Papua New Guinea Rwanda
Sao Tome & Principe Senegal
Seychelles Sierra Leone Solomon Somalia St Kitts & Nevis St Lucia St Vincent & Gren. Sudan Suriname Swaziland Tanzania Togo Tonga
Trinidad & Tobago Tuvalu Uganda Vanuatu Western Samoa Zaire Zambia Zimbabwe
Mediterranean countries
Algeria Cyprus Egypt Israel Jordan Lebanon Libya Malta Morocco Syria Tunisia Turkey Yugoslavia3 2 8 , 6 0 0 0 0,6700 0,7400 9 2 , 8 4 0 0 4 1 , 0 0 0 0 3 2 8 . 6 0 0 0 6 , 5 5 0 0 1,2400 0,9700 10,7500 2 , 7 0 0 0 2 , 7 0 0 0 2 , 7 0 0 0 0,9500 1,7800 1.0900 9.2800 3 2 8 , 6 0 0 0 0,9900 2,4000 0,9400 9 6 , 2 1 0 0 1,2100 5,7500 0,9300 0,7600
4 , 5 9 0 0 0,4700 0,7000 0,0200 0,3500 4,7400 0,3000 0,4100 6,0200 3,9200 0,5900 162,5500 5 0 , 2 8 0 0
3 8 1 , 0 6 0 0 0,7200 0,8400 9 4 , 3 4 0 0 4 2 , 3 3 0 0 3 8 1 , 0 6 0 0 6,7700 1,8800 1,1500 15,7900 2,7000 2,7000 2,7000 1,3000 1,7800 1.1100 11,1400 3 8 1 , 0 6 0 0 1,1100 2.4000 1,5400 9 9 , 3 7 0 0 1,5500 12,8900 1,2600 1,0100
4 . 7 9 0 0 0.5300 0,7000 0,0600 0,3600 4 , 5 3 0 0 0.3000 0.4300 7,1100 3,9200 0.6800 2 2 5 , 4 6 0 0 9 2 , 8 4 0 0
4 3 6 . 9 6 0 0 0,7700 0,9000 100,1700 4 4 , 1 6 0 0 4 3 6 , 9 6 0 0 7,0600 2 , 5 1 0 0 1,2700 2 0 , 0 2 0 0 2,7000 2,7000 2,7000 1,3000 1,7800 1,4700 15,2900 4 3 6 , 9 6 0 0 1,1400 2,4000 3,6000 9 9 , 2 3 0 0 1,8600 3 6 , 1 3 0 0 1,8100 1,2600
4 , 9 8 0 0 0,5900 0,7000 0,2900 0,3800 6,5100 0,3000 0,4600 8,8100 3,9200 0,7800 3 6 6 , 6 8 0 0 152,8200
4 4 9 , 2 6 0 0 0,8900 1.0000 101.2600 4 4 , 6 0 0 0 4 4 9 , 2 6 0 0 7,1300 5,0900 1.4800 3 9 , 4 9 0 0 2 , 7 0 0 0 2,7000 2 , 7 0 0 0 2 , 3 0 0 0 1,7800 2 , 2 2 0 0 17,4700 4 4 9 , 2 6 0 0 1,4300 2,4500 6,7200 106,0300 2,2400 4 9 , 8 7 0 0 3,1400 1,6100 5,0300 0,6100 0,7000 1,1800 0,3900 16,4200 0,3000 0,4700 10,0600 3,9200 0,8300 5 2 1 , 9 8 0 0 2 7 0 , 1 6 0 0
3 4 6 , 3 0 0 0 1,7500 0.9700 8 7 . 6 4 0 0 3 8 . 5 9 0 0 3 4 6 . 3 0 0 0 6 , 1 8 0 0 16,0900 1,7400 7 2 , 0 0 0 0 2 , 7 0 0 0 2 , 7 0 0 0 2 , 7 0 0 0 2 , 6 0 0 0 1,7800 2 , 2 8 0 0 3 2 , 7 0 0 0 3 4 6 , 3 0 0 0 1,5000 3,6000 14,0000 106,0800 2,2400 5 9 , 6 2 0 0 7,7900 1,6700
4 , 7 0 0 0 0,5200 0,7000 1,4900 0,3500 3 8 , 3 7 0 0 0,3100 0.3900 9.1000 3,9200 0,7900 6 7 4 , 5 1 0 0 3 7 9 , 2 2 0 0
Niger Nigeria
Papouasie-Nouvelle-Guinée Rwanda
Sao Tomé et Principe Sénégal Seychelles Sierra Leone Salomon Somalie Saint-Christophe-et-Nevis Sainte-Lucie
Saint-Vincent at Granadinas Soudan Suriname Swaziland Tanzanie Togo Tonga Trinité et Tobago Tuvalu Ouganda Vanuatu Samoa occidentales Zaire Zambie Zimbabwe
Pays méditerranéens
Algerie Chypre Egypte Israël Jordanie Liban Libye Malte Maroc Syrie Tunisie Turquie YougoslavieACP exchange rates: SDR 1 = χ national currency units
œ
Taux de conversion des ACP: 1 DTS = χ unités monétaires nationales
ACPAngola Antigua & Barbuda Bahamas Barbados Belize Benin Botswana Burkina Faso Burundi Cameroon Cape Verde Central African Rep. Chad
Comoros Congo Cote d'Ivoire Djibouti Dominica Equatorial Guinea Ethiopia Fiji Gabon Gambia Ghana Grenada Guinea Guinea-Bissau Guyana Jamaica Kenya Kiribati Lesotho Liberia Madagascar Malawi Mali Mauritania Mauritius Mozambique 1982
2 , 9 8 0 0 1,1000 2 , 2 2 0 0 2 , 2 1 0 0 3 7 0 , 9 2 0 0 1,1700 3 7 0 , 9 2 0 0 9 9 , 2 8 0 0 3 7 0 , 9 2 0 0 6 9 , 5 4 0 0 3 7 0 , 9 2 0 0 3 7 0 . 9 2 0 0 3 7 0 , 9 2 0 0 3 7 0 , 9 2 0 0 3 7 0 , 9 2 0 0 1 9 6 , 0 5 0 0 2 , 9 8 0 0 2 7 7 , 1 0 0 0 2 , 2 8 0 0 1,0400 3 7 0 , 9 2 0 0 2 , 7 3 0 0 3 , 0 3 0 0 2 , 9 8 0 0 2 4 , 6 8 0 0 4 4 , 0 0 0 0 3 . 3 1 0 0 1.9600 14,0600 1,1200 1,1900 1,1000 4 0 5 , 6 2 0 0 1.2100 3 7 0 , 9 2 0 0 5 8 , 4 2 0 0 1 2 , 0 0 0 0
1983
2 , 8 3 0 0 1,0500 2 . 1 1 0 0 2 , 0 9 0 0 4 3 6 , 9 7 0 0 1,2100 4 3 6 , 9 7 0 0 1 2 2 , 7 0 0 0 4 3 6 , 9 7 0 0 8 3 , 7 3 0 0 4 3 6 , 9 7 0 0 4 3 6 , 9 7 0 0 4 3 6 , 9 7 0 0 4 3 6 , 9 7 0 0 4 3 6 , 9 7 0 0 1 8 6 . 0 6 0 0 2 , 8 3 0 0 3 2 8 . 1 1 0 0 2 . 1 7 0 0 1,0900 4 3 6 , 9 7 0 0 2 , 8 9 0 0 3 1 , 4 1 0 0 2 , 8 3 0 0 2 4 , 6 8 0 0 8 8 , 1 1 0 0 3 , 1 4 0 0 3 . 4 3 0 0 1 4 , 4 2 0 0 1,1600 1,2800 1,0500 5 1 5 , 2 7 0 0 1,3600 4 3 6 , 9 7 0 0 5 9 , 7 1 0 0 1 3 , 3 2 0 0
1984
2 , 6 5 0 0 0 , 9 8 0 0 1.9700 1,9600 4 7 0 , 1 1 0 0 1,5300 4 7 0 , 1 1 0 0 1 2 2 , 7 0 0 0 4 7 0 , 1 1 0 0 9 1 , 1 7 0 0 4 7 0 , 1 1 0 0 4 7 0 , 1 1 0 0 4 7 0 , 1 1 0 0 4 7 0 , 1 1 0 0 4 7 0 . 1 1 0 0 1 7 4 , 2 0 0 0 2 , 6 5 0 0 3 4 0 , 7 8 0 0 2 , 0 3 0 0 1,1200 4 7 0 , 1 1 0 0 4 , 2 4 0 0 4 9 , 0 1 0 0 2 , 6 5 0 0 2 4 . 6 8 0 0 1 2 6 , 0 3 0 0 4 , 0 7 0 0 4 , 8 3 0 0 1 5 , 1 9 0 0 1,1800 1,9500 0 , 9 8 0 0 6 4 5 , 0 0 0 0 1,5300 4 7 0 , 1 1 0 0 6 5 , 9 6 0 0 1 5 , 2 9 0 0
1985
2 , 9 7 0 0 1,1000 2 , 2 1 0 0 2 , 2 0 0 0 4 1 5 , 2 6 0 0 2 , 3 1 0 0 4 1 5 , 2 6 0 0 1 2 2 , 7 0 0 0 4 1 5 , 2 6 0 0 9 3 , 7 8 0 0 4 1 5 , 2 6 0 0 4 1 5 , 2 6 0 0 4 1 5 , 2 6 0 0 4 1 5 , 2 6 0 0 4 1 5 , 2 6 0 0 1 9 5 , 2 1 0 0 2 , 9 7 0 0 4 1 5 , 2 6 0 0 2 , 2 7 0 0 1,2300 4 1 5 , 2 6 0 0 3 , 8 0 0 0 6 5 , 8 9 0 0 2 , 9 7 0 0 2 4 , 6 8 0 0 1 9 0 , 6 9 0 0 4 , 5 6 0 0 6 , 0 2 0 0 1 7 , 7 4 0 0 1,6100 2 , 8 1 0 0 1,1000 6 9 8 , 3 6 0 0 1,8400 4 1 5 , 2 6 0 0 8 4 , 6 5 0 0 1 5 , 7 2 0 0
1986
3 , 3 0 0 0 1,2200 2 , 4 6 0 0 2 , 4 5 0 0 3 9 4 , 7 8 0 0 2 , 2 5 0 0 3 9 4 , 7 8 0 0 1 5 1 , 5 0 0 0 3 9 4 , 7 8 0 0 9 3 , 6 5 0 0 3 9 4 , 7 8 0 0 3 9 4 , 7 8 0 0 3 9 4 , 7 8 0 0 3 9 4 , 7 8 0 0 3 9 4 . 7 8 0 0 2 1 7 . 3 9 0 0 3 , 3 0 0 0 3 9 4 , 7 8 0 0 2 , 5 3 0 0 1,4000 3 9 4 , 7 8 0 0 9 , 0 8 0 0 1 1 0 , 1 0 0 0 3 , 3 0 0 0 2 8 8 , 2 2 0 0 2 9 2 , 3 2 0 0 5 . 3 8 0 0 6 , 7 0 0 0 1 9 , 1 3 0 0 1,8400 2 , 6 7 0 0 1,2200 9 4 1 , 6 2 0 0 2 , 3 9 0 0 3 9 4 , 7 8 0 0 9 0 , 6 1 0 0 1 6 , 0 7 0 0
ACP
Angola Antigua at Barbuda Bahamas Barbade Belize Bénin Botswana Burkina Faso Burundi Cameroun Cap-Vert
Niger Nigeria Papua New Guinea Rwanda
Sao Tome & Principe Senegal
Seychelles Sierra Leone Solomon Somalia St Kitts & Nevis St Lucia St Vincent & Gren. Sudan Suriname Swaziland Tanzania Togo Tonga Trinidad & Tobago Tuvalu Uganda Vanuatu Western Samoa Zaire Zambia Zimbabwe
Mediterranean countries
Algeria Cyprus Egypt Israel Jordan Lebanon Libya Malta Morocco Syria Tunisia Turkey Yugoslavia 370,9200 0,7400 0,8200 102,4100 45,2500 370,9200 7,2300 1,3600 1,1500 16,5000 2,9800 2,9800 2,9800 1,4300 1,9700 1,1900 10,5500 370,9200 1,1200 2,6500 1,1700 106,2000 1,3600 6.35TO 1,0200 1,0100 5.1100 0,5400 0,7700 0,0400 0.3900 4.2000 0.3300 0.4600 6.9100 4,3300 0,6800 206,0100 68,9300 436,9700 0,7800 0,9200 102,7100 45,2500 436,9700 7,2300 2,6300 1,2800 18,3800 2,8300 2,8300 2.8300 1.3600 1,8700 1,2800 13,0400 436,9700 1,1600 2,5100 2,5100 106,2000 1,7000 31,5300 1,2800 1,1600 5,1500 0,5800 0,7300 0,1100 0,3900 5,7500 0,3100 0,4700 8,4400 4,1100 0,7600 296,0800 131,5700 470,1100 0,7900 0,9200 102,7100 45,2500 470,1100 7,2300 2,4600 1,3200 25,4800 2,6500 2,6500 2,6500 1,2700 1,7500 1,9500 17,7500 470,1100 1,1800 2,3500 5,1000 100,6000 2,1400 39,6500 2,1600 1,4700 5,0200 0.6300 0.6900 0.6300 0.3900 8,7100 0,2900 0,4800 9,3600 3,8500 0,8500 435.9300 207,5600 415,2600 1,1000 1,1100 102,7100 45,2500 415,2600 7,2300 5,7400 1,7700 46,6800 2,9700 2,9700 2,9700 2,7500 1,9600 2,8100 18,1200 415,2600 1,6100 3,9500 15,3800 110,0000 2,5300 61,2800 6,2600 1,8000 5,2400 0,6000 0,7700 1,6500 0,3900 19,8800 0,3200 0,4700 10,5700 4,3100 0,8300 633,6300 343,5900 394,7800 4.0600 1,1800 102,7100 45,2500 394,7800 7,2300 43,5300 2,4300 110,7000 3,3000 3,3000 3,3000 3,0600 2,1800 2,6700 63,2600 394,7800 1,8400 4,4000 17,1200 142,0000 2,6900 86,9700 15,5500 2,0500 5,9000 0,6300 0,8600 1,8200 0,3900 106,4200 0,3800 0,4500 10,6600 4,8000 1,0300 926,9200 559,2200 Niger Nigeria Papouasie-Nouvelle-Guinée RwandaSao Tomé et Principe Sénégal Seychelles Sierra Leone Salomon Somalia Saint-Christopha-et-Nevis Sainte-Lucie
Saint-Vincent et Grenadines Soudan Suriname Swaziland Tanzanie Togo Tonga Trinité et Tobago Tuvalu Ouganda Vanuatu Samoa occidentales Zaïre Zambie Zimbabwe
Pays méditerranéens
Algehe Chypre Egypte Israel Jordanie Liban Libya Malte Maroc Syrie Tunisie Turquie YougoslavieSource: International Monetary Fund: International financial statistics: exchange rate (aa: IFS code).
ACP exchange rates: ECU 1 = χ national currency units
00
Taux de conversion des ACP: 1 ECU = χ unités monétaires nationales
ACP
Angola Antigua & Barbuda Bahamas Barbados Belize Benin Botswana Burkina Faso Burundi Cameroon Cape Verde Central African Rep. Chad
Comoros Congo Cote d'Ivoire Djibouti Dominica Equatorial Guinea Ethiopia Fiji Gabon Gambia Ghana Grenada Guinea GuineaBissau Guyana Jamaica Kenya Kiribati Lesotho Liberia Madagascar Malawi Mall Mauritania Mauritius Mozambique 1982
2 , 6 4 5 2 0 , 9 7 9 7 1,9692 1.9594 3 2 1 , 9 3 2 7 1,0091 3 2 1 , 9 3 2 7 8 8 , 1 7 3 9 3 2 1 , 9 3 2 7 5 7 . 1 0 7 3 3 2 1 , 9 3 2 7 3 2 1 , 9 3 2 7 3 2 1 , 9 3 2 7 3 2 1 , 9 3 2 7 3 2 1 , 9 3 2 7 1 7 4 , 1 1 4 1 2 , 6 4 5 2 2 1 5 , 2 6 1 9 2 , 0 2 8 0 0 , 9 1 1 1 3 2 1 , 9 3 2 7 2 , 2 4 3 5 2 , 6 9 4 2 2 , 6 4 5 2 2 1 , 9 1 6 1 3 9 , 0 6 1 0 2 , 9 3 9 1 1,7439 1 0 , 6 9 8 4 0 , 9 6 9 9 1,0679 0 , 9 7 9 7 3 4 2 , 6 4 3 8 1,0385 3 2 1 , 9 3 2 7 5 0 , 7 1 9 6 1 0 , 6 4 9 4
1983
2 , 4 0 3 6 0 , 8 9 0 2 1,7893 1,7804 3 3 9 , 2 2 7 2 0 , 9 7 9 2 3 3 9 , 2 2 7 2 8 2 . 7 4 5 9 3 3 9 , 2 2 7 2 6 3 , 8 1 9 9 3 3 9 , 2 2 7 2 3 3 9 , 2 2 7 2 3 3 9 , 2 2 7 2 3 3 9 , 2 2 7 2 3 3 9 , 2 2 7 2 1 5 8 , 2 0 9 9 2 , 4 0 3 6 2 5 5 , 3 6 8 5 1,8428 0 , 9 0 8 0 3 3 9 , 2 2 7 2 2 , 3 5 0 2 7 , 8 6 0 6 2 , 4 0 3 6 2 0 . 5 5 5 2 3 7 . 4 7 8 3 2 , 6 7 0 7 1,7181 11,8488 0 , 9 8 8 1 0 , 9 8 8 1 0 , 8 9 0 2 3 8 3 , 1 9 5 2 1,0416 3 3 9 , 2 2 7 2 4 8 , 7 9 3 0 10,4245
1984
2 , 1 3 0 4 0 . 7 8 9 0 1,5860 1,5781 3 4 4 , 7 7 4 5 1,0257 3 4 4 , 7 7 4 5 9 4 . 4 5 4 8 3 4 4 , 7 7 4 5 6 6 . 9 7 2 9 3 4 4 , 7 7 4 5 3 4 4 , 7 7 4 5 3 4 4 , 7 6 6 7 3 4 4 , 7 7 4 5 3 4 4 , 7 7 4 5 1 4 0 , 2 2 6 4 2 , 1 3 0 4 2 5 3 , 6 8 8 9 1,6333 0 , 8 5 2 2 3 4 4 , 7 7 4 5 2 , 8 2 4 7 2 8 , 3 9 7 2 2 , 1 3 0 4 19,0077 8 3 , 0 7 7 0 3 , 0 2 2 0 3 , 1 0 8 8 1 1 , 3 6 9 9 0 , 8 9 9 5 1,1599 0 , 7 8 9 0 4 5 4 , 9 8 6 3 1,1125 3 4 4 , 7 7 4 5 5 0 , 3 4 0 1 10,8886
1985
2 , 0 6 0 3 0 , 7 6 3 1 1,5338 1,5262 3 4 2 , 8 2 5 8 1,4499 3 4 2 , 8 2 5 8 9 2 . 0 9 7 3 3 4 2 , 8 2 5 8 6 9 , 9 2 1 9 3 4 2 , 8 2 5 8 3 4 2 , 8 2 5 8 3 4 2 , 8 2 5 8 3 4 2 , 8 2 5 8 3 4 2 , 8 2 5 8 1 3 5 , 6 1 6 4 2 , 0 6 0 3 3 4 2 , 8 2 5 8 1,5796 0 , 8 7 7 6 3 4 2 , 8 2 5 8 2 , 9 6 8 4 4 1 , 4 8 1 6 2 , 0 6 0 3 1 8 , 5 6 6 0 1 2 1 , 8 0 4 4 3 , 2 4 3 1 4 , 2 4 2 8 12,5376 1,0912 1,7017 0 , 7 6 3 1 5 0 5 , 5 3 1 9 1,3125 3 4 2 , 8 2 5 8 5 8 , 8 1 9 0 11,7821
1986
2 , 6 5 7 3 0 , 9 8 4 2 1,9782 1,9683 3 4 0 , 8 1 8 1 1,8502 3 4 0 , 8 1 8 1 1 1 2 . 3 6 2 7 3 4 0 , 8 1 8 1 7 8 , 8 7 1 4 3 4 0 , 8 1 8 1 3 4 0 , 8 1 8 1 3 4 0 , 8 1 8 1 3 4 0 , 8 1 8 1 3 4 0 , 8 1 8 1 1 7 4 , 9 0 6 7 2 , 6 5 7 3 3 4 0 , 8 1 8 1 2 , 0 3 7 2 1,1121 3 4 0 . 8 1 8 1 6 , 8 3 0 1 8 7 , 7 8 8 0 2 , 6 5 7 3 3 2 8 , 1 7 1 5 2 0 0 , 7 2 1 5 4 , 2 0 2 4 5 , 3 9 3 3 15,9731 1,4763 2 , 2 4 3 9 0 , 9 8 4 2 6 6 5 , 6 3 3 5 1,8306 3 4 0 , 8 1 8 1 7 3 , 1 9 2 7 13,2568
ACP
Angola Antigua et Barbuda Bahamas Barbada Belize Bénin Botswana Burkina Faso Burundi Cameroun CapVert
Niger Nigeria Papua New Guinea Rwanda
Sao Tome & Principe Senegal
Seychelles Sierra Leone Solomon Somalia St Kitts & Navis St Lucia St Vincent & Gren. Sudan Suriname Swaziland Tanzania Togo Tonga
Trinidad & Tobago Tuvalu Uganda Vanuatu Western Samoa Zaire Zambia Zimbabwe
Mediterranean countries
Algeria Cyprus Egypt Israel Jordan Lebanon Libya Malta Morocco Syria Tunisia Turkey Yugoslavia3 2 1 , 9 3 2 7 0,6564 0,7250 9 0 , 9 5 6 3 4 0 , 1 6 8 1 3 2 1 , 9 3 2 7 6,4171 1,2148 0,9503 10,5319 2,6452 2,6452 2,6452 0,9307 1,7439 1,0679 9,0917 3 2 1 , 9 3 2 7 0,9699 2,3513 0,9700 55,8783 9 8 , 0 5 7 8 1,1499 4,8901 0,9713 0,7704 4,4969 0,4605 0,6858 0,0196 0,3429 4,6438 0,2939 0,4017 5,8979 3,8405 0,5780 159,2519 4 9 , 2 5 9 8
3 3 9 , 2 2 7 2 0,6410 0,7478 8 3 , 9 8 3 4 3 7 . 6 8 3 0 339,2272 6,0268 1,6736 1,0238 14,0566 2,4036 2,4036 2,4036 1,1573 1,5846 0,9881 9,9171 3 3 9 , 2 2 7 2 0,9881 2.1366 92,1417 9 4 , 2 5 7 9 1,1854 5,6333 0,9111 0,7446 4,2642 0,4718 0.6232 0.0534 0,3205 4,0327 0,2671 0.3828 6,3295 3,4897 0,6053 2 0 0 , 7 0 9 0 8 2 , 6 4 8 0
3 4 4 , 7 7 4 5 0,6076 0,7101 79,0371 3 4 , 8 4 3 6 3 4 4 , 7 7 4 5 5,5706 1,9805 1,0021 15,7964 2,1304 2,1304 2,1304 1,0257 1,4045 1,1599 12,0643 3 4 4 , 7 7 4 5 0,8995 1,8937 136,9692 8 8 , 4 6 1 2 1.3798 11,4749 1,1217 0,8991 3,9294 0,4655 0,5523 0,2288 0,2998 5,1366 0,2367 0,3630 6 , 9 5 1 4 3,0930 0,6154 289,3215 120,5796
3 4 2 , 8 2 5 8 0,6792 0,7631 7 7 , 2 7 0 5 3 4 . 0 3 3 8 3 4 2 , 8 2 5 8 5,4408 3,8841 1,1294 3 0 , 1 3 4 4 2,0603 2,0603 2,0603 1,7551 1,3583 1,6941 13,3312 3 4 2 , 8 2 5 8 1.0912 1.8696 2 8 3 , 8 1 4 1 7 8 . 2 9 5 4 1,4676 28,5077 1,4281 0 . 9 9 4 2
3,8383 0.4655 0 , 5 3 4 2 0,9004 0,2976 12,5299 0,2289 0,3587 7,6767 2,9913 0,6334 3 9 8 , 3 1 7 7 2 0 6 , 1 5 6 4
3 4 0 , 8 1 8 1 1,7223 0,9546 86,2527 3 7 , 9 7 9 1 3 4 0 , 8 1 8 1 6,0822 15,8353 1,7125 7 0 . 8 6 0 2 2.6573 2,6573 2,6573 2,4604 1.7518 2,2439 3 2 , 1 8 2 4 3 4 0 , 8 1 8 1 1,4763 3,5430 5 1 2 , 8 1 1 7 8 0 , 9 1 0 4 1,7093 3 8 , 0 5 5 3 2,3961 1,2286 4,6256 0,5118 0,6889 1,4664 0,3445 3 7 , 7 6 2 6 0,3051 0,3838 8,9559 3,8579 0,7775 6 6 3 , 8 3 2 5 3 7 3 , 2 1 6 9
Niger Nigeria
Papouasle-Nouvelle-Guinée Rwanda
São Tomé et Principe Sénégal Seychelles Sierra Leone Salomon Somalla Saint-Christophe-et-Navìs Sainte-Lucie
Saint-Vincent et Grenadines Soudan Suriname Swaziland Tanzanie Togo Tonga Trinité et Tobago Tuvalu Ouganda Vanuatu Samoa occidentales Zaire Zambie Zimbabwe
Pays méditerranéens
Algérie Chypre Egypte Israel Jordanie Liban Libye Malte Maroc Syrie Tunisie Turquie Yougoslavie Source: International Monetary Fund: International financial statistics: exchange rate (rf: IFS code).Population and density: 1984, 1985, 1986
o Population et densité: 1984, 1985, 1986
Average population at 30 June (thousands) Population
ACP Angola Antigua & Barbuda Bahamas Barbados Belize Benin Botswana Burkina Faso Burundi Cameroon Cape Verde Central African Rep. Chad Comoros Congo Cote d'Ivoire Djibouti Dominica Equatorial Guinea Ethiopia Fiji Gabon Gambia Ghana Grenada Guinea Guinea-Bissau Guyana Jamaica Kenya Kiribati Lesotho Liberia Madagascar Malawi moyenne au 1984
8 5 4 0 8 0 2 3 0 2 5 0 160 3 8 3 0 1 0 5 0 6 5 3 0 4 5 9 0 9 8 7 0 3 2 0 2 5 2 0 4 9 0 0 4 3 0 1 7 0 0 9 4 6 0 4 1 0
8 0 3 8 0 4 2 4 4 0 6 9 0 1 130
6 3 0 13 150
110 5 9 3 0 8 8 0 9 4 0 2 3 0 0 19 5 4 0 6 0 1 4 7 0 2 110 9 7 3 0 6 8 4 0
30 juin (en milliers) 1985
8 7 5 0 80 2 3 0 2 5 0 170 3 9 3 0 1 0 9 0 6 6 4 0 4 7 2 0 10 190 3 3 0 2 6 1 0 5 0 2 0
4 4 0 1 7 4 0 9 8 1 0
4 3 0 80 3 9 0 4 3 3 5 0
7 0 0 1 150
6 4 0 13 5 9 0 110 6 0 7 0
8 9 0 7 9 0 2 3 4 0 20 3 3 0 6 0 1 5 3 0 2 190 9 9 8 0 7 0 6 0
1986 8 9 8 0
8 0 2 4 0 2 5 0 170 4 0 4 0 1 130 6 7 5 0 4 8 5 0 10 4 5 0 3 3 0 2 7 4 0 5 140 4 8 0 1 7 9 0 10 160 4 6 0
8 0 4 0 0 4 4 9 3 0
7 0 0 1 170
6 6 0 14 0 4 0 110 6 2 2 0
9 1 0 9 7 0 2 3 7 0 21 160 60 1 5 6 0 2 2 2 0 10 3 0 0 7 2 8 0
Number of inhabitants per k m2
Nombre d'habitant 1984 7 182 16 581 7 3 4 2 2 4 165 21 79 4 4 198 5 29 19 107 14 35 38 4 56 55 3 2 4 2 4 2 4 4 2 0 9 3 4 85 4 8 19 17 58 1985 7 182 16 581 7 35 2 2 4 170 21 82 4 4 203 5 3 0 2 0 107 14 35 38 4 57 57 3 2 4 25 25 4 2 1 3 35 85 50 2 0 17 6 0
au k m2
Mali Mauritania Mauritius Mozambique Niger Nigeria Papua New Guinea Rwanda
Sao Tome & Principe Senegal
Seychelles Sierra Leone Solomon Somalia St Kitts & Nevis St Lucia St Vincent & Gren. Sudan Suriname Swaziland Tanzania Togo Tonga
Trinidad & Tobago Tuvalu Uganda Vanuatu Western Samoa Zaire Zambia Zimbabwe
Mediterranean countries
Algeria Cyprus Egypt Israel Jordan Lebanon Libya Malta Morocco Syria Tunisia Turkey Yugoslavia7 9 7 0 1 8 3 0 9 8 0 13 4 6 0 5 9 4 0 92 0 4 0 3 2 5 0 5 8 7 0 9 0 6 4 0 0 6 4 3 5 4 0 2 6 0 4 5 4 0 5 0 130 110 2 0 9 5 0 3 7 0 6 3 0 21 0 6 0 2 8 7 0 100 1 170
8 1 4 9 6 0 130 160 29 6 7 0 6 4 5 0 7 9 8 0
21 0 5 0 6 6 0 47 190
4 160 3 3 8 0 2 6 4 0 3 6 2 0 3 8 0 21 4 1 0 9 9 3 0 7 0 3 0 48 2 7 0 22 960
8 2 1 0 1 8 9 0
9 9 0 1 3 8 1 0 6 110 95 2 0 0 3 3 3 0 6 0 7 0 110 6 4 4 0 70 3 6 0 0 2 7 0 4 6 5 0
50 140 100 21 5 5 0 3 7 0 6 5 0 21 7 3 0
2 9 6 0 100 1 180
8 15 4 8 0 140 160 3 0 3 6 0 6 6 7 0 8 3 8 0
21 7 2 0 6 7 0 4 8 5 0 0
4 2 3 0 3 5 1 0 2 6 7 0 3 6 0 0 3 8 0 21 9 4 0 10 2 7 0 7 2 6 0 4 9 2 7 0 23 2 4 0
8 4 4 0 1 9 5 0 9 9 0 14 170
6 700 98 5 2 0 3 4 0 0 6 2 7 0 110 6 6 1 0 70 3 6 7 0 2 8 0 4 7 6 0
5 0 140 100 22 180
3 8 0 6 7 0 22 4 6 0
3 0 5 0 110 1 2 0 0
8 16 0 2 0 140 160 3 0 8 5 0
6 9 0 0 8 4 1 0
22 4 2 0 6 7 0 4 9 6 1 0 4 3 0 0 3 6 6 0 2 7 1 0 3 7 4 0
3 8 0 22 4 8 0 1 0 6 1 0
7 4 6 0 5 0 3 0 0 23 2 7 0
6 2 527 17 5 100 7 2 2 3 94 33 2 2 9 4 9 9 7 139 2 1 0 3 2 4 8 2 36 22 51 143 2 2 8 63 9 56 13 9 2 0 9 71 47 2 0 0 35 2 5 4 2 1 188 48 54 4 3 6 2 9 0 7 2 532 17 5 103 7 2 3 0 115 3 3 2 5 0 50 9 7 139 2 2 6 2 9 4 9 2 37 2 3 52 143 2 3 0 6 6 9 56 13 9 21 9 72 48 2 0 4 36 2 5 7 2 1 188 4 9 55 4 4 63 91 7 2 5 3 2 18 5 107 7 2 3 8 115 34 2 5 0 51 10 7 139 2 2 6 2 9 4 9 2 3 9 2 4 54 157 2 3 4 6 8 9 56 13 9 22 9 72 5 0 207 37 2 6 1 2 1 188 5 0 57 4 6 64 91 Mali Mauritanie Maurice Mozambique Niger Nigeria Papouasie Nouvelle-Guinée Rwanda
São Tomó et Principe Sénégal Seychelles Sierra Leone Salomon Somalle Saint-Christophe-et-Nevis Sainte-Lucle
Total external public debt — Total amount — 1985
to ;M Dette exterieure publique totale — Montant global — 1985
ACP
Angola Antigua & Barbuda Bahamas Barbados Belize Benin Botswana Burkina Faso Burundi Cameroon Cape Verde Central African Rep. Chad Comoros Congo Cote d'Ivoire Djibouti Dominica Equatorial Guinea Ethiopia Fiji Gabon Gambia Ghana Grenada Guinea Guinea-Bissau Guyana Jamaica Kenya Kiribati Lesotho Liberia Madagascar Malawi Mali Mauritania Dette en Mio USD
_
—
200,7 451,5 128,0 1 0 1 9 , 6 6 2 4 , 0 8 6 5 , 0 765.4 2 854,2 166,6 404,1 243,3 205,1 2 227,1 6 128,4 230,1—
179,8 2 893,8 346,7 1 456,12 6 3 . 4 1 695,5 4 7 , 0 1 763,5 3 4 0 , 0 9 1 3 , 0 3 568,6 4 196,4
—
294,2 1 0 8 2 , 4 2 858,7 1 072,7 1 841,8 1 916,5 PNB/H USD
6 9 0 2 0 3 0 7 150 4 6 8 0 1 130 2 7 0 8 4 0 140 2 4 0 8 1 0 4 3 0 2 7 0 8 0 2 8 0 1 0 2 0 6 2 0 9 7 0 1 160
—
110 1 7 0 0 3 3 4 0 2 3 0 390 9 7 0 3 2 0 170 5 7 0 9 4 0 2 9 0 4 5 0 4 8 0 4 7 0 250 170 140 4 1 0
Datte/H USD
_
—
8 7 3 1 806
753 2 5 9 572 130 162 2 8 0 505 155 4 8 4 6 6 1 2 8 0
625 535
—
4 3 1 67 495 1 2 6 6
4 1 2 125 4 2 7 2 9 1 3 8 2 1 156 1 525 206
—
192 4 9 4 286 152 2 2 4 1 0 1 4
Dette/ PNB/h
%
_
—
12,2 38,6 66,6 96,1 68,1 93,0 67,6 34,6 117,4 57,3 60,6 166,5 125,5 100,8 55,2—
—
60,7 29,1 37,9 178,9 3 2 , 0 4 4 , 0 90,8 224,7 202,7 162,2 71,2—
40,1 105,2 114,6 8 9 , 4 160,2 247,3Exportations en Mio USD
(')
_
—
2 728,0 322,2 90,1—
—
70,0 111,6 7 2 2 , 0—
92,3—
_
1 087,2 2 668,9—
—
—
3 3 7 , 8 147,1 1 9 2 0 , 0
4 3 , 0 617,0
—
—
—
2 0 7 , 0 568,6 9 5 8 , 0
—
—
4 3 6 , 0 286,7 2 5 2 , 0 170,0 3 7 4 , 0
Dette/ Exportations
_
_
7,4 140,1 142,0—
—
1 235,7 685,7 395,3—
437,7—
—
2 0 4 , 8 2 2 9 , 6
—
—
—
856,7 235,7 75,8 612,6 274,8—
—
—
4 4 1 , 0 627,6 4 3 8 . 0
—
—
248,3 9 9 7 , 0 4 2 5 , 7 1 0 8 3 , 4
5 1 2 , 4
ACP
Mauritius Mozambique Niger Nigeria Papua New Guinea Rwanda
Sao Tome & Principe Senegal
Seychelles Sierra Leone Solomon Somalia St Kitts 81 Nevis St Lucia St Vincent & Gren. Sudan Suriname Swaziland Tanzania T o g o Tonga Trinidad & Tobago Tuvalu Uganda Vanuatu Western Samoa Zaire Zambia Zimbabwe
Mediterranean countries
Algeria Cyprus Egypt Israel Jordan Lebanon Libya Malta Morocco Syria Tunisia Turkey Yugoslavia 617,7—
1 170,4 1 6 4 1 6 , 7 1 3 8 2 , 9 5 6 7 , 6 9 2 , 9 2 6 0 0 , 6 8 8 , 3 5 1 0 , 5 103,5 1 5 6 4 , 6
—
—
5 0 , 1 5 5 8 0 . 3
—
2 8 1 , 1 3 4 5 5 , 2 9 8 5 , 2
—
1 2 0 9 , 9
—
1 2 6 7 , 5 14,7 90,8 5 3 8 2 , 1 3 965,7 2 3 6 9 , 4
18 3 6 4 , 8 1 0 7 7 , 3 21 6 1 5 , 0 16 808,7 4 2 0 6 , 1 2 0 7 , 0
—
127,8 14 9 9 8 , 1 3 8 7 4 , 0 7 0 4 6 , 5 2 3 3 7 8 , 8 1 1 4 1 0 , 2
1 0 7 0 3 0 0 2 0 0 7 6 0 7 1 0 2 9 0 3 1 0 3 7 0 2 4 2 9 3 7 0 5 1 0 2 7 0 1 5 2 0 1 2 1 0 8 4 0 3 3 0 2 5 7 0 6 5 0 2 7 0 2 5 0 7 3 0 6 0 1 0
—
2 2 0 7 2 0 6 6 0 170 4 0 0 6 5 0
2 5 3 0 3 7 9 0 6 8 0 4 9 2 0 1 5 6 0
—
7 5 0 0 3 3 0 0 6 1 0 1 6 3 0 1 2 2 0 1 130 2 0 7 0
6 2 4
—
192 172 4 1 5 9 4 8 4 5 4 0 4 1 2 6 2 142 3 8 3 3 3 6
_
—
5 0 1 2 5 9
—
4 3 2 159 3 3 3
—
1 0 2 5
—
82 105 5 6 8 177 5 9 5 2 8 3
8 4 6 1 6 0 8 4 4 6 3 9 7 4 1 198 78
—
3 3 6 6 8 4 3 7 7 9 7 1 4 7 5 4 9 1
5 8 , 3
—
9 5 , 8 22,7 5 8 , 5 3 2 , 2 2 7 2 , 6 109,1 5 1 , 9 3 8 , 3 7 5 , 2 124,6
_
_
5 9 , 6 7 8 , 5
—
6 6 , 5 5 8 , 9 133,1
—
17,1
—
3 7 , 2 14,6 8 6 , 0 104,3 148,6 4 3 , 5
3 3 , 4 4 2 , 4 6 5 , 5 8 0 , 8 7 6 , 8
—
—
10,2 112,1 2 3 , 1 7 9 , 6 4 2 , 0 23,7
4 4 1 , 0
—
—
13 113,0 9 0 9 , 0 9 8 , 0
—
4 0 2 , 0 2 7 , 9 105,0 7 0 , 0 9 1 , 0
_
_
_
3 6 7 , 0
—
—
2 8 3 . 9 190.0 5.0 2 160,9
—
—
3 1 , 0 15,0 5 9 1 , 0 5 3 9 , 0 1 0 5 3 , 0
10 149,1 4 7 6 , 3 3 7 1 4 , 2 6 2 5 6 , 4 780,8
—
1 0 8 4 1 , 0 4 0 0 , 4 2 165,1 1 6 3 7 , 0 1 6 2 7 , 3 7 9 5 8 , 0 1 0 6 4 1 , 5
140,1
—
—
125,2 152,1 5 7 9 , 2
—
6 4 6 , 9 3 1 6 , 7 4 8 6 , 2 147,9 1 7 1 9 , 4
—
_
_
1 5 2 0 , 5
—
—
1 2 1 7 , 1 518,5
—
5 6 , 0
—
—
4 7 , 5 6 0 5 , 5 9 1 0 , 7 735,7 2 2 5 , 0
181,0 2 2 6 , 2 5 8 2 , 0 2 6 8 , 7 5 3 8 , 7
—
—
3 1 , 9 6 9 2 , 7 236,7 4 3 3 , 0 2 9 3 , 8 107,2 Maurice Mozambique Niger Nigeria PapouasieNouvelleGulnóe Rwanda
Sao Tomó et Principe Sénégal
Seychelles Sierra Leone Salomon Somalle
SaintChristopheetNevis SalntaLucie
SaintVincent et Grenadines Soudan
Suriname Swaziland Tanzanie T o g o Tonga Trinité et Tobago Tuvalu Ouganda Vanuatu Samoa occidentales Zaïre
Zambie Zimbabwe
Pays méditerranéens
Algérie Chypre Egypte Israël Jordanie Liban Libye Malte Maroc Syrie Tunisie Turquie YougoslavieOrigin of gross domestic product: 1983, 1984, 1985
£ Origine du produit intérieur brut: 1983, 1984, 1985
ACP
Mozambique Niger Nigeria Papua New Guinea Rwanda
Sao Tome & Principe Senegal
Seychelles Sierra Leone Solomon Somalia St Kins & Nevis St Lucia St Vincent & Gren. Sudan Suriname Swaziland Tanzania Togo Tonga Trinidad & Tobago Tuvalu Uganda Vanuatu Western Samoa Zaire Zambia Zimbabwe
Mediterranean countries
Algeria Cyprus Egypt Israel Jordan Lebanon Libya Malta Morocco Syria Tunisia Turkey Yugoslavia_
46,6 25,2 32,8 38,7 43,2 20,9—
36,9—
—
10,1 14.4 17,4 28,6 6,4—
47,9 32,0 33,2 4,1—
69,4—
50,6 35,5 14,2 8,3 7,3 8,0 19,8 4,4 8,3—
3,0 4,5 17,1 21,3 14,1 19,5 14,7_
20,7 44,5 25,5 23,6 7.4 24,1—
16,0—
—
18,7 19,2 25,4 14,5 25,7—
10,1 22,3 12,8 42,3—
5,9—
—
24,2 40,1 36,0 52,9 30,0 33,6 22,4 26,9—
56,3 39,5 31,8 22,5 35,1 32,6 42,7_
32,5 30,3 41,7 37,7—
51,1—
45,4—
—
71,2 66,4 57,2 49,5 49,1—
31,3 45,7—
53,6—
16,4—
—
40,4 44,6 41,2 34,6 54,6 46,5—
61,4—
30,7 56,1 51,2 56,2 43,9 47,7 42,6_
49,2 25,5 29,1 41,1 37,0 16,7—
39,1—
—
10,1 13,1 17,8 27,4 7,7—
48,0 31,9—
4,5—
68,4—
—
31,3 15,2 10,1 7.5 9.0 19,6 3,9 6,6—
3,0 4,5 16,6 19.7 16,0 19,5 13,6_
22,8 42,8—
23,1 8,8 26,9—
14,5—
—
19,6 19,9 23,2 15,3 27,8—
9,8 21,9—
42,4—
5,5—
—
35,3 40,3 37,3 50,2 29,1 33,9 23,0 26,5—
47.4 40,2 31,6 22,6 35,2 33,4 43,8__
27,9 31,5—
35,7—
53,8—
44,8—
—
70,3 67,0 59,0 49,8 52,2—
31,8 46,2—
53,1—
19.1—
—
33,4 44,1 41,5 42,3 54,9 46,5—
61,2—
32,4 54,7 51,5 57,7 42,6 47,0 42,6_
53,3 26,0—
44,0—
19,0—
43,1—
—
—
15,0 19,2 30,1 8,2—
49,3 30,9—
4,6—
70,9—
—
30,5 13,1 11,8 9,4 7.5 19.7 3.6 8.3_
—
4.5 18,4 21,8 15,2 18,8 11,6_
20,9 46,0—
21,3—
28,7—
14,1—
—
—
19,9 22,3 14,8 26,7—
8,9 22,8—
38,1—
4,8—
—
33,7 42,1 38.9 48,6 28,4 31,2 20,7 29,4_
—
39.4 32,1 20,7 29,8 35,3 46,2_
25,6 27,9—
34,6—
52,3—
41,1—
—
—
65,1 58,5 49,1 54,6—
30,8 46,3—
57,2—
17,5—
—
35,8 44,8 39,5 42,0 57,0 49,1—
62,3_
—
56,1 49,5 57,5 42,4 45,9 42,3 Mozambique Niger Nigeria PapouasieNouvelleGulnée RwandaSao Tomó et Principe Sénégal Seychelles Sierra Leone Salomon Somalie SaintChristopheetNevis SalnteLucie
SaintVincent et Grenadines Soudan Suriname Swaziland Tanzanie Togo Tonga Trinité at Tobago Tuvalu Ouganda Vanuatu Samoa occidentales Zaïre Zambie Zimbabwe
Pays méditerranéens
Algérie Chypre Egypte Israel Jordanie Liban Libye Malte Maroc Syrie Tunisie Turquie Yougoslavie A = Agriculture, forestry, fisheries. Β = Industry. C = Services,Current balance
io
°> Balance courante
ACP
Angola Antigua & Barbuda Bahamas Barbados Belize Benin Botswana Burkina Faso Burundi Cameroon Cape Verde Central African Rep. Chad Comoros Congo Cote d'Ivoire Djibouti Dominica Equatorial Guinea Ethiopia Fiji Gabon Gambia Ghana Grenada Guinea Guinea-Bissau Guyana Jamaica Kenya Kiribati Lesotho Liberia Madagascar Malawi
Goods, services and unilateral transfers Biens, services, transferts
Mali Mauritania Mauritius Mozambique Niger Nigeria Papua New Guinea Rwanda
Sao Tome 8t Principe Senegal
Seychelles Sierra Leone Solomon Somalia St Kitts 81 Nevis St Lucia St Vincent 81 Gren. Sudan Suriname Swaziland Tanzania Togo Tonga
Trinidad & Tobago Tuvalu Uganda Vanuatu Western Samoa Zaire Zambia Zimbabwe
Mediterranean countries
Algeria Cyprus Egypt Israel Jordan Lebanon Libya Malta Morocco Syria Tunisia Turkey Yugoslavia -111,8 -108,0 -52,7 -300,8 -62,1 120,0 -336,3 -40,7 -10,8 -265,6 -13,0 -22,3 5,1 -128.8 -6,4 -13.1 -1.0 23.9 -39,4 -66,3 -208,9 25,6 -0,3 -509,8-101,0 22,4 0,7 -317,0 -148,0 -95,0 73,0 -200,4 - 1 930,0 -1381,0 -263,4
--1487,0 11,0 -963,0 -832.0 -751,0 - 1 376,0 467,0 -111,3 -114,4 -29,9 -296,5 -56,4 1 224,0 -162,5 -63,0 -15,7
—
-18,3 -19,5 -18,7 -95,2 -8,6 -12,3 3,7 154,7 -23,3 -43,8 -145,2 -10.6 -1,7 -89,0-4,5 1,2 2,0 -215,0 -201,0 -76,8 999,0 -164,7 - 1 866,0 974,0 -248,3
-2 05-2,0 -22,4 -876,0 -938,0 -578,0 -990,0 819,0 -126,8 -168,2 84,7 -306,3 -4,9 317,0 -86,0 -58,9 -16,0
—
-26,8 -4,2—
-74,8-—
3.2 -12,2 -2,7 -5,4 -146,9 -89.6 -0,3 -376,4--3,4 -2,3 9,0 -339,0 -259,0 42,1 -1901,0 -13,7 - 1 278,0 1 144,0 -35.7
—
-47,0 -0,1 -181,0--528,0 -1327,0 938,0 -64,1 -8,1 -39.3 -380,5 6,0 2936,0 -69,0 -53,6 -11.1 -215,8 -67,3 -16,7 25,3 -400,9 -23,2 -58,5 -15,0 -78,8 19,8 -137,0 -376,3 27,1 -23,3 396,0
—
117,6 -18,5 -26,5 724,0 274,0 182,1 3471,0 -687,4 - 5 254,0 -2536,0 -1677,6-2 50-2,0 -222,8 -1373,0 -1895,0 - 1 124,0 -2892,0 -770,0 -110,2 37,1 -27,1 -300,2 -57,9 4 192,0 33,3 -91,8 -12,6
--77,9 -9,2 0,7 -236,5 -26,6 -60,7 -8,0 -126,2 14,5 -102,5 -524,6 -7,5 -24,5 744,7
-107,8 -32,8 -30,0 656,0 222,0 196,2 4 159,0 -694,4 -4435,0 -2408,0 - 1 607,0
-4 578,0 -246,7 - 1 347,0 - 1 922,0 -853,0 - 2 893.0 -579,0 -97.9 15,0 53,1 -348,9 -34,7 2155,0 89,0 -64,0 -11,4
--73,7 -12,4
--251.1
--8,8 -261.0 46,1 -33,8 -482,4 -68,9 -27,3 130,9
-72,8 -32,4 -27,6 478,0 146,0 267,1 151,0 -588,6 -3419,0 - 1 637,0 -1214,1
_
1 064,0 -225,8 -909,0—
-797,0 -2633,0 -598,0 -175,9 -116.1 -92,0 -681.3 -46,1 3 056,0 -405,3 -94,3 -21,9 -481,4 -80,3 -39,0 30,4 -529,7 -29,6 -7Ί.5 -16,0 -54,9 -19,6 -203,3 -585,2 52,7 -23,5 -113,8-218,6 3,9 -26,9 407,0 126,0 87,1 3 544,0 -887,8 - 7 184,0 -3917,0 -1941,0
—
1015,0 -211,8 -2336,0 - 2 727,0 - 1 875,0 - 4 268,0 -303,0 -221,5 -77,3 -57,0 -596,7 -114,3 5 416,0 -129,2 -154,8 -28,3--96,2 -28,7 -18,0 -331,7 -35,2 -73,0 -4,3 28,5 -8,8 -146,3 -669.8 -18,1 -26,2 655,7
-112,3 -31,6 -28,1 441,0 21,0 119,4 5 158,0 -849,1 -6301,0 -1434,0 - 1 855,3
—
6 630,0 -269,1 -2223,0 -2860,0 -1431,0 - 3 883,0 240,0 -224,7 -143,2 137,8 -655,2 -39,6 2472,0 3,0 -122,9 -27,4--100,5 8,2
--325,9
--5,6 -273,2 43,4 -39,2 -629,3 -158.5 -27,6 -245,5
—
69,4 -34,7 -18,5 139,0 -113,0 309,2- 1 750,0 -602,3 - 4 697,0 -493,0 - 1 249,8
_
1017,0 -225,9 -1090,0-- 1 325,0 - 3 960,0 340,0 Mali Mauritania Maurice Mozambique Niger Nigeria Papouasie-Nouvelle-Gulnóe Rwanda
São Tomó et Principe Sénégal Seychelles Sierra Leone Salomon Somalie Saint-Christophe-et-Nevis Sainte-Lucie
I
The ACP countries
in the world
The 66 ACP States Les 66 États ACP
< ^
* ζ * &
Africa/Afriquer*£J
Mauritania
;ènégair
GuínéeV
) Côte-Yd'lvoire/
LSierra Leone
Gambia Cap Vert
¡; Djibouti.. .Somalia ) Rep.
centrafricaine
LTogo \ Guinee ,___ equatoriale *, "
Zaïre Rwanda/ Burundi*
Rep. of \ South Africa
jMalawi
If
»Swaziland
¿Lesotho
"V
^ ώ
"»Bahamas C a r i b b e a n / C a r a i b e s
St Chris. & Nevis Antigua-Barbuda - Dominica St Vincent & Q,st Lucia
Grenadines-/ «Barbados ' " Grenada*
' Trinidad 4 Tobago
Pacific/Pacifique
fe·**/* i =
New Guinea · χ _
Net official development assistance from DAC members
Aide publique au développement net des membres du CAD
100 = ODA to developing countries APD aux pays en développement
Other developing countries Autres pays en développement
ACP Pacific ACP Pacifique ACP Caribbean""^
ACP Africa ACP Afrique
1978 1982 1986
Population (Mio) National accounts: GNP per capita (USD) Comptes nationaux: PNB par habitant (USD)
Ώ
2 0 0 ·
1 5 0 ·
1 0 0 ·
5 0
0
-- « Indonesia
< Brazil
t Japan
^Λ Bangladesh
^ Pakistan
v Nigeria
- * Zaire ^ Tanzania / S u d a r
- * Kenya ^ Uganda -w~ Mozambique / G h a i
^ r ^ C a m e r o u n
1 8 0 0 0 ·
1 6 0 0 0 ·
14 0 0 0 ·
12 0 0 0 ·
1 0 0 0 0 ·
8 0 0 0 ·
6 0 0 0 ·
4 0 0 0 ·
2 0 0 0 ·
-
- « United Arab Emirates— USA
— Switzer - « Qatar
t- Norway ■ Kuwait
* L u x e m b o u r g "Canada
. Japan
1 Denmark
"-FR ol Gei
« Bahrain
- 4 Saudi Arabia
- * French Polynesia - M Libyan Arab. Rep ■** Singapore
>■ Bahamas
ι Trinidad and Tobago
* Barbados
< G a b o n
^t Suriname
* Seychelles « A n l i g u a B a r b u d a Fiji » SI Chris 8 Nevis * St Lucia
1985 1985
Population, national accounts: GNP per capita
Population, comptes nationaux: PNB par habitant
Population
Industrialized countries Pays industrialisés
1985
ACP Africa/ACP Afrique ACP Carlbbean/ACP Caraïbes ACP Pacific/ACP Pacifique
Other DC / Autres PVD
GNP per capita PNB par habitant
World Monde
Developing countries Pays en développement
OPEC OPEP
NonOPEC Non OPEP
ACP Africa ACP Afrique
ACP Caribbean ACP Caraïbes
ACP Pacific ACP Pacifique
1985
ΧΠ
(USD) 0
Production: Bananas (fresh), sugar (centrifugal), coffee (green) 1000 t
Production: bananes fraîches, sucre centrifugé, café vert 1000 t
ü
O
5 0 0 0 · ι
4 0 0 0 · '
2 4 0 0 - I
■ Brazil ■ India
■ Indonesia
« Thailand
« Burundi ■ Vietnam
* Colombia ■ Mexico
■ Panama ■ Tanzania ■ Papua N Guinea
I «■ Zaire | ~ « Angola
« Madagascar
| * Coted'lvoire ~^ Jamaica
* K e n y a
1985
t Brazil ' U S S R » Cuba
3 0 0 0 · ' 7 0 0 · '
» Mexico » FR of Germany •^Australia
■ Swaziland
ι Kenya
« Jamaica
* Ethiopia
* Colombia
• Indonesia
I * Côted'lvoire
I « U g a n d a
I « India
I « E t h i o p i a
I « Guatemala I — Costa Rica
I ^ C a m e r o u n | 5 K e n y a I " * Zaire J * Madagascar
I-—Tanzania Ι —ι Papua N.Guinea
1985 1985
Production: Bananas (fresh),
sugar (centrifugal), coffee (green) Production: bananes fraîches, sucre centrifugé, café vert
1985 Bananas (fresh)
Bananes fraîches
Industrialized countries Pays industrialises
ACP Africa/ACP Afrique ACP Caribbean/ACP Caraïbes ACP Pacific/ACP Pacifique
Other DC / Autres PVD
Sugar (centrifugal) Sucre centrifugé
industrialized countries Pays industrialises
ACP Africa/ACP Afrique ACP Caribbean/ACP Caraïbes ACP Pacific/ACP Pacifique
Other DC / Autres PVP
Coffee (green) Café vert
Other DC / Autres PVD
Production: Tea, cocoa beans, groundnuts (in shell), 1 000 t
Production: thé, fèves de cacao, arachides non décortiquées, 1 000 t
m
■ India
« China
« Sri Lanka
■ USSR
« Kenya
■ Turkey ■ Indonesia
Ι -Λ Argentina Ι - « Bangladesh I — I r a n/ M a l a w i
^ T a n z a n i a ^ B ^ Z i m b a b w e ^ H ^ M o z a m b i q u e
Τ R w a n d a | * P a p u a N. Gum
►-Mauritius
■ v*Uganda I * · Z a i r e
1985
6 0 0
5 0 0
Ecuador
C a m e r o u n
1 0 0 · ^ | ^ Nigeria
Malaysia
■ Dominican Rep
« IndnnR.iia ι Papua N.Guinea
« Venezuela
« Sierra Leone « Equatorial Guinea
1985
1 0 0 0 ·1
8 0 0 ·
■ China < India
- . Indonesia
ι Nigeria < Sonegai
| * South Africa ι Malawi * Thailand ■ > Cameroun 1 ^ Rep. Centrafricaine
* Ghana
* Gambia Burkina Faso
Production: Tea, cocoa beans,
groundnuts (in shell) Production: thé, fèves de cacao arachides non décortiquées
1985 Tea
Thé
Industrialized countries Pays industrialisés
ACP Africa/ACP Afrique ACP Pacific/ACP Pacifique
Other DC / Autres PVD
Cocoa beans Fèves de cacao
Other DC / Autres PVD
ACP Pacific/ACP Pacifique ACP Caribbean/ACP Caraïbes
ACP Africa/ACP Afrique
Groundnuts (in shell) Arachides non décortiquées
Industrialized countries Pays industrialisés
ACP Africa/ACP Afrique ACP Caribbean/ACP Caraïbes ACP Pacific/ACP Pacifique E C / C E
Other DC / Autres PVD
Production: Cotton (lint), ¡ron ore (Fe content),
copper ore (Cu content), 1 000 t
Production: fibres de coton, minerai de fer (Fe contenu), minerai de cuivre (Cu contenu), 1 000 t
Ξ
4 0 0 0 ·
3 0 0 0 ·
2 0 0 0 ·
1 0 0 0 ·
5 0 0 ·
- « China
- < U S A - * U S S R
- * India - « Pakistan - * Brazil
- « E g y p t
«ι Z i m b a b w e
-«ι Côted'lvoire | ^ > Mali ■* , Burkina Faso
/ L C a m e r o u n S T c h a d
* Tanzania „ S * B e n i n
^ Zaïre
«ι China " - ■ Australia
4 0 0 0 0 ·
3 0 0 0 0 ·
2 0 0 0 0 ·
- ■ India
■— Canada
« South Africa ■ Sweden
1 2 0 0 ·
1 0 0 0 ·
8 0 0 ·
6 0 0 ·
•
4 0 0 ·
2 0 0 ·
« USA
« USSR
■*■ Zambia
- « Zaire
-Λ Australia Philippines - « South Africa ^ Mexico
Papua N.Guinea
Production: Cotton (lint), iron ore (Fe content),
copper ore (Cu content) 1985
Production: fibres de coton, mineral de fer (Fe contenu), minerai de cuivre (Cu contenu)
Cotton (lint) ^ _ _ Fibres de coton y^Xi:
Industrialized countries / Pays industrialisés /
^ ^ ACP Atrlca/ACP Afrique ^ » 7 \ EC / CE
/ Other DC / Autres PVD
Iron-ore (Fe content)
Minerai de fer (Fe contenu) ^ " ^
Industrialized countries ƒ Pays industrialisés
Copper-ore (Cu content) —. Minerai de cuivre (Cu contenu) ,^"""^
Industrialized countries f ;
Pays industrialisés
^ ^ ^ ACP Africa/ACP Afrique
"77 \ EC/CE
' Other DC / Autres PVD
^ ^ ^ ACP Africa/ACP Afrique ^ ^ ^ ACP Pacific/ACP Pacifique
XX EC / CE