COMMISSION OF THE EUROPEAN COMMUNITIES
Brussels, 5.1.2005 SEC(2004) 1720
COMMISSION STAFF WORKING DOCUMENT
Technical Annexes to the
Report from the Commission on the Implementation of the Gas and Electricity Internal Market
ANNEX 1 SUMMARY INFORMATION IMPLEMENTATION SUMMARY
Electricity Gas
Market opening
size of open market TWh
eligibility threshold
unbundling Market
opening
size of open market bcm
eligibility
threshold unbundling
TSO DSOs TSO DSOs
Austria 100% 55 - leg. leg. 100% 7 - leg. leg.
Belgium c.90% 60 1 leg. leg. c.90% 11 1 leg. leg.
Denmark 100% 33 - leg. leg. 100% 5 - own. leg.
Finland 100% 80 - own. acc.
France 70% 275 non HH leg. man. 70% 28 non HH leg. acc.
Germany 100% 500 - leg. acc. 100% 82 - acc.2 acc.
Greece 62% 29 non HH3 leg. none
Ireland 56% 12 1GWh leg. man. 86% 3 0.5 mcm man. man.
Italy 79% 225 non HH own. leg. 100% 62 - leg. leg.
Luxembourg 57% 3 20GWh man. man. 72% 1 15mcm man. man.
Netherlands 100% 100 - own. leg. 100% 38 - leg. leg.
Portugal 100% 42 - own. acc.
Spain 100% 210 - own. leg. 100% 20 - leg. leg.
Sweden 100% 135 - own leg. 50%4 1 15mcm acc. acc.
UK 5 100% 335 - own. leg. 100% 95 - own. own.
Norway 100% 110 - own. leg.\acc.
Estonia 10% 1 40 GWh leg. leg. 95% 1 non HH acc. acc.
Latvia 76% 4 non HH acc. acc. 0% 0 - acc. acc.
Lithuania n.k. n.k. leg. leg. 70% 2 1mcm acc. acc.
Poland 52% 50 1 GWh leg. acc. 34% 4 15mcm leg. acc.
Czech R 47% 25 6 leg. acc. 0% 0 - none. none.
Slovakia 66% 15 non HH leg. man. 34% 2 15mcm man. man.
Hungary 67% 22 non HH leg. acc. 69% 8 non HH leg. acc.
Slovenia 75% 10 non HH leg. acc. 91% 1 non HH leg. acc.
Cyprus 35% 1 350MWh man. none
Malta 0% 0 n.a. 7
1 Full market opening in the Flanders region. non households (non HH) in other regions
2 some legal unbundling on a voluntary basis
3 All customers in non-interconnected islands are non-eligible
4 95% from 1 Jan 2005, all non-households
5 In Northern Ireland, the electricity market is open to non-households.
Electricity Gas
Market opening
size of open market TWh
eligibility threshold
unbundling Market
opening
size of open market bcm
eligibility
threshold unbundling
Candidate Countries
Romania 33% 25 40GWh leg. man. 40% 5 3mcm leg. acc.
Bulgaria 22% 5 40GWh acc. acc. 82% 2 20mcm8 acc. acc. Turkey 29% 30 7.8GWh leg. acc. 80% 12 1mcm leg. leg.
Croatia 0% 0 - none none
Other Neighbouring Countries
Bosnia 0% 0 - none none
Serbia\Mont. 0% 0 - none none
FYROM 18% 100KV none none
Albania 8% 50GWh leg. man.
source: Information provided by Regulators\Member States
PRICE COMPARISONS
Graph 1 End-user Electricity Price Comparison: July 2004 9
BE DK DE GR ES FR IE IT LU AT PT FI SE UK NO CZ EE CY LV LT HU MA PO SI SK EU15 40 50 60 70 80 90 100 110 120 130 140
35 40 45 50 55 60 65 70 75 80 85
Euro/MWh large users
E u ro /M W h s m a ll u s e rs
Graph 2 End-User Gas Prices Comparison: July 2004 10
BE DK DE FR LU PT SE UK EU15 CZ EE LVLT HU PO SI SK AT 15 20 25 30 35 40 45 50
10 12 14 16 18 20 22 24 26
Euro/MWh large users
E u ro /M W h s m a ll u s e rs ES Source: Eurostat 9
“Large”: average Eurostat price for Ie and Ig standard consumers. “Small”: average Eurostat price for Ib, Dc and Dd standard consumers. Prices are reported net of all taxes.
Prices for Germany include municipal charges for rights of way.
10
SWITCHING ESTIMATES: ELECTRICITY
Large eligible industrial users11 Small commercial/ Domestic since market
opening
during 2003 since market opening
during 2003
Austria 22%12 7% 3% 1%
Belgium 35% 8% 19%13 19%
Denmark > 50% 22% 5% 5%
Finland > 50% 16% n.k. 4%
France 22% n.k.
Germany 35%14 n.k. 6%15 n.k.
Greece 0% 0%
Ireland >50% 6% 1% 1%
Italy c. 15% n.k.
Luxembourg 10% n.k.
Netherlands 30% n.k. 35% n.k.
Portugal 9%16 7% 1% 1%
Spain 18% 5% 0%17 0%
Sweden >50% 5% n.k. 10%
UK >50% n.k. >50% 22%
Norway >50% 15% >50% 19%
Estonia 0% 0%
Latvia 0% 0%
Lithuania 17% 17%
Poland 10% 7%
Czech R n.k. n.k.
Slovakia 10% 3% 4% n.k.
Hungary 24% 19%
Slovenia 10% 10%
Cyprus 0% 0%
Malta 0% 0%
Candidate Countries
Romania 24% 13%
Bulgaria 0%18 0%
Turkey 2% 2%
Croatia 0% n.k.
Other Neighbouring Countries
Bosnia 0% 0%
Serbia\Mont. 0% 0%
FYROM 0% 0%
Albania 0% 0%
source: Information provided by Regulators.
11
in general this refers to clients consuming more than 1GWh/year
12
100% have renegotiated with their existing supplier
13
Flanders region only
14
The remaining approximately 65% have renegotiated with their existing supplier
15
A further approximately 25-50% have renegotiated with their existing supplier
16
Corresponds to 19% of high voltage customers’ consumption
17
Approximately 18% have renegotiated with their existing supplier
SWITCHING ESTIMATES: GAS
Large eligible industrial users Small commercial/ Domestic since market
opening
during 2003 since market opening
during 2003
Austria 9% 9% 0.5% 0.5%
Belgium19 60% n.a. 4% 4%
Denmark 30% 3% 20
France 25% 5%
Germany 7% n.k. <2% 0%
Ireland >50% 1%
Italy 30% n.k. 35% 35%
Luxembourg <5% n.k.
Netherlands c.30% n.k. 2% n.k.
Spain >50% 22% 5% 5%
Sweden n.k. n.k.
UK >50% 19% 47% 13%
Estonia 20% 0%
Latvia 0% 0%
Lithuania 0% 0%
Poland 0% 0%
Czech R 0% 0%
Slovakia 0% 0%
Hungary 5% 5%
Slovenia 0% 0%
Candidate Countries
Croatia 0% 0%
Romania >50% >50%
Bulgaria 0% 0%
Turkey n.k. n.k.
source: Information provided by Regulators.
19
Large users: Flanders 90%, Wallonie 40%, Small users: Flanders only
PRODUCTIVITY IMPROVEMENTS IN THE UTILITY SECTOR
Annual labour productivity growth electricity gas and water supply (% per annum 1990-2001, EU15 countries)
1990-95 1995-2001
Austria 3.5 3.5
Belgium 4.4 6.3
Denmark 5.4 n.k.
Finland 7.9 5.4
France 2.2 3.6
Germany 3.5 6.2
Greece 2.0 5.5
Ireland 18.2 7.9
Italy 3.2 3.6
Luxembourg 5.2 5.4
Netherlands 1.9 4.5
Portugal 8.7 14.4
Spain 1.7 5.5
Sweden 1.6 0.6
UK 5.2 10.4
source: DG ENTR report21
21
PRESENCE OF LARGEST COMPANIES IN SELECTED INDIVIDUAL MEMBER STATES
Electricity Gas
Company LARGEST OTHER SIGNIFICANT largest OTHER SIGNIFICANT
Austria VERBUND RWE, EON, EDF OMV GDF, RWE
Belgium E-BEL EDF, ESSENT, NUON, CENTRICA DISTRIGAS ESSENT, NUON, CENTRICA
Denmark ELSAM E2, VF, EON DONG
Finland FORTUM VF, EON GASUM
France EDF E-BEL, ENDESA GDF TOTAL
Germany RWE EON, VF, EDF EON WINGAS, RWE, EXXON, SHELL
Greece PPC DEPA
Ireland ESB NIE (Viridian) BGE RWE
Italy ENEL E-BEL, ENDESA, EDISON, VERBUND ENI EDISON
Netherlands E-BEL ESSENT, NUON, EON SHELL EXXON
Portugal EDP ENDESA GDP
Spain ENDESA IBERDROLA, EDP, ENEL, UNION FENOSA GAS. NAT BP , IBERDROLA, CEPSA
Sweden VF EON, FORTUM EON DONG,
UK EDF , EON, RWE, CENTRICA CENTRICA SHELL, EXXON, BP, EON, EDF, RWE
Poland BOT PKE, PAK, E-BEL, EDF PGNIG
Czech R CEZ RWE, EON RWE EON
Slovakia ENEL TEKO, RWE, EDF, EON SPP (GDF, EON)
Hungary MVM EDF, EON, RWE MOL GDF, RWE, EON, ENI
Slovenia HSE GEOPLIN
ANNEX 2 Unbundling and Network Access: Electricity Background
Fair network access conditions are crucial for the development of a competitive market. This refers to both the use of physical network access as well as for ancillary services such as the provision of balancing energy. In order to ensure this, the new Directives require regulation of the methodologies used to set charges for these services and the legal and functional unbundling of both transmission and distribution networks operators.
Unbundling
Table 2.1 below shows the latest position for the unbundling of the electricity network businesses.
Table 2.1 Unbundling of Network Operators: Electricity22
Basic unbundling model
Published accounts
Compliance
officer23
Separate corporate identity
Separate locations
TSO DSO TSO DSO TSO DSO TSO DSO TSO DSO
Total Yes
Austria L L Y Y Y Y Y N Y N 6
Belgium L L24 Y Y Y Y25 Y Y Y Y24 7
Denmark L L Y Y Y Y Y N Y N 6
Finland O A Y Y Y N Y N Y large 5½
France L M Y N Y Y Y N Y N 5
Germany L A Y Y Y N Y N Y partly 5½
Greece L N N N N N Y N N N 1
Ireland L/M M Y Y N Y Y Y Y N 6
Italy O L Y Y Y Y Y N Y N 6
Lux M M Y Y N N N N N N 2
Neth O L Y Y Y Y Y N Y N 6
Portugal O A Y Y Y Y Y N Y Y 7
Spain O L Y Y Y Y Y Y Y N 7
Sweden O L Y Y Y N Y Y Y Y 7
UK O L Y Y Y Y Y often Y Y 7½
Norway O L/A Y Y Y N Y N Y N 5
Estonia L L Y Y Y Y N N Y N 5
Latvia A A Y Y Y Y N N Y Y 6
Lithuania L L Y Y Y Y Y N Y Y 7
Poland L A Y N N N Y N Y N 3
Czech R L A Y Y N N Y Y Y N 5
Slovakia L M Y Y N N Y N Y ? 4
Hungary L A Y Y N N Y N Y N 4
Slovenia L A Y Y N N Y N Y N 4
Cyprus M N Y N Y Y N N N N 3
Malta A Y N N N 1
22
Ownership, Legal, Management, Accounts. L/M means system operator is legally unbundled, system owner management unbundled
23
If ownership unbundled, automatically set to “Y”
24
Brussels region not yet legally unbundled
Candidate Countries
Romania L M Y Y Y N Y N Y Y 6
Bulgaria A A Y Y Y Y N N N N 4
Turkey L A Y Y N N Y N Y N 4
Croatia N N N n.k. N n.k. N n.k. N n.k. 0
Other Neighbouring Countries
Bosnia N N N n.k. N n.k. N n.k. N n.k. 0
Serb\Mont. N N N N N N N N N N 0
FYROM N N N n.k. N n.k. N n.k. N n.k. 0
Albania L M Y Y Y N Y N Y N 5
source: Regulators
These show that, for the transmission system, almost all Member States are compliant with the requirements of the Directive. There is also a relatively high degree of management unbundling of these companies in terms of the four indicators chosen.
Other than for their accounts, distribution system operators do not need to be unbundled until 2007 and a number of Member States have not yet taken this step. In addition, for most Member States distribution would appear to be still integrated with the supply businesses in management terms and these are still organised by municipal government agencies. Only a few have a separate corporate identity or location.
Network Access
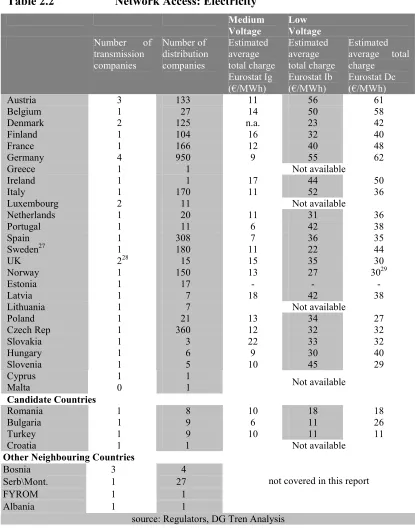
[image:10.595.68.521.95.226.2]Strict rules on unbundling are required to ensure that network access charges are cost reflective and do not contain hidden cross subsidies. A key task of regulators is, therefore; too ensure that network operators do not earn excessive profits. Otherwise this may enable, for example, vertically integrated companies to run their affiliated supply business at a loss and allow predatory pricing. Regulators also need to ensure appropriate cost allocation on shared services and that tariff structures are non-discriminatory and apply equally to all network users, including affiliated and non-affiliated suppliers.
Table 2.2 Network Access: Electricity26 Medium Voltage
Low Voltage
Number of transmission companies Number of distribution companies Estimated average total charge Eurostat Ig (€/MWh) Estimated average total charge Eurostat Ib (€/MWh) Estimated average total charge
Eurostat Dc (€/MWh)
Austria 3 133 11 56 61
Belgium 1 27 14 50 58
Denmark 2 125 n.a. 23 42
Finland 1 104 16 32 40
France 1 166 12 40 48
Germany 4 950 9 55 62
Greece 1 1 Not available
Ireland 1 1 17 44 50
Italy 1 170 11 52 36
Luxembourg 2 11 Not available
Netherlands 1 20 11 31 36
Portugal 1 11 6 42 38
Spain 1 308 7 36 35
Sweden27 1 180 11 22 44
UK 228 15 15 35 30
Norway 1 150 13 27 3029
Estonia 1 17 - - -
Latvia 1 7 18 42 38
Lithuania 1 7 Not available
Poland 1 21 13 34 27
Czech Rep 1 360 12 32 32
Slovakia 1 3 22 33 32
Hungary 1 6 9 30 40
Slovenia 1 5 10 45 29
Cyprus 1 1
Malta 0 1 Not available
Candidate Countries
Romania 1 8 10 18 18
Bulgaria 1 9 6 11 26
Turkey 1 9 10 11 11
Croatia 1 1 Not available
Other Neighbouring Countries
Bosnia 3 4
Serb\Mont. 1 27
FYROM 1 1
Albania 1 1
not covered in this report
source: Regulators, DG Tren Analysis
26
Charges are estimated excluding all taxes and levies. Both transmission and distribution charges are included
27
Based on STEM examples: 5GWh, 30MWh, and 5000KWh consumers
28
National Grid will shortly be appointed as system operator for Great Britain as a whole
29
Balancing
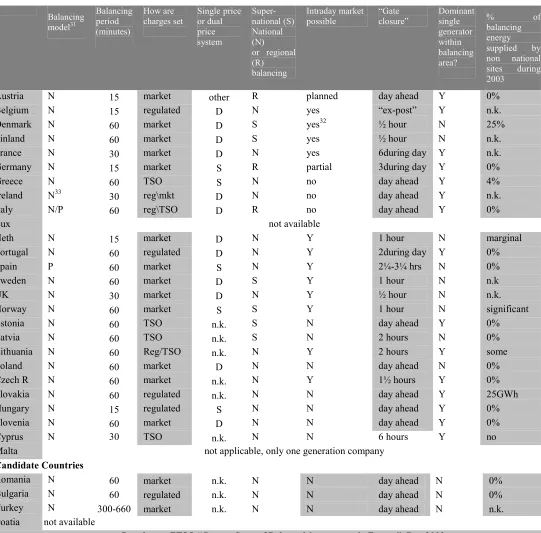
The conditions for the provision of balancing energy also make a vital contribution to the functioning of the electricity market. This is because electricity suppliers will not always be able to exactly match the quantity of power they inject into the network with the amount being used by their customers. This balancing service is fulfilled by the transmission system operators which, in turn, call on other generators in the market to provide the appropriate back-up. In the Directive, regulators are required to approve the methodology used to determine balancing prices. They may also intervene ex-post in requiring such charges to be revised.
There are two main models adopted for the trading of electricity on the wholesale market in the EU, which affect the way balancing is organised. Most Member States organise trading on the basis of bilateral contracts between generators and suppliers or between generators and large industrial users. Where a supplier has not purchased a sufficient amount to cover the needs of its customers in any period, that supplier is out of balance. It therefore has to pay for extra energy to be injected by the TSO. The TSO, in turn, procures this electricity from the other generators in the market through a market process known as a “net pool”.
The price paid by the out-of-balance supplier is often determined on the basis of the price at which the other generators offer balancing energy to the TSO. A further distinction is then whether there is a dual price system or a single price system. In the former, the price paid by suppliers which are “short” of energy is different to the price received by those which are “long” in energy. This maintains incentives on all suppliers to remain in balance. In a single price system, the same reference price is used for both “long” and “short” suppliers. In this case the TSO acts rather as a go-between through which those companies offering balancing energy buy from\ sell to other suppliers.
The other approach to electricity trading, mainly used in Spain is for all exchanges of electricity to be conducted via a “mandatory pool”.30 This means that suppliers purchase all their energy in this way, including the energy required to cover any imbalances (both up and down) and, to an extent, the costs associated with balancing are socialised. Depending on how this is designed, this approach may tend to reduce the risks to new suppliers entering the market. At the same time, however, it may be a more costly scheme overall since network users have less incentive to minimise imbalances. A summary of the main balancing conditions is contained in Table 2.3 below.
30
Table 2.3 Electricity Balancing Arrangements Balancing model31 Balancing period (minutes) How are charges set Single price or dual price system Super-national (S) National (N) or regional (R) balancing Intraday market possible “Gate closure” Dominant single generator within balancing area?
% of
balancing energy supplied by non national sites during 2003
Austria N 15 market other R planned day ahead Y 0%
Belgium N 15 regulated D N yes “ex-post” Y n.k.
Denmark N 60 market D S yes32 ½ hour N 25%
Finland N 60 market D S yes ½ hour N n.k.
France N 30 market D N yes 6during day Y n.k.
Germany N 15 market S R partial 3during day Y 0%
Greece N 60 TSO S N no day ahead Y 4%
Ireland N33 30 reg\mkt D N no day ahead Y n.k.
Italy N/P 60 reg\TSO D R no day ahead Y 0%
Lux not available
Neth N 15 market D N Y 1 hour N marginal
Portugal N 60 regulated D N Y 2during day Y 0%
Spain P 60 market S N Y 2¼-3¼ hrs N 0%
Sweden N 60 market D S Y 1 hour N n.k
UK N 30 market D N Y ½ hour N n.k.
Norway N 60 market S S Y 1 hour N significant
Estonia N 60 TSO n.k. S N day ahead Y 0%
Latvia N 60 TSO n.k. S N 2 hours N 0%
Lithuania N 60 Reg/TSO n.k. N Y 2 hours Y some
Poland N 60 market D N N day ahead N 0%
Czech R N 60 market n.k. N Y 1½ hours Y 0%
Slovakia N 60 regulated n.k. N N day ahead Y 25GWh
Hungary N 15 regulated S N N day ahead Y 0%
Slovenia N 60 market D N N day ahead Y 0%
Cyprus N 30 TSO n.k. N N 6 hours Y no
Malta not applicable, only one generation company
Candidate Countries
Romania N 60 market n.k. N N day ahead N 0%
Bulgaria N 60 regulated n.k. N N day ahead N 0%
Turkey N 300-660 market n.k. N N day ahead N n.k.
Croatia not available
source: Regulators, ETSO “Current State of Balance Management in Europe”, Dec 2003
Balancing arrangements may cause problems for new suppliers for a number of reasons. For example, if the price for balancing energy is determined in a market framework, and there are
31
N – bilateral trading and “net Pool” balancing market, P – “gross Pool”
32
for Denmark east region
only one or two generators in a position to provide balancing services, the price charged may be unreasonable.
The graphs below show an example of the prices paid for balancing energy in selected Member States during the month September 2004. The graph on the left shows the price paid
to TSOs in the event that the supplier does not have electricity injected to cover demand. The graph on the right shows the price paid by TSOs in the event that too much electricity has been injected by a particular supplier. The further these two prices are apart, the greater the potential costs to suppliers where unexpected events occur.
These graphs shows unfavourable conditions in a number of Member States, in particular where there are large differences between the buy and sell price prevailing in the country concerned. High prices to buy energy at periods of low demand, for example during the night need to be carefully examined by regulators when they assess the methodology being used to determine these.
Graph 2.1 Prices for balancing energy in selected Member States, average for 1-30 September 2004
Paid to TSO for balance upwards Paid by TSO for balance downwards
0.00 20.00 40.00 60.00 80.00 100.00 120.00 140.00 160.00
1 2 3 4 5 6 7 8 9 10 11 12 13 14 15 16 17 18 19 20 21 22 23 24
hour
€/M
W
h
BE FR NL UK AT
CZ Bemax DE avg IE
0.00 20.00 40.00 60.00 80.00 100.00 120.00 140.00 160.00
1 2 3 4 5 6 7 8 9 10 11 12 13 14 15 16 17 18 19 20 21 22 23 24
hour
€/M
W
h
AT BE BE min Nordic avg DE FR
IE NL UK CZ HU
source: TSO websites
Problems raised by large differences between the buy and sell price are exacerbated if there are insufficient opportunities for a supply company to minimise its imbalances through normal trading. If nominations cannot be modified close to real time and there is no intraday market, the supplier may find itself penalised for a imbalance that it could have resolved if more time was available. Even if trading opportunities are available, the concentrated structure in many Member States may also put new entrants at a disadvantage since they are forced into an unsatisfactory choice between trading with their main incumbent competitors, or being subject to balancing charges which their competitors also have a strong role in determining.
In such circumstances direct regulatory involvement may be preferable. However at the very least, balancing markets need close regulatory supervision to ensure that the incumbent companies are not abusing their dominant position in the balancing market. In some cases it is still seen as appropriate for regulators to directly control the price at which balancing services are provided.
In the medium term, significant improvements could be realised by integrating smaller balancing areas into larger blocks, both within and between Member States. This would improve the market structure considerably. The Nordic market has a partially integrated balancing market and measures are being considered between Germany and Austria. The introduction of demand side bidding has also been shown to bring about significant benefits.
Conclusions
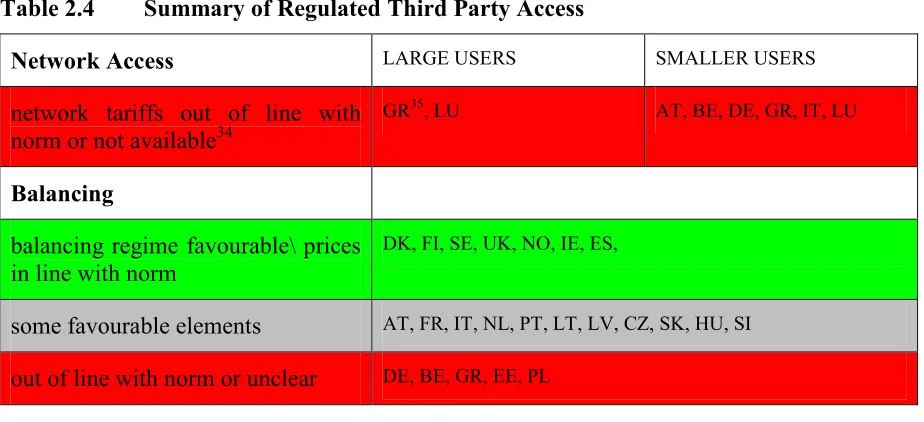
[image:15.595.71.533.485.696.2]Network Access conditions will need to be carefully overseen by national regulators to ensure non-discrimination. Suppliers need to have the confidence that the conditions they face in using the network are identical to those faced by other network users, including companies which are affiliated to the operators of those networks. The information reviewed above on network access and unbundling issues can be summarised in the table below.
Table 2.4 Summary of Regulated Third Party Access
Network Access LARGE USERS SMALLER USERS
network tariffs out of line with norm or not available34
GR35, LU AT, BE, DE, GR, IT, LU
Balancing
balancing regime favourable\ prices in line with norm
DK, FI, SE, UK, NO, IE, ES,
some favourable elements AT, FR, IT, NL, PT, LT, LV, CZ, SK, HU, SI
out of line with norm or unclear DE, BE, GR, EE, PL
34
out of line implies a tariff significantly above €15/MWh for a large user connected at medium voltage and significantly above €40/MWh for a small users connected at low voltage.
The unbundling of distribution system operators from supply companies would still appear to be inadequate to ensure competition in many Member States, particularly for households and small commercial customers. It is this area of restructuring which now needs to be the focus of Member States and regulators.
ANNEX 3 Competition in the Electricity Sector Background
A successful competitive market is more likely to develop where there are a sufficient number of players in both the generation and supply market. Where only a small number exist, the market may lack credibility with final customers and there will inevitably be concerns that prices are not determined competitively. This may then mean greater regulation of wholesale and retail markets than is necessary or desirable. This is why it is of the highest importance to establish a really integrated European energy market with the minimum of physical constraints and with no artificial barriers to trade such as market rules, access to grid conditions and customer switching practices. This would result in a significantly higher number of potentially competitive market participants.
Generation Market Structure
The key to the overall market structure is the generation sector. Experience in the electricity market to date has shown that there is a general tendency for integration between generation companies and supply companies in order to avoid exposure to risk. It therefore seems likely that, without regulatory intervention, the market structure in generation will be reflected into the structure of retail supply.
Therefore, where generation capacity is concentrated in the hands of one, or a few companies, it is likely that the real possibility of consumers to switch supplier will be limited. This may in turn affect the performance of the market since companies will be able to keep prices higher than otherwise without fear of losing their share of the market.
Development of liquid wholesale markets
Liquid wholesale markets are an important component of competition in the electricity market. They are important since they offer the possibility for companies to purchase or sell electricity on reasonable terms in the event that their generation and supply portfolios do not match, for example where plant is offline or still being built. Without liquid markets, companies inevitably have to turn to other generators on an individual basis to provide such a back-up service. This means they, in effect, have to buy from their competitors, which will put new entrants at a significant disadvantage.
Establishing a liquid market is much easier if there are a sufficient number of competitors since, in this case, there would be a general desire of all market actors to trade in such a way and no company would be able to gain an advantage through restricting the amount of capacity that it made available to other companies for purchase. This is something of an idealised solution and even well developed markets have to be carefully monitored to ensure companies are not seeking to take advantage of a privileged position in a certain location or time period.
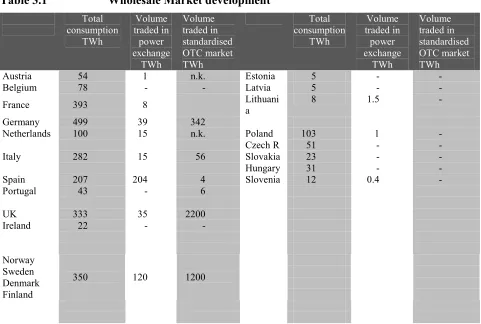
Table 3.1 Wholesale Market development
Total consumption
TWh
Volume traded in
power exchange
TWh
Volume traded in standardised OTC market TWh
Total consumption
TWh
Volume traded in
power exchange
TWh
Volume traded in standardised OTC market TWh
Austria 54 1 n.k. Estonia 5 - -
Belgium 78 - - Latvia 5 - -
France 393 8 Lithuani
a
8 1.5 -
Germany 499 39 342
Netherlands 100 15 n.k. Poland 103 1 -
Czech R 51 - -
Italy 282 15 56 Slovakia 23 - -
Hungary 31 - -
Spain 207 204 4 Slovenia 12 0.4 -
Portugal 43 - 6
UK 333 35 2200
Ireland 22 - -
Norway Sweden Denmark Finland
350 120 1200
source: Regulators’ and electricity market participants’ submissions
The degree of liquidity in spot markets and bilateral markets is summarised in Table 3.1 below. Ideally, spot markets should have enough liquidity to give a reliable and transparent price signal. Meanwhile trading in “over the counter” (OTC) markets normally needs to be several times the volume of actual consumption in order for participants to trade without risking that particular individual transactions cause a shift in the market. The normal benchmark from other commodity markets is that the volume of trade should be roughly 10 times the amount of physical deliver. Table 3.1 above shows that only a few markets, that is the UK and Nordic markets, are approaching this level.
Interconnection and development of regional markets
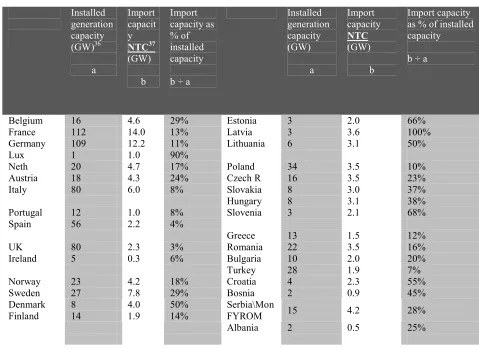
Building larger markets would help correct some of the problems associated with an inappropriate market structure. For example, as part of a larger regional market, the market positions of big incumbents such as EDF, EON and RWE would be smaller. Integration of national electricity markets requires additional infrastructure as well as clear and consistent rules concerning the allocation of capacity and the interaction of congestion management with the electricity wholesale market.
Table 3.2 Interconnection and Market Structure
Installed generation capacity (GW)36
a
Import capacit y
NTC37
(GW)
b
Import capacity as % of installed capacity
b ÷ a
Installed generation capacity (GW)
a
Import capacity
NTC
(GW)
b
Import capacity as % of installed capacity
b ÷ a
Belgium 16 4.6 29% Estonia 3 2.0 66%
France 112 14.0 13% Latvia 3 3.6 100%
Germany 109 12.2 11% Lithuania 6 3.1 50%
Lux 1 1.0 90%
Neth 20 4.7 17% Poland 34 3.5 10%
Austria 18 4.3 24% Czech R 16 3.5 23%
Italy 80 6.0 8% Slovakia 8 3.0 37%
Hungary 8 3.1 38%
Portugal 12 1.0 8% Slovenia 3 2.1 68%
Spain 56 2.2 4%
Greece 13 1.5 12%
UK 80 2.3 3% Romania 22 3.5 16%
Ireland 5 0.3 6% Bulgaria 10 2.0 20%
Turkey 28 1.9 7%
Norway 23 4.2 18% Croatia 4 2.3 55%
Sweden 27 7.8 29% Bosnia 2 0.9 45%
Denmark 8 4.0 50% Serbia\Mon
Finland 14 1.9 14% FYROM 15 4.2 28%
Albania 2 0.5 25%
Current Market Structure
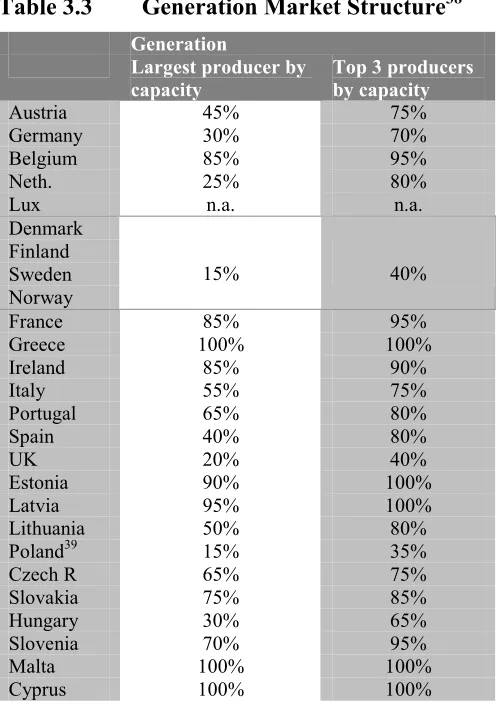
Table 3.3 overleaf depicts the current market structure in a selection of national and regional markets. Successful markets, such as the Nordic and UK market, have between five and ten major competitors, plus a range of fringe companies in the generation sector. In these circumstances it would appear that customers have a reasonable appreciation that a competitive market exists, both when prices are increasing as well as when they are falling. In other countries and regions market structure is less advantageous, particularly where individual Member States’ electricity markets are not sufficiently integrated with each other. Furthermore, many of the electricity generation markets in new Member States are characterised by the continuation of long term power purchase agreements. Thus, although there might appear to be an reasonable number of generation market participants in, for example Poland or Hungary, there is in fact very little scope for competition. The challenge for these countries is to both restructure these contracts and to achieve greater integration of their markets.
36
UCTE July 2003 forecast, Nordel winter 2003-4 forecast, NGCand ESBNG 7 year statement.
37
The integration of individual electricity markets makes an important contribution to customers’ confidence in the market. In particular it will lead to an increase in the liquidity of wholesale markets, greater credibility of the prices that result, and a larger range of different contract structures.
Table 3.3 Generation Market Structure38 Generation
Largest producer by capacity
Top 3 producers by capacity
Austria 45% 75%
Germany 30% 70%
Belgium 85% 95%
Neth. 25% 80%
Lux n.a. n.a.
Denmark Finland Sweden Norway
15% 40%
France 85% 95%
Greece 100% 100%
Ireland 85% 90%
Italy 55% 75%
Portugal 65% 80%
Spain 40% 80%
UK 20% 40%
Estonia 90% 100%
Latvia 95% 100%
Lithuania 50% 80%
Poland39 15% 35%
Czech R 65% 75%
Slovakia 75% 85%
Hungary 30% 65%
Slovenia 70% 95%
Malta 100% 100%
Cyprus 100% 100%
Wholesale market developments and market surveillance
Recent price developments in wholesale markets have been the subject of much discussion. As shown by the graphs below, prices in these markets have increased from roughly €20-25/MWh in early 2003 to around €30-35/MWh today. Although prices have been volatile, a much more stable pattern has emerged since the beginning of 2004.
38
rounded to nearest 5%
39
Graph 3.1 Wholesale electricity prices: day-ahead spot price July 2002 – November 2004
0 10 20 30 40 50 60 70 80 90
Jan-03 Jul-03 Jan-04 Jul-04
E
u
ro
\M
W
h
France(Powernext) Nordpool EEX\EXAA average
NL(APX) Spain(OMEL) UKPX
Italy Slovenia(Borzen) Poland(Gielda)
source: relevant power exchange websites
Graph 3.2 Wholesale electricity prices: Forward base-load for calendar year ahead
However, forward prices for electricity to be delivered on a “year-ahead” basis demonstrated a significant increase in 2003 which has also continued into 2004 especially in the Dutch and UK markets. Prices have also increased in the non-standardised bilateral OTC market reported by market monitoring agencies. These increases appear to be the result of very high natural gas prices expected for the winter 2004-05 period in the UK which was the subject of an investigation from the regulator.
Price increases are always likely to be questioned by consumers and there may be concerns about market power. Such concerns may arise naturally from the market structure and way the market is organised in each Member State without there necessarily being any illicit behaviour. Alternatively, the possibility exists that market participants are deliberately acting in a way to inflate prices directly or indirectly by influencing other competitive conditions. Clearly, at the same time, price movements might also be caused by shifts in the supply-demand position as well as overall trends in global energy prices.
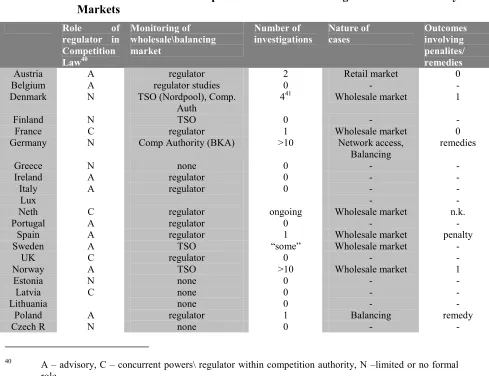
[image:22.595.66.555.367.743.2]Therefore, the situation needs to be closely monitored. In most cases, this type of market surveillance is the task of the competition authority in the Member States concerned, although the regulatory authority is usually consulted or involved in some other way. These are summarised in Table 3.4 below, including an indication of the quantity and nature of investigations and enquiries into competition issues.
Table 3.4 Interaction between Competition Authorities \ Regulators in Electricity Markets
Role of regulator in Competition Law40
Monitoring of wholesale\balancing market
Number of investigations
Nature of cases
Outcomes involving penalites/ remedies
Austria A regulator 2 Retail market 0
Belgium A regulator studies 0 - -
Denmark N TSO (Nordpool), Comp.
Auth
441 Wholesale market 1
Finland N TSO 0 - -
France C regulator 1 Wholesale market 0
Germany N Comp Authority (BKA) >10 Network access,
Balancing
remedies
Greece N none 0 - -
Ireland A regulator 0 - -
Italy A regulator 0 - -
Lux - -
Neth C regulator ongoing Wholesale market n.k.
Portugal A regulator 0 - -
Spain A regulator 1 Wholesale market penalty
Sweden A TSO “some” Wholesale market -
UK C regulator 0 - -
Norway A TSO >10 Wholesale market 1
Estonia N none 0 - -
Latvia C none 0 - -
Lithuania none 0 - -
Poland A regulator 1 Balancing remedy
Czech R N none 0 - -
40
A – advisory, C – concurrent powers\ regulator within competition authority, N –limited or no formal role
Slovakia N none 0 - -
Hungary A regulator 0 - -
Slovenia A regulator 0 - -
Cyprus N none 0 - -
Malta A regulator 0 - -
source: Based on Submissions from regulators
Many countries are trying to consider how, in future, to deal with the problem of concentration other than structural remedies such as divestment or capacity release. Greater transparency from generation companies about the projected availability of capacity, and guidelines on bidding behaviour of dominant generators would appear to be a possible avenue for a regulatory solution to the question of market concentration. Whereas for severe concentration problems, longer arrangements such as virtual power plant auctions also have potential. Without such solutions it seems likely that the main tool will still be the retention of price caps for end users which are prevalent in most Member States, which have the obvious risk of negating some of the benefits that competition is expected to deliver.
Trends in retail markets
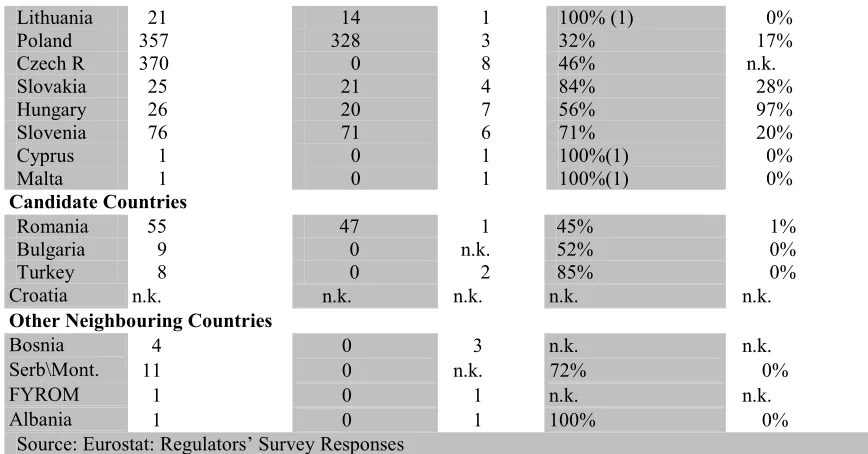
[image:23.595.65.517.70.131.2]As already noted it is expected that, over time, retail markets will come to be dependent on the market structure on the generation side. This is already true to a large extent judging from the information set out in Table 3.5 below. However, in some cases, the municipal suppliers retain a substantial share of the market, even if they are usually dependent on the main generation companies. Some consolidation might be expected over time.
Table 3.5 Market shares retail supply Number
active licensed suppliers
Number of suppliers independent of DSO
Number with market share > 5%
Top 3 suppliers’ share (all consumers)42
Market share of foreign
owned suppliers
Austria 144 19 4 67% 2%
Belgium 41 1743 2 c. 90% <10%
Denmark 69 23 5 67% n.k.
Finland 70 8 6 30% 25%
France 20-25 15 1 88% 9%
Germany 1050 100 3 50% c. 20%
Greece 10 9 1 100% 0%
Ireland 9 7 4 88% 12%
Italy 305 270 6 35% n.k
Lux 12 1 2 100% (2) 0%
Neth. 37 16 3 88%44 18%
Portugal 4 3 3 99% 33%
Spain 70 62 5 85% 8%
Sweden 127 127 4 70% 39%
UK 80 66 6 60% 50%
Norway 130 70 4 44% 2%
Estonia 17 1 1 ? 3%
Latvia 14 4 1 99% 0%
42
includes both eligible and non-eligible markets
43
Although independent, the two most important suppliers have strong ownership links with DSO’s
Lithuania 21 14 1 100% (1) 0%
Poland 357 328 3 32% 17%
Czech R 370 0 8 46% n.k.
Slovakia 25 21 4 84% 28%
Hungary 26 20 7 56% 97%
Slovenia 76 71 6 71% 20%
Cyprus 1 0 1 100%(1) 0%
Malta 1 0 1 100%(1) 0%
Candidate Countries
Romania 55 47 1 45% 1%
Bulgaria 9 0 n.k. 52% 0%
Turkey 8 0 2 85% 0%
Croatia n.k. n.k. n.k. n.k. n.k.
Other Neighbouring Countries
Bosnia 4 0 3 n.k. n.k.
Serb\Mont. 11 0 n.k. 72% 0%
FYROM 1 0 1 n.k. n.k.
Albania 1 0 1 100% 0%
Source: Eurostat: Regulators’ Survey Responses
Conclusions
[image:24.595.68.502.68.295.2]Competition continues to develop in the electricity sector in the majority of Member States. In some cases, however, this development has been disappointing and there are some signs of stagnation and a lack of innovation on the part of suppliers. The summary table relating to market structure below shows an unsatisfactory position in most Member States.
Table 3.6 Summary of Market Structure: Significant Market Participants45
Generation Supply
six or more UK, Nordic, PL UK, Nordic, IT, CZ
three to six AT, DE, BE, NL, LU, IT, ES, PT, CZ, SK, SI, HU,
AT, DE, IE, NL, PT, ES, PL, SK
less than three FR, GR, IE, CY, MT, EE, LT, LV BE, FR, GR, LU, EE, LV, LT, CY, MT
One consequence of this market structure are concerns that suppliers are becoming more conservative and are unwilling to venture out of their traditional areas or to offer a contract based on a stable long term price rather than the spot market. This is a sign that the market that is not functioning properly since suppliers should feel as comfortable serving customers in any part of the single market. They should also be prepared to negotiate with customers to find a mutually advantageous deal. It is crucial, especially as prices have risen in recent years, that customers have confidence in the functioning of the market.
Member States need to follow an active competition policy. If structural remedies to dominance cannot be implemented immediately, then measures to ensure fair and transparent bidding in wholesale and balancing markets are imperative. A dominant position in generation risks foreclosing the supply market.
ANNEX 4 Unbundling and Network Access: Gas Background
As with electricity, fair network access conditions are crucial for the development of a competitive market. This refers to both the use of physical network access as well as the provision of ancillary services such as the provision of balancing energy. In order to ensure this, the new Directives require regulation of the methodologies used to set charges for these services and the legal and functional unbundling of both transmission and distribution networks operators.
Unbundling
[image:25.595.68.561.324.659.2]The basis for ensuring non-discriminatory access to networks is the unbundling provisions in the second gas Directive. This required legal unbundling for transmission networks by 2004 and for distribution by 2007. Table 4.1 below shows the latest position for the unbundling of the gas network businesses.
Table 4.1 Network Unbundling: Gas
Basic Unbundling Model
Published accounts Compliance officer Separate
corporate identity
Separate HQ location
Total Y
TSO DSO TSO DSO TSO DSO TSO DSO TSO DSO
Austria L L Y Y Y Y Y N Y (3/7) N 5½
Belgium L L Y Y Y Y46 Y Y Y Y48 7
Denmark O L Y Y Y N Y N Y N 5
France L A N N Y Y Y N Y N 4
Germany A A N N N N N N N N 0
Ireland M M N N Y Y N N N N 2
Italy L L Y Y N N Y N Y mixed 5
Lux M M Y Y Y N N N N N 3
Neth L L Y Y Y Y Y N Y N 6
Spain L L Y Y Y Y Y N Y N 6
Sweden A A Y Y N N N N N N 2
UK O O Y Y Y Y Y Y Y Y 8
Estonia A. A N N Y Y N N N N 2
Latvia A A N N N N N N Y Y 2
Lithuania A A Y Y Y Y N N N N 4
Poland L A N N N N N N N N 0
Czech R N N N N N N N N N N 0
Slovakia M M N N N N Y N N N 1
Hungary L A Y Y N N Y N Y N 4
Slovenia L A Y N N N N N N N 1
Candidate Countries
Romania L A Y Y N N Y N N Y 4
Bulgaria A A Y Y Y N N N N N 3
Turkey L L Y Y N N Y N Y N 4
Croatia not available
source: Regulators’ Survey responses
The table demonstrates that significant progress still remains to be made for full compliance with the provisions of the Directive and it can be stated that progress within Member States is significantly behind that for electricity. Infringement procedures may well be necessary regarding these Member States which will continue until the unbundling requirements are met. However it is expected that, during 2005, significant progress will be made, especially for transmission. Member States, in general, appear unwilling to implement legal unbundling of distribution companies at this stage, in advance of the required deadline.
Network Access
Among other things, strict rules on unbundling are necessary to ensure that network access charges are cost reflective and do not contain hidden cross subsidies. A key task of regulators is therefore to ensure that network operators do not earn excessive profits. Otherwise this may, for example, enable vertically integrated companies to run their affiliated supply business at a loss and allow predatory pricing. Regulators also need to ensure appropriate cost allocation on shared services and that tariff structures are non-discriminatory and apply equally to all network users, including affiliated and non-affiliated suppliers.
Table 4.2 below provides the latest available information from regulators on network tariffs currently being paid by a range of customers. These still show a significant degree of divergence. Member States appear to have network tariffs (especially in the distribution segment) significantly above the average and the reason for this should be closely examined by regulators in their approval of tariff methodologies. More and more emphasis must also be laid on the charging aspect in the distribution areas as these account for a significant element of final bills.
The structure of tariffs is also important, particularly for transmission. Many Member States’ TSOs have now introduced entry-exit systems which appear to be more conducive to a competitive market and allow for greater coherence between Member States. Further progress is needed in this field in order to make the transmission of gas more understandable at a European level.
Table 4.2 Gas Network Tariffs
number of transmission companies
Estimated networks charges (€/MWh)
national regional
tariff structure47
Number of distribution
companies
Eurostat category I4
Eurostat category I1
Eurostat category D3
Austria+ 3 4 entry-exit 20 2.0-3.0 10.0 13.0
Belgium 1 0 entry-exit 19 2.0 4.5 10.5
Denmark+ 1 0 entry-exit 4 2.0 6.0 n.k.
France 3 0 entry-exit 22 1.048 9.5 13.0
Germany+ 15 20 mixed49 730 2.5 10.5 n.k.
Ireland 1 0 entry-exit 1 4.5 14.0
Italy 2 0 entry-exit 557 2.5 n.k. 8.0
Luxembourg 1 0 postalised 4 1.0
Netherlands 1 0 entry-exit 27 1.0 2.5 3.0
Spain 3 6 postalised 25 2.5 11.0 21.5
Sweden+ 1 2 postalised 7 5.0
UK 1 0 entry-exit 1 2.5 4.5 6.5
Estonia 0 0 postalised 11 n.k.
Latvia 1 0 postalised 1 3.5 4.0 4.0
Lithuania 1 0 postalised 5 4.2 6.2 8.7
Poland 1 6 postalised 68 5.0 8.0 8.0
Czech R 1 0 n.k. 124 n.k.
Slovakia 1 0 postalised 1 6.5 8.0
Hungary 1 0 postalised 11 2.5 5.5 5.5
Slovenia 1 0 postalised 17 1.1
Candidate Countries
Romania 1 0 postalised 21 2.5 2.5 2.5
Bulgaria 1 0 postalised 30 1.1 7.0 12.5
Turkey 1 0 postalised 24 2.5 4.5 4.5
Croatia not available
source: CEER Monitoring Reports: 8th Madrid Forum, July 2004
rounded to nearest €0.5/MWh
+ No data submitted by regulators. Estimates based on those in 3rd draft benchmarking report.
Finally, the flexibility of capacity reservation procedures also makes an important contribution to the scope for a competitive supply market. Rules need to allow network users to change their position frequently and allow equal opportunities to all market participants to use the network. This is reviewed in Table 4.3 below.
47
point to point charges remain in place for some existing transit contracts: e.g. Austria
48
Assuming connected direct to transmission, all based on entry Tasniere, exit Paris
Table 4.3 Gas Network Access Conditions: Compliance with Madrid Guidelines
Minimum booking period firm service
Minimum period interruptible services
type of capacity
booking
capacity allocation
rule decided by:
allocation method
use it or lose it?
Austria 1 day\ 1 month50 1 month entry-exit TSO fcfs yes
Belgium 1 week 1 year point-point regulator\TSO fcfs yes
Denmark 1 day 1 day entry-exit regulator\TSO fcfs yes
France 1 month 1 year entry-exit 51 regulator\TSO fcfs yes
Germany 1 day 1 day mixed TSO fcfs partial
Ireland 1 year not offered point-point regulator\TSO fcfs yes
Italy 1 year 1 day entry-exit regulator fcfs yes
Luxembourg 1 year not offered entry-exit TSO fcfs no
Netherlands 1 day 1 day entry-exit TSO fcfs yes
Spain no minimum not offered entry-exit regulator fcfs yes
Sweden 1 year not offered point-point regulator\TSO fcfs no
UK 1 day 1 day entry regulator\TSO auction yes
Estonia 1 day not offered n.k. TSO fcfs short term
Latvia n.k. not offered n.k. n.k. n.k. no
Lithuania 1 day not offered n.k. regulator “other” yes
Poland 1 month 1 month n.k. TSO fcfs no
Czech R n.k. n.k. n.k. n.k. n.k. n.k.
Slovakia 1 year not offered point-point TSO n.k. no
Hungary 3 days 3 days entry-exit TSO auction no
Slovenia 1 day not offered n.k. regulator\TSO fcfs no
Candidate Countries
Romania Bulgaria Turkey Croatia
not covered in this report
source: CEER Monitoring Reports: 8th Madrid Forum, July 2004
Balancing
Balancing rules are one of the most important aspect of whether granted third party access is effectively non-discriminatory and whether a given market/region offers realistic opportunities for market participants, especially for potential new market entrants. The costs of getting the commodity to the end-use customer should be predictable in advance, including the possible financial risks in the event that some problem occurs in the supply chain, or in case of unexpected demand patterns.
The financial risks stem in part from the respective balancing rules. As gas physically travels from production sites to its final consumption destination, it is often necessary for a market participant to take into account several balancing regimes to cover full market risk and hedging possibilities along the chain are generally more limited than in electricity markets. It is also more challenging to realise portfolio effects with respect to supply diversity. It is therefore important for all market participants to know well in advance all elements of the respective balancing market regime. Charges for imbalances must be either market based
50
1 month for transit, 1 day for domestic flow.
and/or reflective of the real costs of managing the network rather than being based on arbitrary penalties.
Table 4.4 Summary of Gas balancing rules
Balancing period Conditions set/approved by
Tolerance bands
Premium for “short” imbalance over tolerance band (x market price)
Pooling and trading allowed allowed
Austria hourly market no market based price ex-post
Belgium daily TSO\regulator 10% +140-180% ex-ante
Denmark daily TSO\regulator 15%\5% +20% ex-ante
France daily regulator 20% +50% ex-ante
Germany hourly/daily TSO 15% +100-420% ex-ante
Ireland daily TSO\regulator 3% +40% max ex-post
Italy daily regulator 8% +10% max ex-post
Luxembourg daily TSO\regulator 5%/3% +50% max ex-ante
Netherlands hourly/daily regulator 2/13% up to +180% ex-ante, ex-post with penalty
Spain52 daily TSO\Ministry +50% no
Sweden daily n.k. n.k. n.k. ex-ante
UK daily market zero usually <20% ex-post
Estonia daily TSO yes at market price no
Latvia hourly TSO 10% n.k. n.k.
Lithuania daily TSO yes n.k. no
Poland daily TSO no not decided ex-post
Czech R rules not yet in place
Slovakia hourly TSO no n.k. no
Hungary daily regulator yes + €1.5/MWh53 no
Slovenia daily TSO\regulator yes n.k. ex-ante
Candidate Countries
Romania monthly TSO no n.k. no
Bulgaria daily TSO\regulator yes n.k. no
Turkey daily market yes n.k. no
Croatia not available
source: CEER Monitoring Report 2004
The collected data in Table 4.4 demonstrates the prevailing of daily balancing period regimes. However, it must be mentioned that often hourly tolerance levels are also established within a daily regime, having as an effect that acting in daily regimes sometimes also necessitates hourly balancing action.
As a general statement it must be differentiated between physical balancing activities and financial balancing activities. It is the role of the TSO (GGP 2) to provide for system integrity, meaning the safe operation of the grid within the physical tolerance levels (which is an ongoing activity), and the role of the shipper to balance the nominations made and the physical input/outtake. Sometimes indicated balancing periods do not reflect the physical side but the financial cash out period (only). The looser the tolerance limits/balancing period for shippers are the more flexibility tools a TSO must contract for, meaning access to safe gas resources. These contracts can often only be provided (on a firm basis) by the dominant market participant of that area or via a direct contract for storage, meaning a considerable
52
new network code is currently under discussion
amount of annual fixed costs. There is thus a trade off between first sight generous “flexibility” of systems and considerable socialised costs attached to it.
It can also be seen that most balancing rules result of a joint effort by TSO and the regulatory authorities. If no market solutions are in place it is the role of the regulatory authorities to prevent artificial barriers to market entrants, however taking into account the necessity of physical balancing incentives. A “dynamic” approach, taking into account the overall physical position of the system and the charges for out-of balance positions might be a good solution. A considerable range of tolerance bands exist. As stated, the effect of tolerance bands has to be jointly assessed with the imbalance charges. Zero tolerance might allocate incurred costs most effectively, however in that case it must be assured that the unit “out-of-balance”, which will always exist must not be excessively charged if the system is overall balanced and it must be clear that each participant has access to risk hedging facilities (e.g. a balancing market). The avoided costs (for reduced overhead socialising) might be higher than the small amounts of out of balance charges, bringing an overall positive effect to pricing. In markets with static premium, tolerance levels must exist to ensure market opportunities for actors without a big portfolio. Pooling of imbalance positions is one of the possible tools to allow for risk hedging and to assure charges set in line with the overall incurred costs. Pooling of imbalances (also between customers within a given control area), ex-ante, ex-post or both is usually a strong means of attracting market participants.
As a general line it might be assumed that in the beginning phase of a competitive market for natural gas, (no intra-day/online balancing market mechanism) balancing periods should be longer and tolerance periods larger, thus socialising a significant share of the costs incurred between the market participants, which have ultimately to be born by the final customers. End-users with stable, flat consumption and a low swing factor have to cross subsidise volatile consumers, however easing market opportunities for new entrants.
Care must be taken about excessive, “static” out-of-balance charges, which do not respect the effective physical situation of the system and do not provide for “netting effects”. In cases where no balancing markets are installed the regulatory authorities might have a role to carefully assess the effects of such static balancing charges on the market attractiveness; established intra-day balancing markets give effective price signals and regulatory authorities might in such cases limit their tasks to monitor and detect eventual abuse of a dominant position in the balancing market (persistent high prices). Where intraday balancing tools exist, there might be scope to take care of minimising effects of cross subsidisation between energy markets (balancing periods merely in line between gas and electricity markets) and tolerance levels might be tighter.
Storage
Unlike the transmission networks, storage is not necessarily a natural monopoly. There are also other flexibility instruments that can provide the same service to an extent. At the same time, however, there are only a limited amount of suitable geological conditions available for the development of storage, usually depleted fields. Where these are largely in the hands of the incumbent company, third party access is required to ensure competition further down the line. The Directives require negotiated access to storage where it is technically and economically necessary for competition. Guidelines for access to storage are currently being discussed in the context of the Madrid Forum and a more detailed analysis of compliance with good practice and the impact of storage on gas competition will be carried out following these discussions.
Conclusions
[image:31.595.73.533.303.549.2]In general, the third party access regime for gas is not as well developed and well regulated as that for electricity. This is clearly demonstrated by the table below which summarises the current position.
Table 4.5 Summary of Regulated Third Party Access Pipeline Access
Network tariffs in line with norm\ flexible TPA service
BE, DK, NL, UK, HU, SI, IT,
High network charges or inflexible service AT, FR, ES, LV,
High network charges and inflexible service DE, IE, SE, PL, EE, LT, CZ, SK
Balancing
Favourable conditions: cost/market based AT, UK, IT
some favourable elements DE, DK, ES, FR, SE, BE, IE, HU, SI
unfavourable or unclear NL, LU, EE, LT, LV, PL, CZ, SK
ANNEX 5 Competition in the Gas Sector Background
Natural gas markets have been designed with an international perspective in most cases, as domestic production could not cope with demand increase. Hence systems are very interlinked and most large market actors are present in a large number of countries, at least in the former transit business.
Given the small number of indigenous resources, the strong dependence on external supply areas with monopolistic and protected markets and the heavy economies of scale in the upstream business, this has resulted in a limited number of competitors in the field of gas production. Under these conditions it is of extreme importance to provide for accessible markets within the whole of the EU to allow for calculable business opportunities and to attract new players to enter that market. This is very true for the transmission layer, to be able to get bulk gas from the source to the destination area but even more so for the effective opening of the distribution area, as it is quite useless to ship gas for many km to find the connection between the TSO system and the inlet of the customer economically blocked by vertically integrated incumbent suppliers.
On the other hand, it is extremely important to allow distribution companies (there are several thousand in the EU) to be active on an international scale to get supplies directly, or, in the best case, to provide for open systems until the end-user layer in order to allow for direct pooling/clustering of end-user demand in a control area, which for itself should be as large as possible.
Current Upstream Market Structure
Table 5.1 Market Structure in Import and Production of Gas % of gas
from domestic producti on
% of gas from imports (no. of sources)
No. of companies with at least 5% share of available gas54
% of available gas controlled by largest company
Gas release programme
Existence of NBP type trading
Austria 23% 77% (3) 1 >90% yes limited
Belgium 0% 100% (3) 1 92% no significant
Denmark 93% 7% (1) 1 80-85% yes planned
France 3% 97% (6) 1 91% planned no
Germany 18% 82% (4) 12 50% in progress no
Ireland 16% 84% (1) 5 40% no no
Italy 18% 82% (4) 3 68% in progress limited
Luxembourg 0% 100% (3) not meaningful
Netherlands 88% 12% (2) 1 60% no limited
Spain 1% 99% (11) 4 40% completed limited
Sweden 0% 100% (1) 1 97% no no
UK 92% 8% 5 25% completed signficant
Estonia 0% 100% (1) 3 50% no no
Latvia 0% 100% (1) 1 100% no no
Lithuania 0% 100% (1) 2 59% no no
Poland 33% 67% (4) 1 98% no no
Czech R 1% 99% (2) 1 99% no no
Slovakia 2% 98% (1) 1 100% no no
Hungary 15% 85% (4) 1 100% no no
Slovenia 1% 99% (3) 1 100% no no
Candidate Countries
Romania 70% 30% (1) 4 87% yes limited
Bulgaria 1% 99% (1) 1 100% yes no
Turkey 3% 97% (4) 1 97% yes no
Croatia no
source: Regulators’ survey responses
Trends in Wholesale Gas Markets and Market Surveillance
Wholesale trading in gas is becoming more prevalent with a number of Member States having developed gas exchanges or “hubs”. However progress is rather behind that for electricity due to the very unfavourable market structure. This has consequences for the transparency of price formation in the market. This is an important problem since more liquid markets would encourage competition and security of supply. If new suppliers have access to gas in a liquid market, the problems associated with fluctuations in demand become less acute and it is easier to maintain a balanced portfolio. Similarly, companies will be more encouraged to make the required investments to import gas to Europe if there is always a liquid wholesale market into which gas can be sold in the absence of a specific buyer. The UK market is based on a “virtual” balancing point in the network. This is made possible by and entry-exit tarification system which allows all injected gas to be traded on a consistent “entry paid” basis. Similar virtual hubs have been set up in the Netherlands and in Italy.55 Other trading points have been
54
available gas from either local production or import, figures refer to 2001.
formed at Bunde in Germany, Zeebrugge in Belgium and at Baumgarten in Austria. However these do not usually give the same liquidity as a harmonised single trading point for gas. As well as prices indices produced by these exchanges, the price of imported gas at the borders of some Member States is also reported regularly. The graph below summarises the most recent price data from gas wholesale markets.
Table 5.2 Development of Wholesale Gas Prices
0 5 10 15 20 25 30
Nov-02 Jan-03 Mar-03 May-03 Jul-03 Sep-03 Nov-03 Jan-04 Mar-04 May-04 Jul-04 Sep-04
E
u
ro
/M
W
h
UK day ahead Zeebrugge day ahead Bunde day ahead UK forward Q1 05 ZB forward Q1 05 Bunde forward Q1 05
source: Argus Gas Connections
Table 5.2 shows that gas prices increased during 2004, particularly those relating to the Q1 2005 period. UK wholesale gas prices show a significant overshooting of the continental price which has led to concerns about market manipulation. A recent investigation by the UK regulator suggested that some increase in transparency relating to offshore facilities and the operation of the interconnector was needed. It also called for the further development of competition in continental European gas markets.
Supply Market
Table 5.2 Retail Supply and Consumer Choice Supplier market share
Number of active licensed suppliers
Suppliers independent of DSO
No. of
suppliers with > 5% share
Top 3 suppliers’
share56
Share of foreign owned suppliers
Austria 29 6 3 90% n.k.
Belgium 16 1657 3 95% 5%
Denmark 8 4 4 65% 4%
France 11 10 2 91% 3%
Germany 760 n.k. 0 10% n.k.
Ireland 10 9 4 88% 23%
Italy 410 338 5 63% n.k.
Luxembourg 6 1 1 n.k. n.k.
Netherlands 27 7 3 87%58 31%
Spain 21 6 4 80% 19%
Sweden 7 0 5 79% 60%
UK 112 112 6 82% 27%
Estonia 2 0 1 100% 0%
Latvia 1 0 1 100% 0%
Lithuania 13 9 4 99% 0%
Poland 77 3 6 65% <5%
Czech R 133 3 7 59% n.k.
Slovakia 1 0 1 100% 49%
Hungary 19 11 7 62% 69%
Slovenia 41 22 4 86% 0%
Candidate Countries
Romania 24 3 5 75% 0%
Bulgaria 30 0 6 42% 0%
Turkey 1 1 1 100% 0%
Croatia no information available
Source: Regulators’ survey responses
Conclusions
Gas markets remain very concentrated at national level and this forms a severe obstacle to the development of competition and an open market. This is summarised in the table below. The level of integration of national markets in terms of supply remains low, despite the fact that most gas crosses at least one border during the delivery process. There remain considerable regulatory barriers which are retarding unnecessarily the development of the European gas market.
56
includes both eligible and non-eligible markets
57
Although independent, the two most important suppliers have strong ownership links with DSOs
Table 5.4 Summary of Market Structure
Wholesale Gas market Retail Gas Supply
largest shipper < 50% IE, ES, UK 6 or more DE, UK, PL, CZ, HU
largest shipper 50-90% DE, IT, EE, LT, NL 3-6 suppliers AT, BE, DK, IE, IT, NL, ES, SE, LT, SI
largest shipper > 90% AT, BE, FR, LU, SE, LV, PL, CZ, SK, HU, SI
1-3 main suppliers FR, LU, EE, LV, SK
ANNEX 6 Security of Supply Data 6.1 Electricity: Current Position
Table 6.1 overleaf summarises the information contained in the most recent UCTE reports on Power Balances in European Union as well as information collected from similar TSO organisations in those Member States not part of UCTE.