Measuring progress in eco-innovation
Vasileios Rizos, Arno Behrens and Igor Taranic
No. 409 / June 2015
Abstract
Eco-innovation has been identified as one of the key drivers of change that need to be harnessed for a sustainable future. Given the complexity of eco-innovation as a concept, there are various challenges to measuring its progress. This paper briefly explores the evolution of the concept of eco-innovation and emphasises its role in the EU 2020 strategy. It then provides an overview of the different measurement approaches and challenges associated with identifying and using indicators for measuring progress in eco-innovation. Within this context, the paper describes the added value and key features of the www.measuring-progress.eu web tool, which aims to improve the way in which policy-makers and others involved in the policy process can access, understand and use indicators for green economy and eco-innovation. The web tool was developed on the basis of a systematic overview by the NETGREEN research team of the large and fragmented body of work in the field of green economy indicators. The paper concludes with a number of messages for policy-makers in the field of the green economy.
Main policy messages
Results obtained from using composite indicators to gauge eco-innovation performance should be interpreted with caution and treated as indicative of overall eco-innovation performance.
While efforts to improve data quality and to create more comprehensive eco-innovation indicators should continue, existing databases in the field should to be used more extensively. The alignment of eco-innovation indicators with other green economy indicators can provide
a more holistic perspective on the sustainability performance of the EU and contribute to a more substantive discussion about the direction of eco-innovation and other sustainability measures.
CEPS Working Documents are intended to give an indication of work being conducted within CEPS’ research programmes and to stimulate reactions from other experts in the field. The opinions expressed in this document are the sole responsibility of the authors and do not necessarily represent the official position of CEPS.
This paper was prepared in the context of NETGREEN, an EU-funded project that aims to advance progress towards a green economy.
ISBN 978-94-6138-466-9
1. Defining the concept of eco-innovation ... 1
2. Eco-innovation as a cornerstone of the Europe 2020 strategy ... 1
3. Measuring eco-innovation ... 3
3.1 Importance of eco-innovation measurement ... 3
3.2 Measurement approaches ... 3
4. Contribution of NETGREEN to measuring progress ... 4
4.1 Added value ... 4
4.2 Description of selected eco-innovation indicators featured in measuring-progress.eu ... 6
4.3 Case study for using the measuring-progress web tool ... 7
5. Main messages for policy-makers ... 9
References ... 11
1
Measuring progress in eco-innovation
Vasileios Rizos, Arno Behrens and Igor Taranic
*CEPS Working Document No. 409 / June 2015
1.
Defining the concept of eco-innovation
Although academic discussions about the role of technological innovation in improving environmental sustainability date back to the late 1960s1 (Pansera, 2012), the term
‘eco-innovation’ appears to have been introduced in the mid-1990s2 (OECD, 2009a). Eco-innovation
originally focused on environmental technologies and end-of-pipe solutions to decrease the negative environmental effects of production and consumption activities. In recent years, however, there has been increasing recognition among academics and policy-makers that innovation over the life-cycle of products and services is important (Andersen, 2010; EIO, 2013; OECD, 2009b; EIO, 2011). The expanding scope of the concept can also be observed in the EU Eco-innovation Action Plan, published in December 2011, which defines3 eco-innovation
(European Commission, 2011a, pp.2) as
“any form of innovation resulting in or aiming at significant and demonstrable progress towards the goal of sustainable development, through reducing impacts on the environment, enhancing resilience to environmental pressures, or achieving a more efficient and responsible use of natural resources”.
In recent years, and in the face of numerous global economic, climate, and food crises, the concept of a green economy has been at the centre of academic and policy debates. Since there is no single definition of the green economy or consensus about its meaning, the concept is subject to different interpretations (Ocampo, 2012; Netzer & Althaus, 2012; Khor, 2012). Although an exhaustive review of existing green economy/green growth definitions and concepts is beyond the scope of this paper, it is worth mentioning that eco-innovation is generally considered by many important actors to be a critical factor in the transition to a sustainable future. For instance, the EEA (2014) identifies eco-innovation as one of the key drivers of change to achieve a resource-efficient EU green economy, while the OECD (2011) considers innovation as a stimulant to green growth that also generates economic opportunities.
2.
Eco-innovation as a cornerstone of the Europe 2020 strategy
In response to the mammoth challenges of the economic crisis, increased demand for natural resources, ageing and globalisation, in 2010 the European Union launched its Europe 2020
* Vasileios Rizos is a Researcher at CEPS; Arno Behrens is Research Fellow and Head of the Energy
research programme at CEPS; and Igor Taranic is a Research Assistant at CEPS.
1 As an example, the widely debated “Limits to Growth” report (Meadows et al., 1972) constitutes one of
the first attempts to assess the role of technological innovation in easing the negative impacts of human activities on the environment.
2 Specifically, according to OECD (2009a), the term eco-innovation was used for the first time in 1996 in
the book titled Driving Eco-Innovation, by Claude Fussler and Peter James.
3 Interestingly, OECD (2005, p. 46) provides the following definition of innovation: “An innovation is the
strategy to put the EU economy on a sustainable trajectory. The transformational changes proposed in the strategy are underpinned by five headline targets4 and three priority themes,
namely smart growth, sustainable growth and inclusive growth. The themes are supported by seven ‘Flagship Initiatives’5 that give the framework conditions for action to be taken at both
member state and EU level in support of the Europe 2020 objectives. Among these flagship initiatives is ‘Innovation Union’, which cautions that the major challenges faced by the EU cannot be resolved without a major push towards embracing innovation and research (European Commission, 2010).
The major objective of the Innovation Union flagship initiative is to facilitate the transformation of innovative ideas into products and services that help generate growth and tackle the EU’s critical societal challenges (European Commission, 2014). To catalyse progress in this direction, in 2011 the Commission adopted the Eco-innovation Action Plan (EcoAP), including a set of targeted actions6 and measures. Building on the achievements and lessons learnt under its
predecessor, the Environmental Technologies Action Plan (ETAP), the EcoAP aims to ensure that efforts to improve the market penetration of environmental industries extend beyond exploring the possibilities of technology but address all aspects of eco-innovation (European Commission, 2011a).
In addition to the Innovation Union, the EcoAP complements three additional flagship initiatives: the ‘Resource-efficient Europe’, the ‘Industrial policy for the globalisation era’ and the ‘Agenda for new skills and jobs’. The actions included in the EcoAP and in all the above-mentioned initiatives aim to incentivise the market uptake of eco-innovation, which in turn will relieve the burden on the environment and foster growth, jobs and European competitiveness (European Commission, 2011a).
While highlighting the importance of targets and indicators in assessing the effects of EU policies, the impact assessment accompanying the EcoAP (European Commission, 2011b) recognises that monitoring progress towards eco-innovation is a complex task due to the various perspectives of eco-innovation that pertain to several policies. With this in mind, the wider impacts of eco-innovation policies can be examined using proxy indicators and qualitative assessments. The impact assessment furthermore suggests that the monitoring process can involve the regular reporting of activities7 conducted under the EcoAP, as well as
the use of key indicators8 to monitor the implementation of specific actions aimed at fostering
4 Targets cover the fields of employment, climate change and energy, research and development,
education and poverty.
5 The seven flagship initiatives are: ‘Resource-efficient Europe’; ‘An industrial policy for the globalisation
era’; ‘An agenda for new skills and jobs’; ‘European platform against poverty’; ‘Innovation Union’; ‘Youth on the move’; and ‘A digital agenda for Europe’.
6 The seven targeted actions included in the EcoAP are the following (European Commission, 2011a, pp.
6-14): “Use environmental policy and regulation for promoting eco-innovation”; “Support demonstration projects and partnerships for innovation”; “Develop new standards boosting eco-innovation”; “Mobilise financial instruments and support services for SMEs”; “Promote international cooperation”; “Support the development of emerging skills and jobs”; and “Promote eco-innovation though European Innovation Partnerships”.
7 Examples of such activities include inter-service consultations, specific studies and consultations of the
High Level Working Group of representatives from the European Commission services and member states (European Commission, 2011b).
8 ANNEX XIII of the Impact Assessment provides a list of suggested performance indicators for
eco-innovation. Finally, the EcoAP (European Commission, 2011a, pp. 16) envisagers that progress made by member states and the EU towards fostering eco-innovation can be measured by the “Eco-innovation scoreboard”, as well as by “other relevant indicators”.
3.
Measuring eco-innovation
3.1
Importance of eco-innovation measurement
The importance of measuring progress towards eco-innovation has been emphasised by the OECD (2009a), which stresses that measurement can help identify the countries that are lagging behind in eco-innovation and the ones that are leaders in this field. Additionally, it can provide information about the economic effects, drivers and barriers of eco-innovation as well as contribute to an assessment of whether there is a decoupling of economic growth and environmental degradation. The OECD (2009a, pp. 149) identifies four key benefits of measuring eco-innovation:
- “Help policy-makers understand, analyse and benchmark overall trends in eco-innovation activities as well as trends in specific product categories,
- Help policy-makers identify drivers of and barriers to eco-innovation. This information can inform the design of effective policies and framework conditions,
- Raise awareness of eco-innovation among businessmen, policy-makers and other stakeholders and encourage companies to increase eco-innovation efforts on the basis of an analysis of its benefits,
- Help society to tackle global environmental challenges by making the environmental improvement that has been or can be achieved through eco-innovation more tangible to producers and consumers alike.”
In addition to the above-mentioned four benefits, Arundel and Kemp (2009) argue that measuring eco-innovation can increase consumer awareness about the large variations in contribution to environmental degradation from different products and lifestyles.
3.2
Measurement approaches
Eco-innovation is a broad concept that goes beyond technological progress and can involve changes in organisational, social, cultural and institutional structures (Tarnawska, 2013; OECD 2009b). To this end, measuring progress in this field is a complex task that requires a range of different indicators, including composite9 indicators. Andersen (2006) has pointed out that in
contrast to traditional environmental indicators that provide insights into the state of the environment, eco-innovation indicators are response indicators that evaluate eco-innovation developments at various societal levels.
Given the inherent complexity of the topic, various research efforts have attempted to design measurement approaches to eco-innovation (Tarnawska, 2013). The OECD (2009a) has recommended an input/output approach which distinguishes between four categories of eco-innovation data: input measures (e.g. R&D expenditures), intermediate output measures (e.g. number of eco-innovation patents and academic publications), direct output measures (e.g. number and description of innovations, sales of products from eco-industries) and indirect impact measures (e.g. changes in absolute environmental impact and resource efficiency). The
9 A composite indicator compiles individual indicators on the basis of an underlying model and
OECD has furthermore stressed that the collection of data in some of the above-mentioned categories may be a difficult exercise, often requiring the collection of information from surveys and product information databases.
A similar approach has been adopted by the Eco-Innovation Observatory (EIO)10 with its
Eco-innovation scoreboard, a composite index indicator and tool to measure the eco-Eco-innovation performance of different EU member states. Aiming to assess how eco-innovation is unfolding in several relevant areas such as R&D investments, the performance of firms and socio-economic and environmental outcomes, the scoreboard includes 16 different indicators that are classified under five thematic categories: innovation inputs, innovation activities, eco-innovation outputs, environmental outcomes and socio-economic outcomes (EIO, 2013; 2011). The structure of the scoreboard also indicates that there is an indirect connection between some of the categories11 (EIO, 2013).
4.
Contribution of NETGREEN to measuring progress
4.1
Added value
Indicators are essential for the transition to a green economy since they help policy-makers identify priority issues, determine policy goals, formulate and assess policies and finally monitor and evaluate their impacts (UNEP, 2014). Furthermore, they have a key role to play in illustrating to policy-makers and other stakeholders the links and trade-offs between the economy, society and the environment (Stevens, 2005). An extensive body of research has been devoted to the development of indicators that would cover various aspects of this particularly broad topic, resulting in a very large number of, often complex, available green economy indicators12 (UNEP 2012; Dalal-Clayton & Sadler, 2014). This can inevitably create confusion
and/or difficulties in fully understanding and interpreting their underlying concepts (EPA, 2012; Dalal-Clayton & Sadler, 2014). As discussed in the previous section, only in the field of eco-innovation is a wide range of different indicators required to address its various dimensions.
In view of the above issue and with the financial support of the European Commission, the NETGREEN team has developed an open-access, searchable web tool that provides policy-makers and other stakeholders with a unique point of entry into the vast landscape of green economy indicators, including eco-innovation indicators. The tool, named ‘measuring-progress’, enables policy-makers and other users13 to quickly identify the most relevant
indicators to help them measure the success of green economy policies and understand the key implications and challenges of the transition.
The tool offers a concise collection of green economy indicators14 accompanied by
easy-to-understand information15 (e.g. description, data availability, indicator construction and quality,
10 The Eco-Innovation Observatory is financed by the European Commission.
11 In particular, it indicates that there is a link first between eco-innovation inputs and activities and
second between eco-innovation outputs and environmental and socio-economic outcomes (EIO, 2013).
12 According to Bass and Dalal-Clayton (2002), hundreds of indicator sets are available in the field of
sustainability.
13 Examples of other users include campaigners, business strategists and researchers.
14 To prepare the collection of indicators featured in the web tool, the NETGREEN research team first
interpretation) that can help users who are not necessarily familiar with scientific terminologies to interpret results and select the indicators most suited to their analysis. Most importantly, the web tool provides further indicator suggestions16 that may broaden users’ viewpoints and help
them integrate alternative green economy considerations into their analysis. To achieve that, the tool provides a list of related indicators for each indicator and a list of potential misinterpretations and indicators to help avoid misinterpretations.
Aiming to address the needs of policy-makers and experts with different backgrounds and levels of knowledge of the green economy, the design of the web tool enables users to receive indicator suggestions in three ways: by using key words17 that are prominently used in the
policy process (e.g. environmental taxes, eco-innovation, climate change negotiations); by choosing one or several green economy topics18 from a hierarchy or by free-text search. Table 1,
[image:7.595.65.527.306.552.2]below, provides an indication of the green economy topics and keywords available in the web tool as well as of indicator suggestions linked to these topics/keywords.
Table 1. Illustrative green economy topics / keywords and related indicators
Topic Indicator suggestions
Green technological development
and use
Eco-innovation index
Green patents, index 1990=100
Public spending in environmentally related RD, % total public spending
Turnover from innovation
Resource use efficiency
Resource efficiency scoreboard
Domestic material consumption per capita
Resource productivity
Keyword Indicator suggestions
Energy consumption
Share of energy from renewable sources
Energy productivity (GDP/gross inland energy consumption)
Final energy consumption by fuel
Innovation
Innovation Union scoreboard
MSCI Global clean technology index
Total R&D expenditure
prepared a list of about 300 ‘lead’ indicators that cover, as far as possible, all major aspects of the green economy, namely economic sustainability and resilience, environmental sustainability, social justice, effective governance and quality of life. This list of ‘lead’ indicators featured in measuring-progress.eu is complemented by a list of about 500 ‘non-lead’ indicators, for which the tool offers a limited amount of information.
15 The tool also provides links to access data.
16 In order to include this functionality in the tool, the research team first developed a mind map of the
main themes associated with the green economy using input from an in-depth literature review and interviews with experts in the field. The mind map was then used to establish links between the indicators, the key words and the topics included in the web tool. Based on this mind map the tool provides an algorithm that generates a selection of suggestions for additional indicators, depending on the choices (i.e. indicators, key words and topics) of the user.
17 At the time of writing around 900 keywords are featured in the web tool.
4.2
Description of selected eco-innovation indicators featured in
measuring-progress.eu
As described above, one of the principal objectives of measuring-progress.eu is to offer policy-makers and other stakeholders concise and easy-to-understand information about green economy indicators. Boxes 4.1, 4.2 and 4.3 briefly present three selected eco-innovation indicators featured on the website and provide an indication of the type of information that the web tool offers to its users. More complete information about these three indicators, as well as for all indicators featured in the web tool, can be found on: www.measuring-progress.eu. The full list of eco-innovation indicators featured in the web tool is presented in Annex I.19
Box 4.1 Eco-innovation index20
Description: Unweighted mean of 16 indicators from eight contributors in five areas: eco-innovation inputs, eco-eco-innovation activities, eco-eco-innovation outputs, environmental outcomes and socio-economic outcomes.
Unit of measurement: Percentage of the EU average that is equated with 100 (Index EU27=100)
Indicator developer: Eco-Innovation Observatory
Data host: Eurostat
Geographical coverage: Austria, Belgium, Bulgaria, Croatia, Cyprus, Czech Republic, Denmark, Estonia, Finland, France, Germany, Greece, Hungary, Ireland, Italy, Latvia, Lithuania, Luxembourg, Malta, Netherlands, Poland, Portugal, Romania, Slovakia, Slovenia, Spain, Sweden, United Kingdom
Temporal coverage: 2010 to 2013
Frequency of updates: Every 1-3 years
Cost of accessing data: Free of charge
Aggregation level of indicator: Index or Composite
Related indicators: Venture capital - early stage investment, Exports of products from eco-industries, Energy productivity, GHG emissions intensity
Type of relation of related indicators: Component indicators of the aggregate
Methodological transparency: Complete methodology available
Data quality assessment: Other organisational assessment
Potential misinterpretation: This is a composite indicator that can only provide messages about the overall country performance in relation to eco-innovation. A high overall ranking does not necessarily mean that a country has performed well in all eco-innovation areas covered by this indicator. Thus, an assessment of the individual areas would require an analysis of the specific sub-indicators covering these areas
Use of indicator in mandates, international agreements or legislation: The Eco-innovation Action Plan, Green Action Plan for SMEs (European Commission)
19 Annex I provides the list of ‘lead’ eco-innovation indicators currently featured in the web tool.
20 Eurostat hosts data from the Eco-innovation scoreboard, developed by the Eco-Innovation
Box 4.2 Global cleantech innovation index
Description: This indicator explores which countries currently have the greatest potential to produce entrepreneurial cleantech start-up companies that will commercialise clean technology innovations over the next 10 years.
Unit of measurement: Indices
Data host: Cleantech Group
Type of indicator source: Business
Temporal coverage: 2012 to 2014
Frequency of updates: Every 1-3 years
Cost of accessing data: Free of charge
Aggregation level of indicator: Index or Composite
Related indicators: Eco-innovation index, Innovation Union scoreboard, Green transition scoreboard
Methodological transparency: Partial methodology available
Data quality assessment: No published quality assessment
Contribution to the green economy: Green innovation positively impacts both environmental and economic sustainability, thereby contributing to the progress in the green economy
Box 4.3 Turnover from innovation
Description: This indicator is defined as the ratio of turnover from products new to the enterprise and new to the market as a % of total turnover. It is based on the Community Innovation Survey (CIS) and covers at least all enterprises with 10 or more employees
Geographical coverage: Austria, Belgium, Bulgaria, Croatia, Cyprus, Czech Republic, Denmark, Estonia, Finland, France, Germany, Greece, Hungary, Iceland, Ireland, Italy, Latvia, Lithuania, Luxembourg, Malta, Netherlands, Norway, Poland, Portugal, Romania, Serbia, Slovakia, Slovenia, Spain, Sweden, United Kingdom
Unit of measurement: % of total turnover
Data host: Eurostat
Type of indicator source: Statistical office
Temporal coverage: 2004 to 2012
Frequency of updates: every 1-3 years
Cost of accessing data: Free of charge
Aggregation level of indicator: Single
Methodological transparency: Complete methodology available
Data quality assessment: Assessed by statistical office
4.3
Case study for using the measuring-progress web tool
Box 4.4 Designing an eco-innovation strategy in Greece
In view of the recommendations of the European Council (2001) in Göteborg inviting member states to develop their own national sustainable development strategies, in 2002 Greece adopted its National Strategy for Sustainable Development. The strategy set out a ten-year framework for achieving sustainability policies to help the country address all three pillars of sustainable development and improve national prosperity (Hellenic Ministry for the Environment, Physical Planning and Public Works, 2002). A revised Sustainable Development Strategy was adopted in 2007 and partially implemented up to 2009. During 2009 and under the new Ministry of Environment, Energy and Climate Change, the country put forward the strategic objective of stimulating ‘green growth’ (ESDN, 2014). However, since 2010 and the severe economic crisis, progress in this field has inevitably suffered setbacks.
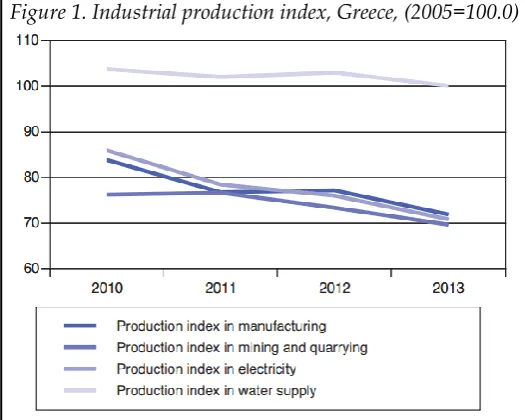
Prompted by concerns about the country’s economic performance and by the increasing de-industrialisation since 2010 (see Figure 1), the Greek Ministry of Reconstruction of Production, Environment and Energy21 is now prioritising boosting economic productivity while easing
[image:10.595.66.329.358.568.2]environmental pressure. Recognising that innovation can be a fundamental lever for sustainable business growth, the ministry has decided to set up an ‘Innovation Task Force’ comprising experts from the ministry and external academic specialists to first assess Greece’s eco-innovation performance and then draw up relevant policy measures.
Figure 1. Industrial production index, Greece, (2005=100.0)
Source: ELSTAT (2014).
During their research for relevant indicators, experts from the ministry identify the measuing-progress.eu web tool. Via the tool’s user interface that explains how to select relevant keywords in order to receive suggestions for indicators relevant to the green economy topic of their interest, they enter ‘eco-innovation’. The web tool then provides a list of suggested indicators, among which is the ‘eco-innovation index’. Having read the information provided for this indicator (description, geographical coverage, data host etc.) as well as the available methodology, the Task Force members decide to use this indicator and analyse the provided data.
21 This ministry was created in January 2014, after the national elections, by merging the Ministry of
One of the first observations is that Greece is among ten member states with the lowest ranking in this field. They also note that Sweden and Finland22 have the highest scores across the EU. In
view of these findings, they decide to seek technical advice from the Swedish Ministry of Enterprise, Energy and Communications, which produced the ‘Swedish Innovation Strategy’ to enhance competitiveness and generate jobs for the economy.23 In this context, they decide to
organise a workshop and invite experts from the Swedish ministry to share their experiences. Furthermore, using the additional suggestions of relevant indicators provided by the web tool, the Task Force experts select a basket of additional indicators that capture more specific aspects of eco-innovation, such as the ‘exports of products from eco-industries’. This helps them conduct their analysis and prepare a list of member states for which they would need to assess in more detail the underlying structural conditions and policy measures to enable these states to achieve strong eco-innovation performance.
While performing their selection of eco-innovation indicators, the experts note that the web tool also provides the option of identifying indicators through a green economy topic ‘tree’. They navigate through the web tool and choose the topic ‘economic sustainability and resilience’ and then its sub-topics ‘progress towards the green economy’ and ‘green fiscal policy’. The web tool then provides suggestions of related indicators. The experts assess their content and decide to discuss them with their colleagues in the Ministry of Finance who are making considerable efforts to improve the domestic fiscal framework. Eventually, the experts of the Task Force decide to broaden the perspective of their analysis to cover additional indicators and green economy-related aspects that had not initially been considered, such as public expenditure on environmental protection activities and the share of environmentally-related taxes in the country’s GDP.
5.
Main messages for policy-makers
This section presents a number of policy messages that draw on the systematic overview of the field of eco-innovation indicators conducted by the NETGREEN research team. These messages were further developed through feedback from a thematic policy workshop on ‘’Eco-innovation and opportunities for the EU economy’’24 and interviews with policy-makers and
researchers in the field.
Clarify exactly what is measured by the composite indicators
Composite eco-innovation indicators and indexes are useful tools because they can draw the attention of policy-makers to some of the key challenges that need to be resolved. Additionally, they can help policy-makers develop easy-to-understand messages for public communication.
22 Importantly, as specified by the developers of this indicator, a high score does not necessarily mean
that a country has performed well in all five eco-innovation areas covered by this indicator (see Box 4.1). Thus, an assessment of the individual areas would require an analysis of the specific sub-indicators covering these areas (EIO, 2011).
23 More information about the Swedish Innovation Strategy is available here:
http://tinyurl.com/ovuntxl.
24 The event was organised on 11 March 2015 in Brussels and brought together around 100 experts and
However, results obtained from composite indicators should be interpreted with caution and treated as indicative of the overall eco-innovation performance; otherwise they may result in misleading policy messages.
In the case of the Eco-innovation index developed by the Eco-Innovation Observatory, a high overall ranking does not necessarily mean that a country has performed well in all eco-innovation areas covered by this indicator, or achieved progress in terms of environmental and socio-economic outcomes. The results of the index can only provide messages about the overall country performance in relation to innovation. Drawing conclusions about specific eco-innovation aspects and country trends requires a careful analysis of the sub-indicators covering these fields.
Make better use of existing indicators but also identify areas where new or better indicators are needed
Eco-innovation is a multi-dimensional and complex concept with many definitions that go beyond technological progress. While efforts to improve data quality and create more comprehensive indicators that address all aspects of eco-innovation should continue, better use should be made of the existing literature in the field. Instead of focusing only on developing the perfect eco-innovation indicator or set of indicators, existing databases need to be used more extensively by policy-makers. Despite numerous gaps and limitations, various indicators can provide useful pointers for some political questions, if used properly to avoid misinterpretation. The hypothetical case study described above shows how existing indicators can provide useful messages to policy-makers about eco-innovation trends and how the measuring-progress.eu web tool can contribute to this end.
At the same time, there are areas where additional research and indicators are needed to reflect specific eco-innovation trends. For instance, at the EU level, the development of specific indicators to measure the production and adoption of eco-innovations by SMEs could help the European Commission assess the added value, effectiveness, direction and impact of specific actions included in the Green Action Plan for SMEs.25 These types of indicators could also be
used to set more specific eco-innovation targets.
Complement eco-innovation indicators with other green economy indicators
The alignment of eco-innovation indicators with other green economy indicators can provide a more holistic perspective on the sustainability performance of the EU and contribute to a more substantive discussion about the direction of eco-innovation and other policies in the sustainability field. For example, the combination of eco-innovation and circular economy indicators can be used to better monitor trends and performances across material supply chains. In this context, the measuring-progress.eu web tool can be used to improve understanding about the interconnections of sustainability green economy issues and the relationship between different green economy indicators. Nevertheless, it should be kept in mind that while a group of indicators can offer useful messages for the overall direction of policies, much caution should be exercised in identifying any correlations in the results of the different indicators.
25 The Green Action Plan for SMEs - COM(2014) 40 final was adopted in July 2014 as a joint initiative of
References
Andersen, M.M. (2006), “Eco-innovation indicators”, European Environment Agency, Copenhagen, February.
Andersen, M.M. (2010), “The Faces and Phases of Eco-innovation - on the Dynamics of the Greening of the Economy”, Paper for the DRUID Conference, 16-18 June, Imperial College, London.
Arundel, A. and R. Kemp (2009), “Measuring eco-innovation”, Working Paper Series, United Nations University - Maastricht Economic and social Research and training centre on Innovation and Technology.
Bass, S. and B. Dalal-Clayton (2002), “Sustainable Development Strategies: A Resource Book”, OECD, Paris.
Dalal-Clayton, B. and B. Sadler (2014), Sustainability Appraisal: A Sourcebook and Reference Guide to International Experience, New York: Routledge.
EPA (2012), “A Framework for Sustainability Indicators at EPA”, EPA/600/R/12/687, United States Environmental Protection Agency, Washington, D.C.
European Commission (2010), “Communication from the Commission, Europe 2020, A strategy for smart, sustainable and inclusive growth”, COM(2010) 2020 final, Brussels.
European Commission (2011a), “Innovation for a sustainable Future - The Eco-innovation Action Plan (Eco-AP)”, Communication from the Commission to the European Parliament, the Council, The European Economic and Social Committee and the Committee of the Regions, COM(2011) 899 final, Brussels.
European Commission (2011b), “Innovation for a sustainable Future - The Eco-innovation Action Plan (Eco-AP)”, Impact Assessment accompanying the EU Communication, SEC(2011) 1599 final, Brussels.
European Commission (2014), “State of the Innovation Union, Taking Stock 2010-2014”, Brussels.
European Council (2001), “Presidency Conclusions, Göteborg European Council, 15-16 June 2001”.
EEA (2014), “Resource-efficient Green Economy and EU policies”, European Environment Agency, EEA Report No. 2/2014, Brussels.
Eco-Innovation Observatory (EIO) (2011), “The Eco-Innovation Challenge: Pathways to a resource-efficient Europe”, Eco-Innovation Observatory, Funded by the European Commission, DG Environment, Brussels.
Eco-Innovation Observatory (EIO) (2013), “Europe in transition: Paving the way to a green economy through eco-innovation, Eco-Innovation Observatory”, funded by the European Commission, DG Environment, Brussels.
European Sustainable Development Network (ESDN) (2014), “Single Country Profile – Greece”, (http://tinyurl.com/kh6m3ku).
Hellenic Statistical Authority (ELSTAT) (2014), “Greece in figures, 2014”, available at:
(http://tinyurl.com/nrpzhrd).
Khor, M. (2012), “Challenges of the Green Economy Concept and Policies in the Context of Sustainable Development, Poverty and Equity”, in UN-DESA, UNEP and UNCTAD (eds), The Transition to a Green Economy: Benefits, Challenges and Risks from a Sustainable Development Perspective, report by a Panel of Experts to Second Preparatory Committee Meeting for United Nations Conference on Sustainable Development.
Meadows, D.H., D.L. Meadows, J. Randers and W.W Behrens III (1972), The Limits to Growth: A Report for the Club of Rome’s Project on the Predicament of Mankind, New York: Universe Books.
Netzer, N. and J. Althaus (2012), “Introduction”, in N. Netzer and J. Althaus (eds), Green Economy. Turning Over a New Leaf towards Sustainable Development?, Friedrich-Ebert
-Stiftung (FES), Berlin.
OECD (2005), “Oslo Manual - Guidelines for Collecting and Interpreting Innovation Data”, Third edition, A joint publication of OECD and Eurostat, Paris.
OECD (2008), ‘’Handbook on Constructing Composite Indicators. Methodology and User Guide’’. OECD: Paris
OECD (2009a), “Eco-Innovation in Industry - Enabling Green Growth”, Paris.
OECD (2009b), “Sustainable Manufacturing and Eco-Innovation: Towards a Green Economy”, OECD Policy Brief, Paris.
OECD (2011), “Towards Green Growth: Monitoring Progress. OECD Indicators”, Paris.
Ocampo, J.A (2012), “The Transition to a Green Economy: Benefits, Challenges and Risks from a Sustainable Development Perspective. Summary of Background Papers”, in UN-DESA, UNEP and UNCTAD (eds), The Transition to a Green Economy: Benefits, Challenges and Risks from a Sustainable Development Perspective, report by a Panel of Experts to Second Preparatory Committee Meeting for United Nations Conference on Sustainable Development.
Pansera, M (2012), “The Origins and Purpose of Eco-Innovation”, Global Environment - A Journal of History and Natural and Social Sciences.
Stevens, C (2005), “Measuring Sustainable Development”, OECD Statistics Brief, Paris.
Tarnawska, K. (2013), “Eco-Innovations-Tools for the Transition to Green Economy”, Economics and Management 18 (4).
UNEP (2012), “Measuring Progress Towards an Inclusive Green Economy”, United Nations Environment Programme.
Annex I: List of eco-innovation indicators featured in measuring-progress.eu
Eco-innovation index (scoreboard)
http://measuring-progress.eu/eco-innovation-indexEco-innovation inputs
http://measuring-progress.eu/eco-innovation-inputs Governments’ environmental and
energy R&D appropriations and outlays (% of GDP)
http://measuring-progress.eu/governments-environmental-and-energy-rd-appropriations-and-outlays-gdp
Human resources in science and technology (% of active
population)
http://measuring-progress.eu/human-resources-science-and-technology-active-population
Venture capital – early stage
investment http://measuring-progress.eu/venture-capital-early-stage-investment
Eco-innovation activities
http://measuring-progress.eu/eco-innovation-activities Firms having implemented
innovation activities aiming at a reduction of material input per unit output (% of total firms)
http://measuring-progress.eu/firms-having-implemented- innovation-activities-aiming-reduction-material-input-unit-output
Firms having implemented innovation activities aiming at a reduction of energy input per unit output (% of total firms)
http://measuring-progress.eu/firms-having-implemented- innovation-activities-aiming-reduction-energy-input-unit-output-total-firms
ISO 14001 registered organisations (per mln population)
http://measuring-progress.eu/iso-14001-registered-organisations-mln-population
Eco-innovation outputs
http://measuring-progress.eu/eco-innovation-outputs Eco-innovation related patents
(per mln population) http://measuring-progress.eu/eco-innovation-related-patents-mln-population Eco-innovation related academic
publications (per mln population) http://measuring-progress.eu/eco-innovation-related-academic-publications-mln-population Eco-innovation related media
coverage (per numbers of electronic media)
http://measuring-progress.eu/eco-innovation-related-media-coverage-numbers-electronic-media
Resource efficiency outcomes
http://measuring-progress.eu/resource-efficiency-outcomes Material productivity
(GDP/domestic material consumption)
http://measuring-progress.eu/resource-productivity-gdpdomestic-material-consumption
Water productivity (GDP/water
Energy productivity (GDP/gross
inland energy consumption) http://measuring-progress.eu/energy-productivity-gdpgross-inland-energy-consumption GHG emissions intensity
(CO2e/GDP) http://measuring-progress.eu/ghg-emissions-intensity-co2egdp
Socio-economic outcomes
http://measuring-progress.eu/socio-economic-outcomes Exports of products from
eco-industries (% of total exports) http://measuring-progress.eu/exports-products-eco-industries-total-exports Employment in eco-industries
and circular economy (% of total employment across all companies)
http://measuring-progress.eu/employment-eco-industries-
and-circular-economy-total-employment-across-all-companies
Turnover in eco-industries http://measuring-progress.eu/turnover-eco-industries
Other eco-innovation and innovation indicators
Global innovation index http://measuring-progress.eu/global-innovation-index Innovation Union scoreboard http://measuring-progress.eu/innovation-union-scoreboard Green transition scoreboard http://measuring-progress.eu/green-transition-scoreboard Global cleantech innovation
index http://measuring-progress.eu/global-cleantech-innovation-index Eco-label licences http://measuring-progress.eu/ecolabel-licenses
Green patents, index 1990=100 http://www.measuring-progress.eu/green-patents-index-1990100
MSCI Global clean technology
index http://www.measuring-progress.eu/msci-global-clean-technology-index Organisations and sites with
EMAS (Eco-management and audit scheme) registration
http://www.measuring-progress.eu/organisations-and-sites-emas-eco-management-and-audit-scheme-registration
Public spending in
environmentally related RD, % total public spending
http://www.measuring-progress.eu/public-spending-environmentally-related-rd-total-public-spending
Technology achievement index http://www.measuring-progress.eu/technology-achievement-index
|
About NETGREEN
NETGREEN is an EU-funded project that aims to advance progress towards a green economy. The key output of the project is an open access, interactive website (www.measuring-progress.eu) providing information on green economy indicators. Partners in NETGREEN are: Ecologic Institute (lead partner), the Centre for European Policy Studies (CEPS), the New Economics Foundation (NEF), LEI Wageningen UR, the Centre for Environmental and Sustainability Research (CENSE). Project coordination is provided by the Ecologic Institute.
ACKNOWLEDGEMENT & DISCLAIMER
The research leading to these results has received funding from the European Union FP7 ENV.2013.6.5-1: Network for green growth indicators under the grant agreement n° 308680. Neither the European Commission nor any person acting on behalf of the Commission is responsible for the use which might be made of the following information. The views expressed in this publication are the sole responsibility of the author and do not necessarily reflect the views of the European Commission.