Categorization of paper (Style: Ariel Narrow, 8pt)
14pt
14pt
Influence of Clay Block Masonry Properties on the Out-of-Plane Behaviour of Infilled RC
Frames
14pt
Filip ANIĆ, Davorin PENAVA, Damir VAREVAC, Vasilis SARHOSIS
14pt
Abstract: In order to determine the characteristics that govern the out-of-plane behaviour of masonry infills, two groups of wall specimens were build and tested in the
laboratory. Specimens were assembled and tested as described in EN 1052-2 provisions and constitute of flexural strength for a plane of failure parallel and perpendicular to the bedjoints specimens. By obtaining data from experiments, numerical micromodels developed to predict their mechanical behaviour. A calibration procedure undertaken and results obtained from the experimental campaign found to be in agreement with those obtained from the numerical models. Additionally, former in-plane infilled frame numerical models were tested with acquired out-of-plane calibrated material model. No significant difference was found.
8pt
Keywords: clay block masonry infill, out-of-plane behaviour, flexural test, micromodels
10pt 10pt
1 INTRODUCTION
10pt
Reinforced concrete (RC) frames infilled with unreinforced masonry units (URM) is a common structural practice in seismically active South Europe (Booth & Key, 2006). European earthquake design provisions Eurocode 8 (CEN, 2004b) regard wall infill/panels as an secondary elements, i.e. they do not contribute to overall seismic behaviour. However, it was known that infills contribute in seismic behaviour of RC frames even in the late 1960’s. From there, interest in seismic behaviour of infilled frames has grown (Asteris et al., 2017; Trapani et al., 2015; Asteris et al. 2016) on separate fields of in-plane (IP) loading, out-of-plane (OOP) loading and their combination (IP + OOP). A large amount of experimental and analytical studies have been done in the field of IP, the same cannot be stated for the OOP and especially for IP + OOP interaction (Asteris et al., 2017; Wang et al. 2016). Moreover, the OOP field is based on analytical research of arching action, and numerical, i.e. computational research is scares and is based on membrane and strut with centred mass models.
Consequently, this paper is a part of OOP research with the intention to account properties that determine behaviour of infills subjected to OOP loading. Accordingly, 20 masonry wall specimens were tested and numerical micro models calibrated to account the experiment.
2 METHODS, MATERIALS AND RESULTS OF TESTED WALL SPECIMENTS
10pt
2.1. Experiment preparation
10pt
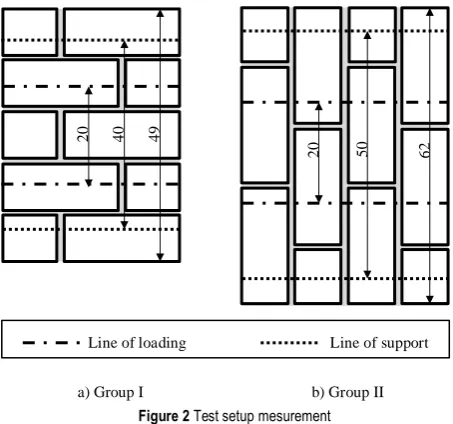
The experiment preparation and testing was done in accordance to EN 1052-2 (British Standards Institution, 2016). Two testing groups were made: Group I: flexural strength for a plane of failure parallel to the bedjoints, and Group II: flexural strength for a plane of failure perpendicular to the bedjoints (parallel to headjoints). The recommendation of 10 wall test specimens for each Group was adopted in favour of statistical significance (Sorić, 2016). Wall specimens are made from whole and half-length blocks (fig.2).
Firstly, hollow clay masonry units (fig.1a) were cut in half of their height (fig.1b) to emulate the units used as an infill in RC frames testing from (Penava, 2012) and units that will be used in further experiments.
Mortar joints have designated M5 class according to EN 1996-1-1 (CEN, 2005) and nominal 10 mm thickness.
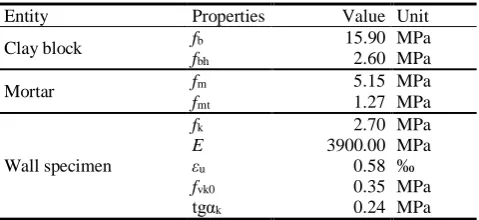
Pretested properties of clay blocks, mortar and wall specimens are presented on the table 1.
Test setup of masonry wall specimens can be seen on a figure 2, 4c & 4f. The average dimensions of 10 specimens in each group as well as test setup dimensions are shown on figure 2. Testing was conducted with an increasing monotonic load on a 4-point (2 line reactions + 2 line loads) load setup on Controls 50-C1201/BFR by 50-C1200/8 apparatus.
a) Original clay block b) Modified clay block
[image:1.595.317.557.602.712.2]Figure 1 Masonry unit
Table 1 Pretested mechanical properties (Penava, 2012)
Entity Properties Value Unit
Clay block fb 15.90 MPa
fbh 2.60 MPa
Mortar fm 5.15 MPa
fmt 1.27 MPa
Wall specimen
fk 2.70 MPa
E 3900.00 MPa
εu 0.58 ‰
fvk0 0.35 MPa
tgαk 0.24 MPa
mortar (blocks are undamaged) or b) failure trough the specimens (blocks failed). The b) failure is more likely to happen as fmt > fbh.
[image:2.595.318.554.51.500.2]a) Group I b) Group II
Figure 2 Test setup mesurement
2.2.Experimental results
Averaged results of the conducted test can be seen on table 2 & its distribution on figure 3. Figure 3 shows the minimum (MIN), maximum (MAX) and mean strength (AVG) with its variation within standard deviation (straight lines), i.e. fx ± s. Flexural strength was calculated by equation 1 from (British Standards Institution, 2016). Group I failed by separation of block rows by the bedjoint at the specimens mid-height (fig4d&e). Group II failed by failing clay blocks (fig4g&h), hence, through the whole wall specimen.
Table 2 Mean reults from flexular test
Properties Group I Group II Unit
Fmax 4.07 6.69 kN
fx (eq.1) 0.21 0.38 MPa
s 0.07 0.06 MPa
cv 0.28 0.18 /
bt l l F fx
2
3 max 1 2
[image:2.595.56.283.102.314.2] (1)
Figure 3 Strenght distribution
a) Group I specimens b) Group II specimens
c) Group I test setup d) Group I failure
e) Typical failure of Group I
f) Group II test setup g) Group II failure
h) Typical failure of Group II Figure 4 Test setup and failure modes
3. METHODS, MATERIALS AND RESULTS OF
NUMERICAL MODEL
3.1. Numerical model
Numerical models were assembled and tested using Atena 3D Eng (Cervenka Consulting, 2015). A three-dimensional micromodeling approach was used, constructed from three-dimensional solid and two-dimensional contact – interface (zero thickness) elements (fig.5). The construction of numerical model was carried out by assembling solid elements that have dimensions same as the real clay masonry unit (fig.1), they are jointed by zero thickness interface elements, thus, the dimensions of the numerical model and real specimens (fig.2) differ. Distance between loading (fig.6) was adopted as in experiments.
Figure 6 shows numerical model with its boundary conditions. The wall specimens were simply supported and loaded with uniform continuous line load in –z
direction. When uniform loads form figure 6 are
Group I Group II
0.00 0.05 0.10 0.15 0.20 0.25 0.30 0.35 0.40 0.45 0.50
fxk
MAX
MIN
AVG 20 40 49
20 50 62
[image:2.595.53.296.480.761.2]multiplied by their length of their span, the force corresponds to 0.5 kN/step force each.
Furthermore, solid elements beyond the supports in the numerical model (fig.6) were discarded in order to gain faster calculation time. It is to be noted that the calculation with solids continuing beyond the supports was carried out, and no significant differences was observed from those without solids beyond supports.
Figure 5 Micromodel composition
a) Group I
b) Group II Figure 6 Numerical model setup
3.2. Numerical material models and calibration
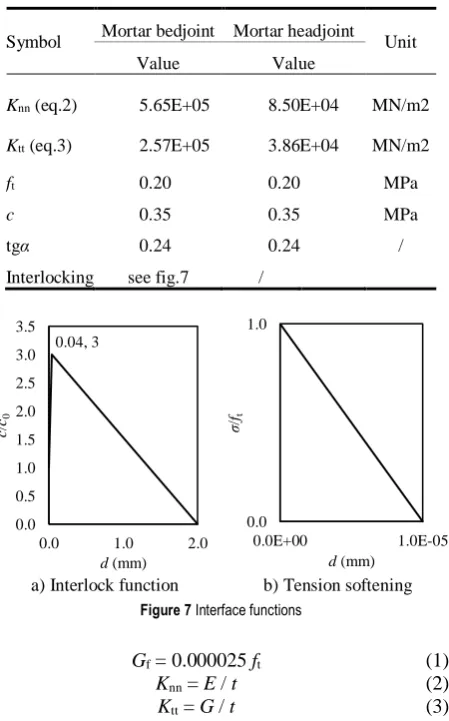
Numerical material models (tab.3&4) were adopted form (Penava, Sigmund, & Kožar, 2016) and modified during the calibration. The CC nonlinear cementitious 2 material model from table 3 was used for modelling clay masonry units, hence, solid elements. Likewise, CC interface material model from table 4 was used to model the mortar joints, hence, 2D interface gap elements. The interlocking effect of mortar filling the voids of opposite blocks and
[image:3.595.317.525.115.313.2]thereby locking them is modelled by interlocking function (fig.7).
Table 3 CC Nonlinear Cementitious 2 model (Cervenka, Jendele, & Cervenka, 2012)
Properties Value Unit
E 5.650 E+03 MPa
μ 0.100 /
ft 0.380 MPa
fc -1.750 E+01 MPa
Gf (eq.1) 4.500 E-04 MN/m
Wd -5.000 E-04 /
εcp -1.358 E-03 /
rc,lim 0.800 /
SF 20.000 /
[image:3.595.58.249.257.640.2]Crack model coefficient 1.000 /
Table 4 CC 3D interface model (Cervenka et al., 2012)
Symbol Mortar bedjoint Mortar headjoint Unit
Value Value
Knn (eq.2) 5.65 E+05 8.50 E+04 MN/m2
Ktt (eq.3) 2.57 E+05 3.86 E+04 MN/m2
ft 0.20 0.20 MPa
c 0.35 0.35 MPa
tgα 0.24 0.24 /
Interlocking see fig.7 /
a) Interlock function b) Tension softening
Figure 7 Interface functions
Gf = 0.000025 ft (1)
Knn = E / t (2)
Ktt = G / t (3)
The mentioned models from (Penava et al., 2016) acquire properties of clay blocks in direction of voids, however, during the analysis of the results from conducted numerical tests they were inadequate for modelling of Group II, i.e. the response was higher than measured by experiments. To that end, changes to tensile
0.0 0.5 1.0 1.5 2.0 2.5 3.0 3.5
0.0 1.0 2.0
c
/
c0
d(mm) 0.04, 3
0.0 1.0
0.0E+00 1.0E-05
σ
/
ft
d(mm)
1.25E-4 (MN/m) /step
1.33E-4 (MN/m) /step
[image:3.595.311.536.337.698.2]strength and tension softening function was introduced. Tensile strength was changed from that in the direction of voids ft = 1.80 MPa to that of perpendicular to the voids ft = 0.38 MPa as the OOP loading caused failure of the clay blocks in direction perpendicular to voids. The displacement tension softening function through trial and error was adjusted from d = 0.010 mm to d = 0.001 mm. Fracture energy calculation depends upon tensile strength (eq.1) (Vos, 1983), however it was left unchanged, i.e. as if tensile strength in eq.1 was is in the direction of voids. If tensile strength in eq.1 was changed to be perpendicular to the voids, a predeveloped failure occurs in both Groups.
3.3. Numerical test results
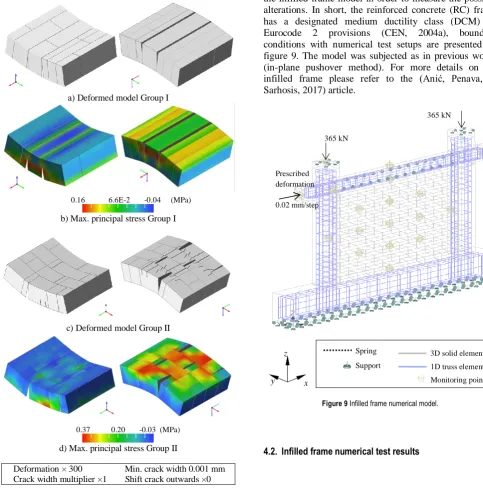
With changes to the material models, the results from numerical tests are shown on figure 8 and table 5. Table 5 shows the force at failure and maximal principal stress obtained from figure 8.
a) Deformed model Group I
b) Max. principal stress Group I
c) Deformed model Group II
d) Max. principal stress Group II
[image:4.595.55.539.296.785.2]Deformation × 300 Min. crack width 0.001 mm Crack width multiplier ×1 Shift crack outwards ×0
Figure 8 Numerical test results at Fmax Table 5 Results from numerical tests
Group Fmax (kN) σmax (MPa)
I 4.50 /
II 6.20 0.37
By Figure 8a it can be observed that numerical model of Group I had failure by discontenting bedjoints, i.e. mortar tensile failure. Figure 8c shows failures and cracking of the clay blocks.
4. ADDITIONAL INVESTIGATION ON INFILED FRAME
4.1. General information
Having material model properties changed, previous work with unreinforced masonry infilled (URM) RC frames (Anić, Penava, Legatiuk, & Sarhosis, 2017; Anić, Penava, & Sarhosis, 2017; Sarhosis 2016) was questioned. Hence, the modifications to the infill units were implemented into the infilled frame model in order to measure the possible alterations. In short, the reinforced concrete (RC) frame has a designated medium ductility class (DCM) by Eurocode 2 provisions (CEN, 2004a), boundary conditions with numerical test setups are presented on figure 9. The model was subjected as in previous works (in-plane pushover method). For more details on the infilled frame please refer to the (Anić, Penava, & Sarhosis, 2017) article.
Figure 9 Infilled frame numerical model.
4.2. Infilled frame numerical test results
0.16 6.6E-2 -0.04 (MPa)
0.37 0.20 -0.03 (MPa)
y z
x
365 kN
365 kN
Prescribed deformation
0.02 mm/step
Monitoring point 3D solid elements
1D truss elements Support
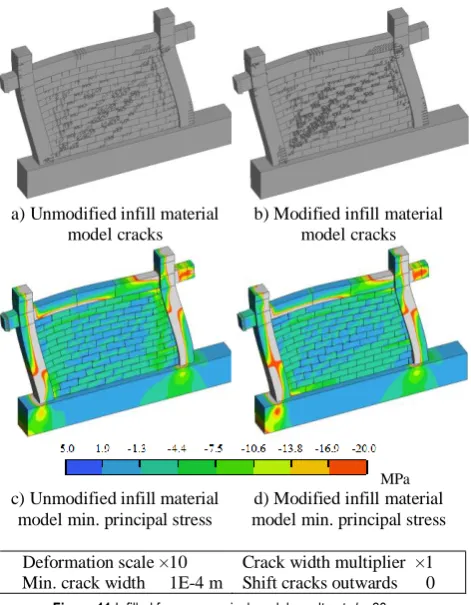
[image:4.595.59.294.301.750.2] [image:4.595.324.557.402.686.2]Force displacement diagrams of both infill material models are shown on figure 10. Cracks and minimal principal stresses for each of the two are shown on figure 11.
Figure 10 Force displacement diagram of infilled frame model
a) Unmodified infill material model cracks
b) Modified infill material model cracks
MPa
c) Unmodified infill material model min. principal stress
d) Modified infill material model min. principal stress
Deformation scale ×10 Crack width multiplier ×1 Min. crack width ×1E-4 m Shift cracks outwards ×0
Figure 11 Infilled frame numerical model results at d = 28 mm
5. CONCLUSIONS AND DISCCUSION OF THE RESULTS
By comparing numerical and experimental results of Group I & II, differences force-wise were calculated as 9.55% for Group I and 7.32% for Group II. Group II has stress-wise difference of 2.63%.
Based on flexural testing of masonry wall specimens a numerical model was compiled and calibrated.
Calibration included modifying tension strength and displacement in tension softening function. Tension strength was changed from the value in direction of voids to the value perpendicular to voids. The calibration has proven adequate enough to have high correlation with the experiments. It is to be noted that the calibration was carried out in favour of Group II as Group I due the specific failure mode (reaching tensile strength of mortar) had agreement with the experiments from beginning.
Additionally, an infilled framed was tested in order to observe the validity due to changes in material model of clay blocks. It was shown that the changes did not drastically affect the outcome force (fig.10), crack and stress wise (fig.11).
In summation, the following conclusions can be drawn: a) Wall specimens had failure modes as predicted,
Group I had failure along bedjoints due to reaching mortar tensile strength. Group II failed along the blocks, reaching tensile strength of the blocks in direction perpendicular to the voids. b) In order to simulate OOP bending, a mix of
mechanical properties had to be implemented into the material models. Tensile strength of clay masonry unit was set to have the value perpendicular to the voids, end displacement in tension softening function was lowered, other properties have mechanical values in direction of voids.
c) Numerical models of Group I & II had failure mechanism same as the experimental ones (fig.4&8). Likewise, the numerical results force and stress wise have satisfying degree of agreement.
d) When the load is parallel to bedjoints, governing element are the bedjoints, more exactly mortars tensile strength. On the other hand, when the load is parallel to headjoints, the governing elements are properties of the clay block, i.e. its tensile strength.
e) The changes of material models had no significant effect on the URM frame model in regards to crack and stress pattern as well as force – displacement curve.
f) Regarding the changes to numerical model of clay masonry block and its unneglectable effect to the IP pushover analysis of URM frames it obvious that the main governing element of URM frames are interfaces, more exactly bedjoint.
6. LIST OF SYMBOLS
Test specimens
l1 Distance between supports
l2 Distance between loading
b Specimens length
t Specimens thickness
Mechanical (tested) properties
fb
Clay blocks normalized compression strength in direction of voids
fbh Clay blocks normalized compression strength in direction
perpendicular to voids
fm Mortars compressive strength
fmt Mortars flexural strength
0 50 100 150 200 250 300 350 400 450 500
0 7 14 21 28
VR
(k
N
)
d(mm)
Modified infill material model
[image:5.595.43.279.358.661.2]fk Characteristic masonry wall compressive strength
E Elastic modulus of wall specimen
εu Ultimate wall strain
fvk0 Initial shear strength
tgαk Friction coefficient
fx1 Flexural strength for a plane of failure parallel to the bedjoints – Group I
fx2 Flexural strength for a plane of failure perpendicular to the bedjoints (parallel to headjoints) – Group II
s Standard deviation (STDEV)
cv Variation coefficient
Numerical material properties
E Elastic Modulus
μ Poisson’s coefficient
ft Tensile strength
fc Compressive strength
Gf Fracture Energy
Wd Plastic displacement
εcp Strain at fc
rc,lim Maximal strength reduction under the large transverse strain
SF Shear factor coefficient that defines a relationship between
normal and shear crack stiffness.
Knn Normal interface stiffness
Ktt Tangential interface stiffness
c Cohesion
tgα Friction coefficient
VR Shear force
d Displacement
7. REFERENCES
10pt
Anić, F., Penava, D., Legatiuk, D., & Sarhosis, V. (2017). Influence of variability in materials used on seismic response of masonry infilled reinforced concrete frames. In Osmi susret Hrvatskog društva za mehaniku (pp. 1–9). Osijek, Croatia. Retrieved from http://bib.irb.hr/prikazi-rad?rad=885880
Anić, F., Penava, D., & Sarhosis, V. (2017). Development of a three-dimensional computational model for the in-plane and out-of-plane analysis of masonry-infilled reinforced concrete frames. In 6th International Conference on Computational Methods in Structural Dynamics and Earthquake Engineering. Rhodes Island, Greece. Asteris, P. G., Cavaleri, L., Di Trapani, F., & Tsaris, A. K.
(2017). Numerical modelling of out-of-plane response of infilled frames: State of the art and future challenges for the equivalent strut macromodels. Engineering Structures, 132, 110–122.
https://doi.org/10.1016/j.engstruct.2016.10.012 Asteris PG, Cavaleri L, Di Trapani F, Sarhosis V. A
macro-modelling approach for the analysis of infilled frame structures considering the effects of openings and vertical loads. Structure and Infrastructure Engineering 2016, 12(5), 551-566.
Booth, E. D., & Key, D. (2006). Earthquake Design Practice for Buildings. Cambridge: Thomas Telford. Retrieved from http://ebooks.cambridge.org/ref/id/CBO9781107415324A 009
British Standards Institution. (2016). Methods of test for masonry Part 2: Determination of flexural strength. Bs En 1052-2.
CEN. (2004a). Eurocode 2: Design of concrete structures - Part 1-1: General rules and rules for buildings (EN 1992-1-1:2004). Brussels: European Committee for
Standardization.
CEN. (2004b). Eurocode 8: Design of Structures for Earthquake Resistance - Part 1: General Rules, Seismic Actions and
Rules for Buildings (EN 1998-1:2004). Brussels: European Committee for Standardization.
CEN. (2005). Eurocode 6: Design of masonry structures - Part 1-1: General rules for reinforced and unreinforced masonry structures (EN 1996-1-1:2005). Brussels: European Committee for Standardization. Cervenka, V., Jendele, L., & Cervenka, J. (2012). ATENA
Program Documentation Part 1 Theory. Prague: Cervenka Consulting Ltd.
Cervenka Consulting. (2015). ATENA for Non-Linear Finite Element Analysis of Reinforced Concrete Structures. Prague: Červenka Consulting s.r.o.
Penava, D. (2012). Influence of openings on seismic response of masonry infilled reinforced concrete frames.
Penava, D., Sigmund, V., & Kožar, I. (2016). Validation of a simplified micromodel for analysis of infilled RC frames exposed to cyclic lateral loads. Bulletin of Earthquake Engineering, 14(10), 2779–2804.
https://doi.org/10.1007/s10518-016-9929-0
Sarhosis V. An optimization procedure for material parameter identification in masonry constitutive models.
International Journal of Masonry Research and Innovation 2016, 1(1), 48-58.
Sorić, Z. (2016). Zidane konstrukcije. Zagreb: Sveučilište u
Zagrebu.
Trapani, F. Di, Macaluso, G., Cavaleri, L., Papia, M., Di, F., Macaluso, G., … Papia, M. (2015). Masonry infills and RC frames interaction : literature overview and state of the art of macromodeling approach. European Journal of Environmental and Civil Engineering, 19(9).
https://doi.org/10.1080/19648189.2014.996671 Vos, E. (1983). Influence of loading rate and radial pressure on
bond in reinforced concrete. A numerical and experimental approach. Thesis.
Wang C, Forth JP, Nikitas N, Sarhosis V. Retrofitting of masonry walls by using a mortar joint technique; experiments and numerical validation. Engineering Structures 2016, 117, 58-70.
10pt
Contact information:
Filip ANIĆ, mag. ing. aedif
(Corresponding author)
Josip Juraj Strossmayer University of Osijek, Faculty of Civil Engineering Osijek Vladimira Preloga 3, 31000 Osijek, Croatia [email protected]
doc. dr. sc. Davorin PENAVA, dipl. ing. građ.
Josip Juraj Strossmayer University of Osijek, Faculty of Civil Engineering Osijek Vladimira Preloga 3, 31000 Osijek, Croatia [email protected]
izv. prof. dr. sc. Damir VAREVAC, dipl. ing. građ.
Josip Juraj Strossmayer University of Osijek, Faculty of Civil Engineering Osijek Vladimira Preloga 3, 31000 Osijek, Croatia [email protected]
doc. dr. sc. Vasilis SARHOSIS, dipl. ing. građ.
Newcastle University, School of Engineering,