EU budget 2011
Financial Report
KV
-AI-12-001-EN-C
doi:10.2761/90375
For more information on the EU budget
and financial programming:
http://ec.europa.eu/budget/index_en.cfm
(available in English, French and German)
European Commission Directorate-General for the Budget:
http://ec.europa.eu/dgs/budget/index_en.htm
Janusz Lewandowski, Commissioner for Financial Programming
and Budget:
http://ec.europa.eu/commission_2010-2014/lewandowski/index_en.htm
For feedback on this publication:
[email protected]
EU budget 2011 — F
inancial Report
EU budget
2011
Photo credits: ccvision.de, page 27
Eric Audras/PhotoAlto, page 47
European Union, pages 5, 42, 53, 56, 63, 74, 76, 81, 89 European Union/Borja Cuervo Alonso, page 81
European Union/Karin Jonsson, page 85 European Union/Yvan Hildebrand, page 81 GlowImages, page 42
image100 Ltd, page 74 Image Source, page 48 IngramStock, page 58
iStockphoto.com/Andreas Prott, page 42 iStockphoto.com/AntiMartina, page 13 Jupiterimages, pages 45, 58, 64 Laurent Hamels/PhotoAlto, page 49 Photodisc/Getty Images, pages 62, 89
Photodisc/Getty Images/C. Lee/PhotoLink, page 81 Photodisc/Getty Images/Flying Colours Ltd, page 69 Phovoir, pages 42, 58, 61, 64, 74
Sigrid Olsson/Zen Shui/PhotoAlto, page 58 Stockbyte/Getty Images, page 69
Turku 2011/Kari Vainio, page 74 Veer Incorporated, pages 35, 69 Ventura Ale/PhotoAlto, page 46
More information on the European Union is available on the Internet (http://europa.eu). Cataloguing data can be found at the end of this publication.
Luxembourg: Publications Office of the European Union, 2012 ISBN 978-92-79-24938-9
doi:10.2761/90375 © European Union, 2012
Reproduction is authorised provided the source is acknowledged.
Printed in Luxembourg
P - www.fsc.org FSC® C021878
Europe Direct is a service to help you find answers to your questions about the European Union
Freephone number (*): 00 800 6 7 8 9 10 11
Contents
Foreword ...5
Executive summary ...7
Section I — Overview ...13
Financial framework ...15
The budgetary procedure ...16
Budget management ...20
Section II — Revenue ...27
Section III — Expenditure ...35
Allocation of EU expenditure for 2011 by Member State ...37
Allocation of 2011 EU expenditure by heading and by Member State ...40
Competitiveness for growth and employment ...42
Cohesion for growth and employment ...58
Preservation and management of natural resources ...64
Freedom, security and justice ...69
Citizenship...74
The EU as a global player ...81
Administration...89
Annexes ...93
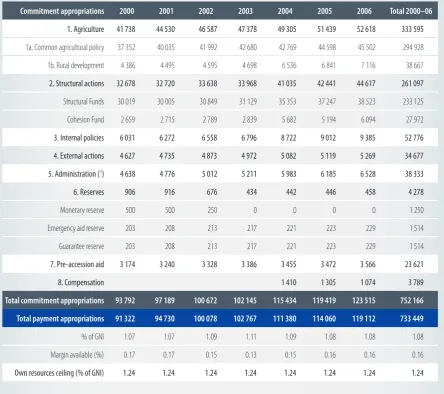
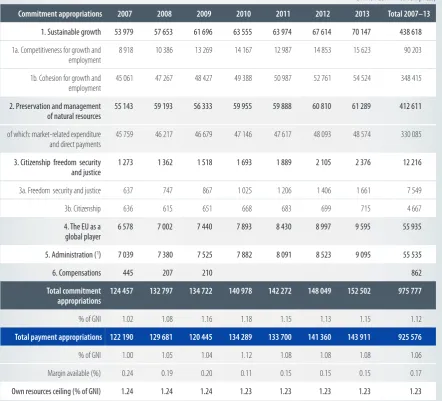
Annex 1 — Financial frameworks 2000–06 and 2007–13 ...94
Annex 2 — Expenditure and revenue 2000–13 by heading, type of source and Member State ...96
Annex 3 — Operating budgetary balances ...100
Annex 4 — Recoveries and financial corrections...103
Annex 5 — Borrowing and lending activities ...107
Foreword
In 2011 the economic and financial crises put an enormous strain on Member States’ finances, and this made budgetary negotiations at European level even more difficult than in 2010. Despite these harsh conditions, two positive developments can be noted: the substantial acceleration of execution of Union programmes, which shows that commit-ments made out of the European Union budget in previous years are turned into investments and the resilience of the European ‘label’ against market disturbances. In financial circles, European funding is considered extremely safe and the private sec-tor is thus far more likely to embark on investment projects when they are backed by the EU budget. One euro invested in an EU-funded project generates up to EUR 10 of private sector co-investment.
In order to help some of the EU’s most troubled economies back on track, the EU has decided to increase the EU co-financing contribution to Structural Funds to a maximum of 95 % if requested by any of the Member States concerned (Greece, Ireland, Por-tugal, Romania, Latvia and Hungary). New perspectives have thus been opened for programmes that had not been executed for lack of national funding. An additional opportunity of making up to EUR 3 billion available opened for the countries most hit by the crises in 2011.
In terms of execution, 2011 confirmed the Commission’s expectations and brought high implementation rates especially for policies that boost economic growth and em-ployment opportunities. In many programmes, all resources were completely used, and sometimes the budgeted payments were even exceeded and needed reinforcement. This was particularly the case for research, competitiveness and innovation, as well as for the ‘Lifelong learning’ programme. These actions are at the core of the Europe 2020 strategy for smart, sustainable and inclusive growth.
F I N A N C I A L R E P O R T
6
The year 2011 was also marked by the presentation by the Commission of its pro-posals for an ambitious, but realistic, multiannual financial framework for the period 2014–20. While proposing a stabilisation of EU expenditure in volume at the level of the 2013 ceiling, the Commission has proposed important reorientation of European finances in order to focus on growth and jobs-oriented expenditure. The plan is to almost treble the investments in infrastructure, and to allow for major increases in re-search, innovation and education. The current adverse economic conditions should not jeopardise the very conditions which will lead to economic recovery. This was planned at no additional costs to the European taxpayers and in a simpler, more transparent and fairer way.
I have great pleasure in presenting this Financial Report 2011, which describes how the yearly budgetary cycle is managed, provides detailed information on the sources of EU financing and gives a basic overview of EU expenditure traditionally grouped under the headings of the current multiannual financial framework. I hope you will find interest-ing information in this report, which aims at providinterest-ing transparency on Union financial matters, and that you will appreciate the new interactive way of presentation offered through its e-version.
Executive summary
This report contains four sections: overview, revenue, expenditure and annexes. Section I presents an overview of EU finances in 2011. It introduces the multiannual financial framework (MFF), including its role and structure and the specific activities that take place under the annual budgetary procedure. The section ends with a short description of the way the EU budget is managed.
Section II provides information on the budget revenue and describes the EU budget’s own resources. It also explains a number of particularities such as the UK correction, other revenue and donations.
Section III represents the main part of the report, covering the expenditure part of the EU budget grouped by heading (category) according to the current MFF. The text includes in-formation on the main programmes as well as on the expenditure allocations by Member State. This section also familiarises the reader with the expenditure methodology. Section IV consists of six annexes which provide detailed information, with figures and charts on the past MFF (2000–06) and on the current one (2007–13). The annexes also show the expenditure and revenue by heading, source type and Member State, for the period 2000–13, as well as the methodology and calculation of the operating budgetary balances in Annex 3. Recoveries and financial corrections are detailed in Annex 4, while Annex 5 summarises the borrowing and lending activities. The last annex is a glossary with the main terminology of the report explained in plain language.
Section I — Overview
Financial framework
F I N A N C I A L R E P O R T
8
The budgetary procedure
Based on the multiannual financial framework in force and the budget guidelines for the coming year, the European Commission prepares the dra0 budget. The budgetary authority, comprised of the European Parliament and the Council, usually amends the dra0 budget and following further negotiations adopts the annual EU budget prior to the end of the current calendar year.
In the dra0 EU budget for 2011 presented on 27 April 2010, the Commission proposed EUR 142.6 billion in commitment appropriations and called for a 5.9 % increase in payment appropriations compared to the 2010 budget totalling EUR 129.1 billion. On 12 August 2010, the Council set commitment appropriations at EUR 141.8 billion and reduced payment appropriations to EUR 126.5 billion. On 20 October 2010, Parliament called for a 6 % increase compared to the 2010 budget and proposed commitment ap-propriations of EUR 143.1 billion. The level of payments was set at EUR 130.6 billion. The Conciliation Committee did not reach an agreement and the Commission had to present a new dra0 budget to reflect the near-compromise reached in the conciliation. The new dra0 budget presented by the Commission on 26 November 2010 was ac-cepted by the Council on 10 December and adopted by Parliament on 15 December. The EU budget adopted for 2011 set the commitment appropriations at EUR 141.9 bil-lion and payment appropriations at the level requested by the Council in August 2010, i.e. EUR 126.5 billion.
Budget management
The lifecycle of the EU budget, from approval of the annual budget onwards, means that the figures for the commitment appropriations and payment appropriations avail-able for a given financial year tend to vary over the course of the year. Procedures similar to the budgetary one apply to the adoption of amending budgets. The following factors influence the amounts of the annual budget over the financial year.
Carryovers represent amounts from the previous year’s budget that have not been used and are carried over to the current financial year. The carryover decision was taken by the Commission on 11 February 2011. Amending budgets ensure more precise and economical financing of the budget by the Member States. In 2011, a total of seven amending budgets were adopted. Moves of appropriations from one budget line to another are also made via transfers during the year.
As a result, the final budget represents the outcome, at the end of the financial year, of active budget management including all measures that have an effect on the total Commission budget — carryovers, amending budgets and transfers — which have been proposed and adopted during the financial year. Of the final budget for 2011 totalling EUR 128.3 billion, EUR 126.5 billion has been used.
Section II — Revenue
The EU budget is financed by own resources, other revenue and the balance carried over from the previous year. Total revenue must equal total expenditure. However, since outturns of revenue and expenditure usually differ from the budgeted estimates, there is a balance of the exercise resulting from the implementation. Normally, there is a surplus, which reduces Member States’ own resources payments in the subse-quent year. In 2011, own resources amounted to EUR 120 billion and other revenue to EUR 5.5 billion. The surplus carried over from 2010 amounted to EUR 4.5 billion. The overall amount of own resources is determined by total expenditure less other revenue. Own resources are divided into the following categories: traditional own re-sources (TOR); the VAT own resource; and the GNI own resource, which plays the role of residual resource.
Customs duties (TOR) are levied on economic operators and collected by Member States on behalf of the EU. In 2011, this resource corresponded to 13 % of total rev-enue. A production charge is paid by sugar producers (TOR). Revenue from this resource amounted to 0.1 % of total revenue in 2011.
The VAT own resource is levied on Member States’ VAT bases, which are harmonised for this purpose. However, the VAT base to take into account is capped at 50 % of each Member State’s GNI. In 2011, the total amount of the VAT own resource levied reached 11 % of total revenue.
The GNI own resource finances the part of the budget not covered by other revenue. The same percentage is levied on each Member State’s GNI, with two Member States receiving reductions. The amount of the GNI own resource needed depends on the dif-ference between total expenditure and the sum of all other revenue. In 2011, the total amount of the GNI resource levied reached 68 % of total revenue.
A specific mechanism for correcting budgetary imbalances in favour of the United Kingdom (UK correction) is also part of the own resources system. It is to correct the imbalance between the United Kingdom’s share in payments and expenditure of the EU budget. The total amount of the UK correction paid in 2011 amounted to EUR 3.6 billion. Revenue other than own resources includes taxes from EU staff remunerations and other diverse items. In 2011, this revenue amounted to EUR 5.5 billion.
EU revenue 2011
Traditional own resources (TOR), net (75 %); 12.9 %
Surplus from previous year; 3.5 %
GNI own resource; 68.0 %
F I N A N C I A L R E P O R T
10
Section III — Expenditure
As in the MFF, the annual EU budget expenditure is presented in the financial report for 2011 according to headings or subheadings. Data are also structured according to the allocation of expenditure by each Member State. Both presentations are based on authorised appropriations implemented in 2011, with some exceptions. In total, 94 % of the EU budget is funding policies and projects in Member States. The chart below provides an overview of how each country benefited from the budget and gives the relative importance compared with each Member State's gross national income (GNI) for a better understanding of the figures.
Expenditure by Member State
million EUR
% of GNI
0.0 1.5 3.0 4.5 6.0 7.5
0 2 500 5 000 7 500 10 000 12 500 15 000
PL ES FR DE IT BE UK EL HU PT CZ RO NL AT SK SE LT IE LU DK FI BG LV SI EE CY MT
1a. Competitiveness 1b. Cohesion 2. Natural resources 3a. Freedom, security, justice 3b. Citizenship 4. The EU as a global partner 5. Administration 6. Compensation % GNI
In 2011, EUR 117 336.9 million (i.e. 90.7 % of the total implemented EU expenditure including EFTA contributions and earmarked revenue) was allocated to Member States.
Competitiveness for growth and employment
The EUR 11.5 billion allocated in 2011 under this heading was at the heart of the drive to turn the EU into a smart, sustainable and inclusive economy delivering high levels of employment, productivity and social cohesion. It supported the main goals of the Europe 2020 strategy to increase the competitiveness of European businesses in order to face the present challenges and create more jobs and prosperity.
Cohesion for growth and employment
Under this heading, EUR 42.4 billion in 2011 covered the Structural Funds, i.e. the Euro-pean Regional Development Fund (ERDF) and the EuroEuro-pean Social Fund (ESF), as well as the Cohesion Fund (CF). Cohesion policy continued to aim at strengthening the eco-nomic and social cohesion of the Union in order to promote balanced and sustainable development. It is designed to reduce disparities between the levels of development of the various regions in the Member States. The resources available are concentrated on promoting economic convergence, in particular on sustainable growth, competitive-ness and employment.
Some EUR 32.3 billion was provided for investments to modernise and diversify eco-nomic structures across Europe’s least-developed regions and territories. Thanks to this the EU made visible progress in completing another part of the planned 25 000 km of roads and 7 700 km of railways to be built from scratch or reconstructed and over 500 000 jobs to be created by 2013. To adapt Europe’s workforce for a changing economic environment, training in new skills and guidance on how to get a job were funded by the European Social Fund, with EUR 9.5 billion.
Preservation and management of natural resources
The EU’s agriculture, rural development, fisheries and environment were financed under this heading, with an expenditure of EUR 56 billion in 2011. Smart and sustainable use of arable lands and forests plays a key role in determining the health of rural econo-mies as well as the rural landscape.
Some EUR 42.5 billion helped to stabilise the difficult financial situation of 7 million farmers, who had to meet high environmental standards, contributing to preserving a good quality of Europe’s soil, water and air. Another EUR 12.3 billion was invested in the economic diversification of rural areas, home to 50 % of the EU’s population. The European Fisheries Fund made available EUR 446 million to ensure the competitive-ness of Europe’s fishing sector, while maintaining reasonable prices for consumers. Some EUR 203 million was used for projects under the LIFE+ programme, coping with waste management, air pollution and the loss of biodiversity.
Freedom, security and justice
F I N A N C I A L R E P O R T
12
Citizenship
The EU budget contribution of EUR 899 million in 2011 included contributions to nu-merous Europe 2020 strategy flagship initiatives including ‘Youth on the move’, ‘An agenda for new skills and jobs’, ‘European platform against poverty’ and ‘Innovative Union’. Issues of particular concern to citizens, including health, consumer protection and civil protection, were covered. The crucial task of reaching out and communicating Europe was funded through cultural programmes and the policy area of ‘Communica-tion’.
To make Europe a culturally vibrant place, the ‘MEDIA’ and ‘Culture’ programmes con-tributed a total of around EUR 150 million, supporting the European film industry and promoting cross-border cooperation among artists and the European Capitals of Culture.
The EU as a global player
Some EUR 6.9 billion was spent from the EU budget in 2011 on the EU’s activities beyond its borders. Its paramount objectives in foreign policy are stability, security and neighbourhood prosperity. The EU’s more proactive foreign and security policy enabled it to carry out crisis management and peacekeeping missions in Europe and far beyond. The Development Cooperation Instrument (DCI) made available EUR 2 billion to ad-dress the basic needs of the people in 47 developing countries in Latin America, Asia and central Asia, the Gulf region and South Africa. Countries in eastern Europe, the south Caucasus and the southern Mediterranean bordering the EU received a total of EUR 1.4 billion from the European Neighbourhood and Partnership Instrument (ENPI), which promoted good governance and an equitable social and economic development process. The Instrument for Pre-Accession Assistance (IPA) provided EUR 1.3 billion to support EU candidate countries (Croatia, Turkey and the former Yugoslav Republic of Macedonia) and potential candidate countries in their efforts to come closer to Euro-pean standards and policies.
Some EUR 7.9 billion (just 6 % of the EU budget) was spent in 2011 to ensure the smooth operation of all EU institutions at the service of its approximately 500 million citizens. This covered, for example, staff salaries and pensions, buildings and infra-structure, information technology and security.
Section I
Overview
Financial framework
Since 1988, the EU annual budgets have been defined within the multiannual financial frameworks in order to ensure tighter budgetary discipline and to improve the function-ing of the budgetary procedure and interinstitutional cooperation.
The financial framework which ended in 2006 was agreed for a period of 7 years (2000–06) by the Interinstitutional Agreement (IIA) of 6 May 1999 on budgetary discip line and improvement of the budgetary procedure. It was the third financial pro-gramming period a0er those of 1988–92 and 1993–99.
The current financial framework was agreed for another period of 7 years (2007–13) by the IIA of 17 May 2006 on budgetary discipline and sound financial management.
Structure
Financial frameworks consist of headings (some of them broken down into subhead-ings) with annual limits (ceilsubhead-ings) for commitment appropriations set for each heading/ subheading. The sum of the ceilings of all headings gives the total ceiling of commit-ment appropriations. A corresponding estimate is then established for the annual ceil-ing of payment appropriations.
Total annual ceilings are expressed in millions of euro and in percentage of the gross national income of the EU (EU GNI). The total annual ceiling of payment appropriations in percentage of EU GNI is compared to the reference own resource ceiling (1.23 % of EU GNI).
The corresponding margin for unforeseen expenditure performs a dual role. First, it leaves a safety margin to ensure that (within the limit of the own resources ceiling) the resources available to the EU would not be reduced as a consequence of a lower-than-forecast economic growth rate. Second, it allows the various ceilings of the financial framework to be revised so as to cover any unforeseen expenditure which arises.
Technical adjustment
F I N A N C I A L R E P O R T
16
Revision and adjustment
Following the agreement on financing required for the European Global Navigation Satellite System GNSS programmes (EGNOS–Galileo), the financial framework for 2007–13 was revised in December 2007 (1).
An adjustment also occurred together with the technical adjustment made for 2009 in order to take account of implementation (pursuant to point 48 of the IIA) (2).
Following the agreement on financing required for the European economic recovery plan, the financial framework for 2007–13 was revised in May (3) and in December (4) 2009. An adjustment of the financial framework (pursuant to point 17 of the IIA) occurred in the framework of the technical adjustment for 2011 in April 2010 (5).
The latest revision of the financial framework, which addressed additional financing needs of the ITER project, was adopted on 13 December 2011 (6).
The budgetary
procedure
The Lisbon Treaty states that the adoption of the EU budget takes place in four stages (Article 314 (7)):
Commission’s dra! budget
According to the budgetary procedure, all EU institutions and bodies draw up their esti-mates for the dra0 budget according to their internal procedures before 1 July. The Commission consolidates these estimates and establishes the annual ‘dra0 budget’, which is submitted to the European Parliament and the Council by 1 September. In practice, the Commission endeavours to present the dra0 budget before the end of April/beginning of May.
Council’s reading of the budget
The Council adopts its position on the dra0 budget including amendments, if any, and passes it to Parliament before 1 October. The Council also informs Parliament of the reasons which led it to adopt its position.
(1) Decision 2008/29/EC of the European Parliament and of the Council of 18 December 2007.
(2) Decision 2008/371/EC of the European Parliament and of the Council of 29 April 2008.
(3) Decision 2009/407/EC of the European Parliament and of the Council of 6 May 2009.
(4) Decision 2009/1005/EU of the European Parliament and of the Council of 17 December 2009.
(5) COM(2010) 160 of 16 April 2010.
(6) Decision 2012/5/EU of the European Parliament and of the Council of 13 December 2011.
Parliament’s reading
Parliament then has 42 days to either adopt the budget at its reading in October or hand its amendments back to the Council. The Council may accept the amendments within 10 days and adopt the dra0 budget.
Conciliation Committee
If the Council does not accept Parliament’s amendments, a Conciliation Committee is set up, composed of the members of the Council or their representatives and an equal number of members representing Parliament. The Conciliation Committee is assigned to come up with a joint text within 21 days.
Once a joint text is agreed upon by the Conciliation Committee in early November, Parliament and the Council have 14 days to approve or reject it. Parliament may adopt the budget even if the Council rejects the joint text.
If either Parliament or the Council rejects the joint dra0 whilst the other fails to decide, the budget is rejected and the Commission has to submit a new dra0 budget.
If, at the beginning of a financial year, the budget has not yet been definitively adopted, a sum equivalent to not more than 1/12 of the budget appropriations for the preceding financial year may be spent each month.
Treaty timetable
1 September (*)
1 October
13 November (42 days)
13 November to 4 December (21 days)
18 December (14 days)
Dra! budget (DB) Commission
Council’s position on the DB Council
European Parliament’s amendment on Council’s position Parliament
Joint dra! Parliament and Council
EP approves or takes no decision
Majority of votes cast
YES
within 14 days
NO
within 14 days Council accepts
Parliament’s amendments within 10 days
Budget adopted
Budget adopted
Conciliation EP adopts amendments
Majority of component members
Parliament and Council approve (or fail to decide)
Council rejects, Parliament has final word (**)
Council approves, Parliament rejects
Council and Parliament reject
Dra! budget rejected Commission submits
a new DB
F I N A N C I A L R E P O R T
18
The adoption of the EU budget 2011
The process of adoption of the EU budget 2011 was the first one under the new rules agreed upon in the Lisbon Treaty.
Commission’s dra! budget
The 2011 dra0 budget was presented on 27 April 2010. Out of a total of EUR 142 565 mil-lion in commitment appropriations, some EUR 64 407 milmil-lion was geared towards eco-nomic recovery actions (+ 3.4 % on 2010). The funds backing the flagship initiatives of the EU 2020 strategy (for growth) represented EUR 57 929 million (about 40 % of the budget). Helping to boost the economy in crisis and investing in Europe’s youth and infrastructures for tomorrow were the priorities of the 2011 dra0 budget adopted by the Commission. The Commission called for a 5.9 % increase for payment appropriations compared to the 2010 budget (totalling EUR 129 061.2 million). The Structural Funds and the Cohe-sion Fund were in a phase of active implementation on the ground, and so payment appropriations for active projects increased by 16.9 % (compared to commitments for new projects, which increased by 3.2 %), to reach over EUR 42 541 million. This increase in payments was expected to contribute in real terms to the necessary stimulus of national economies (1).
Council’s reading of the budget
On 12 August 2010, the Council called for a 2.9 % increase (compared to the 2010 budget). The Council set commitment appropriations at EUR 141 777 million, a cut of EUR 788 million compared to the dra0 budget. Payment appropriations were reduced by EUR 3 609 million to EUR 126 527 million, or 1.01 % of GNI (2).
Parliament’s reading
On 20 October 2010, Parliament called for a 6 % increase (compared to the 2010 budget). Total commitment appropriations were set at EUR 143 070 million, EUR 1 292 million higher than the Council’s position. The level of payments was set at EUR 130 559 million (1.04 % of GNI), EUR 4 032 million higher than the Council’s position (3).
Amending letters
During the course of the procedure, the Commission presented three letters of amend-ment to the dra0 budget (the so-called amending letters).
Amending Letter No 1/2011 proposed to create a new budget section (Section X) with the related budget appropriations for the European External Action Service (EEAS), as from 1 January 2011. The proposed administrative expenditure (through transfers from the Commission and the Council) for the EEAS in 2011 amounted to EUR 476 mil-lion, whereas the total number of establishment plan posts amounted to 1 643. Amending Letter No 2/2011 covered the proposal to reinforce the EU contribu-tion to Europol and the three new financial supervision authorities (European Banking Authority, European Insurance and Occupational Pensions Authority and
(1) http://ec.europa.eu/budget/library/biblio/documents/2011/2011_Dra0_budg_preparation_en.pdf
(2) http://www.consilium.europa.eu/uedocs/cms_data/docs/pressdata/en/ecofin/116151.pdf
Euro pean Securities and Markets Authority), for a combined overall amount of EUR 2 million in commitment and payment appropriations, as well as a modifi-cation to the establishment plans of these agencies. Finally, the amending let-ter proposed the creation of a new budget item for the guarantee provided by the European Union in accordance with the provisions of Article 122(2) of the Treaty on the Functioning of the European Union, as well as a corresponding revenue article, without budgetary implications.
Amending Letter No 3/2011 concerned the usual update of the budget requests for the agricultural sector as well as for the international fisheries agreements, in accord-ance with the Interinstitutional Agreement on budgetary discipline and sound financial management of 17 May 2006. In addition, this amending letter proposed to create a new budget item for energy efficiency and renewable initiatives, within the framework of the energy projects to aid economic recovery. An overall decrease for Heading 2, ‘Preservation and management of natural resources’, of EUR 347 million in commit-ments and EUR 346 million in paycommit-ments was proposed.
Conciliation Committee
In the case of the 2011 budget, the Conciliation Committee worked between 26 Oc-tober and 15 November 2010 but did not reach an agreement although compromise was very close. As a consequence, the Commission had to present a new dra0 budget to reflect the near-compromise reached in conciliation.
The new dra0 budget was adopted on 26 November 2010. The Commission services worked under high pressure to ensure that the new dra0 budget was presented in due time, as not having a budget would have hampered the good functioning of the EU. Any new initiative or body that did not have a budget in 2010 would not have been funded by the budget, the European Union Solidarity Fund and European Globalisa-tion Adjustment Fund would have been frozen, and generally speaking equal monthly budgets would have prevented planning over several months.
The new dra0 EU budget for 2011 set the payment appropriations at the level request-ed by the Council in August, i.e. EUR 126 527.1 million, corresponding to 1.01 % of GNI. Parliament expressed its understanding of the Council’s position given the budgetary constraints that the Member States faced. The Commission, however, repeated its firm belief that the level of payments could only be agreed to if it was accompanied by the commitment of the budgetary authority to act promptly on requests for additional payment appropriations through amending budgets or transfers, in order to avoid any shortfall in payment appropriations (1).
The Council accepted the new dra0 budget presented by the Commission on 10 De-cember 2010 and Parliament adopted the 2011 EU budget at its plenary session in Strasbourg on 15 December 2010.
In December 2011, the Commission received EUR 15.7 billion worth of payment claims from Member States concerning the operational programmes financed by the Euro-pean Social Fund, EuroEuro-pean Regional Development Fund and the Cohesion Fund for the period 2007–13. Only EUR 5 billion could still be paid in 2011, leaving an extra EUR 10.7 billion to be paid in 2012. The requests covered projects that started in Mem-ber States in between 2007 and 2010, which were reaching completion.
F I N A N C I A L R E P O R T
20
Budget management
The general principles governing the EU budget
1. Unity and budget accuracy
All revenue and expenditure should be incorporated in a single budget document. Only the revenue and expenditure included in the budget are authorised. The principle of accuracy means that the EU will not spend more than is necessary.
2. Annuality
The principle of annuality requires budget operations to relate to a specific financial year (from 1 January to 31 December). This makes it easier to monitor the activities of the Union executive.
3. Equilibrium
The principle of equilibrium means that budget revenue must equal budget expend iture. The EU, unlike its Member States, is not allowed to borrow to cover its expend iture.
4. Unit of account
The budget is drawn up and implemented in euros and the accounts shall be presented in euros.
5. Universality
In line with this principle, budget revenue may not be assigned to specific items of expenditure (non-assignment rule) and revenue and expenditure may not be set off against each other (gross budget rule). Consequently, revenue is pooled and used with-out distinction to finance all expenditure.
6. Specification
The principle of specification means that each appropriation must have a given pur-pose and be assigned to a specific objective in order to prevent any confusion between appropriations, at both the authorisation and implementation stages. The principle of specification also applies to revenue and requires the various sources of revenue paid into the budget to be clearly identified.
7. Sound financial management
8. The principle of transparency
The budget is established in compliance with the principle of transparency, ensuring sound information on implementation of the budget and the accounts.
The EU budget lifecycle
The lifecycle of the EU budget, from the approval of the annual budget onwards, means that the figures for the commitment appropriations and payment appropriations avail-able for a given financial year tend to vary over the course of the year.
Procedures similar to the budgetary one apply to the adoption of amending budgets (in the case of inevitable, exceptional or unforeseen circumstances occurring a0er the budget has been adopted).
The factors that influence and change the amounts over the financial year are de-scribed below.
Carryovers
Carryovers represent amounts from the previous year’s budget that have not been used and are carried over to the current financial year.
The carryover decisions of the Commission, taken on 11 February 2011, concerned non-differentiated appropriations, commitment appropriations and payment appro-priations carried forward and Structural Funds’ commitments made available again.
Amending budgets
Amending budgets are a measure which takes into account political, economic or ad-ministrative needs which could not have been foreseen during the procedure that led to the adopted budget. They ensure more precise and economical financing of the EU budget by the Member States.
In 2011, a total of seven amending budgets were adopted.
Amending Budget (AB) No 1/2011 included the mobilisation of the EU Solidarity Fund for an amount of EUR 182.4 million in commitment and payment appropriations relat-ing to the effects of heavy rainfalls in Poland, Slovakia, the Czech Republic, Hungary, Croatia and Romania in 2010. It also covered the corresponding negative reserve in payment appropriations of EUR 182.4 million in Chapter 40 03 (Negative Reserve) (1). Adopted by the Commission on 14 January 2011 (COM(2011) 9), it was amended by the Council on 15 March and approved by Parliament on 6 April.
AB No 2/2011 aimed at budgeting the surplus resulting from the implementation of the budget year 2010. Adopted by the Commission on 15 April 2011 (COM(2011) 154), it was approved by the Council on 16 June and adopted by Parliament on 5 July. AB No 3/2011 covered the mobilisation of the EU Solidarity Fund for an amount of EUR 19.5 million in commitment and payment appropriations relating to the effects
(1) The Commission section of the budget may include a ‘negative reserve’ limited to a maximum amount of EUR 200
F I N A N C I A L R E P O R T
22
of heavy rainfalls in Slovenia, Croatia and the Czech Republic in 2010. This meant a corresponding reduction in payment appropriations of EUR 19.5 million from energy projects under the European Economic Recovery Plan (EERP). AB No 3 also included the replenishing of the negative reserve created as part of the financing of the mobilisa-tion of the EU Solidarity Fund related to AB No 1/2011 through redeployment from energy networks (EERP). This AB covered additional payment appropriations needed for the European Globalisation Adjustment Fund (EGF) for an amount of EUR 50 million. Adopted by the Commission on 25 March 2011 (COM(2011) 219), it was amended by Parliament on 5 July and approved by the Council on 14 July.
AB No 4/2011 covered a revision in the forecast of traditional own resources (TOR, i.e. customs duties and sugar sector levies), VAT and GNI bases for the calculation of Member States’ contributions to the EU budget, the budgeting of the relevant UK corrections as well as their financing, and revision of financing of GNI reductions in favour of the Netherlands and Sweden in 2011, resulting in a change in the distribu-tion between Member States of their own resources contribudistribu-tions to the EU budget. AB No 4 also included a reinforcement of resources (amounting to EUR 41.1 million in commitment appropriations and EUR 43.9 million in payment appropriations) to manage migration and refugee flows, further to the developments in the southern Mediterranean at that time, as well as a corresponding reduction in payment ap-propriations for energy projects under the European Economic Recovery Plan (EERP). The combined net financial impact of this amending budget was EUR 41.1 million in commitment appropriations and zero in payment appropriations. Adopted by the Commission on 17 June 2011 (COM(2011) 375), it was approved by the Council on 12 September and approved by Parliament on 28 September.
AB No 5/2011 covered a modification to the establishment plan of the European Ex-ternal Action Service (EEAS), without additional budgetary request. Adopted by the Commission on 22 June 2011 (COM(2011) 374), it was amended by Parliament on 25 October 2011 and approved by the Council on 28 October.
AB No 6/2011 covered:
2 the regular update in the forecast of revenue a0er the revision of the forecasts of own resources and other revenue;
2 commitment appropriations of EUR 23.14 million entered in reserve for the pro-gramme to support the further development of an integrated maritime policy (IMP); 2 the reallocation of EUR 113.4 million in commitment appropriations within Head-ing 4, ‘The EU as a global player’, in favour of European neighbourhood and partner-ship financial assistance to the occupied Palestinian territories, the peace process and UNRWA (United Nations Relief and Works Agency for Palestine Refugees in the Near East) for an amount of EUR 100 million, and banana accompanying measures for an amount of EUR 13.4 million; these amounts were proposed as a front-loading of appropriations to cover expenditure in the year 2012;
2 a reinforcement of European Social Fund operational technical assistance by EUR 3.25 million to provide specific expertise in support of the administrative reform operational programme in the field of tax administration in Greece; payment appro-priations of EUR 300 000 were also requested;
2 an increase of payment appropriations of EUR 200 million to meet outstanding needs which remained a0er the ‘Global transfer’;
To summarise, the net effect of AB No 6 represented the increase of EUR 200 million in total payment appropriations. Adopted by the Commission on 18 October 2011 (COM(2011) 674), it was amended by the Council on 30 November 2011 and ap-proved by Parliament on 1 December 2011.
AB No 7/2011 covered the mobilisation of the EU Solidarity Fund for an amount of EUR 38 million in commitment and payment appropriations relating to the earthquake in Murcia, Spain (EUR 21.1 million) and flooding in Veneto, Italy (EUR 16.9 million). Adopted by the Commission on 21 November 2011 (COM(2011) 796), it was approved by the Council on 30 November and adopted by Parliament on 15 December.
Summary table of amending budgets for the financial year 2011
(
1)
AB No Date of adoption OJ reference Impact on PA Main subject
1 6.4.2011 Official Journal L 172
30.6.2011 Heading 3b: + 179 Heading 4: + 4
Reserve: – 182
Mobilisation of the EU Solidarity Fund for Poland, Slovakia, Czech Republic, Hungary, Croatia and Romania
2 5.7.2011 Official Journal L 213
19.8.2011 Heading 3b: + 179 2010 Surplus
3 17.7.2011 Official Journal L 251
27.9.2011 Heading 1a: – 202Heading 3b: + 18
Heading 4: + 1 Reserve: + 182
Mobilisation of the EU Solidarity Fund for Slovenia, Croatia and the Czech Republic in 2010
4 28.9.2011 Official Journal L 312
25.11.2011 Heading 1a: – 44Heading 3a: + 44 Revision of Own resources and Migration and Refugee Flows
5 28.10.2011 Official Journal L 342
22.12.2011 The AB No 5/2011 covers a modification to the establishment plan of the European External Action Service (EEAS), without additional budgetary request.
6 1.12.2011 Official Journal L 20
24.1.2012 Heading 1a: + 142Heading 1b: + 453
Heading 2: – 395
Revision of Own Resources, Integrated Maritime Policy, European Social Fund, Palestine, Payment Appropriations
7 15.12.2011 Official Journal L 62
2.3.2012 Heading 2: – 38Heading 3b: + 38 Mobilisation of the Solidarity Fund Spain and Italy
(1) http://ec.europa.eu/budget/biblio/documents/2011/2011_en.cfm#amending_budget
Transfers
There are two types of transfers: (1) transfers from reserves which increase the amounts of the authorised appropriations to be used; and (2) transfers between the lines of a chapter of the budget or between budget headings, which are neutral in overall budgetary terms.
F I N A N C I A L R E P O R T
24
Budget outturn
From an accounting point of view, the budget outturn is — in general terms — the difference between all revenue and expenditure, the positive difference being a surplus. Of the final budget for 2011 totalling EUR 128 308 million,EUR 126 497 million — or 99 % — has been used.
Active budget management 2000–11 (million EUR)
0 20 000 40 000 60 000 80 000 100 000 120 000 140 000
83 150
11 613
Final budget Implemented budget Surplus
89 515
79 593
15 003
93 853
84 641
7 413
95 750
90 032
5 470
92 610
99 403
2 737
101 807 103 908
2 410
105 864 105 655
1 848
108 733 112 377
1 529
114 947 113 070
1 796
116 964
112 107
2 253
115 541 120 490
4 562 1 492 124 732 128 308 126 497
2000 2001 2002 2003 2004 2005 2006 2007 2008 2009 2010 2011
The surplus comes from three sources: income, expenditure and exchange rate differ-ences.
In 2011, EUR 0.7 billion more revenue flowed into the budget than originally forecast. Out of the total amount budgeted for expenditure, a further EUR 0.7 billion was not spent. The normal fluctuations in exchange rates between the euro and other
cur-Evolution of appropriations by heading in 2011 (million EUR)
Heading Initial voted budget
(without reserve) Carryover from 2010 Amending budgets Total impact of transfers Unused reserve Final budget
1a Competitiveness 11 628 270 – 104 80 11 874
1b Cohesion 41 652 11 453 285 42 401
2 Natural resources 56 327 419 – 433 – 100 56 212
3a Freedom, Security
and Justice 800 26 44 – 9 1 862
3b Citizenship 646 72 235 – 3 950
4 EU as a global player 7 144 38 34 – 125 7 092
5 Administration 8 169 745 0 1 1 8 917
rencies led to a surplus of EUR 0.1 billion. These three elements led to a surplus of EUR 1.5 billion which was the lowest in recent years. The EUR 1.5 billion could not be used to pay off part of the bills received from Member States at the end of 2011 because of the principles of specification and annuality as explained above.
At the end of December 2011, the outstanding requests for payments from the Mem-ber States for structural actions amounted to EUR 10.7 billion, about EUR 5 billion of which could have been paid had there been sufficient payment appropriations on the relevant budget lines. However, the surplus of EUR 1.5 billion could not be used to address these requests for a number of reasons:
1. Those parts of the surplus related to income and the exchange rate fluctuations were not available to the Commission for spending. Only amounts entered in the budget for expenditure can be paid out (principle of specification).
2. Not all of the unused expenditure of EUR 0.7 billion concerned the Commission. Almost EUR 0.18 billion concerned amounts unspent by the other European institu-tions, and was not available to the Commission (principle of specification).
3. A further EUR 0.17 billion concerned amounts from the 2010 budget which had been carried over to 2011, but which according to the financial rules cannot be used for any purpose other than that originally agreed with the European Parliament and the Council (principle of specification).
4. This leaves EUR 0.38 billion (taking into account the carryover in February 2012), which might have been transferred to the structural actions if time had allowed. However, this would have meant getting the agreement of Parliament and Council to transfer the amounts before 31 December, when the end of the year was ap-proaching, and the calendar of meetings was extremely limited.
5. The EUR 375 million of payment appropriations unspent represent less than 0.3 % of the total 128.3 billion authorised in the 2011 budget. That clearly shows that, despite the justified rigour ensured by the financial regulation, the Commission was able to implement virtually the totality of the payment appropriations authorised in the 2011 budget.
Annual accounts
F I N A N C I A L R E P O R T
26
Outstanding commitments (RAL)
The RAL is the sum of outstanding commitments, i.e. commitments agreed to but that have not yet translated into payments. A commitment is only a pledge to make a money transfer in the future. Once approved, but before it is paid, it remains outstand-ing (not yet paid for).
Commitments reflect policies agreed at EU level, with corresponding amounts foreseen in the legal acts of the respective spending programmes (e.g. seventh research frame-work programme, ‘Lifelong learning’, the European regional and social funds, rural de-velopment, the European Return Fund, the Instrument for Pre-Accession Assistance). The money that the Commission and its budget management ‘partners’ (especially the Member States which are responsible for the execution of around three quarters of the EU budget) actually pay depends on whether all conditions for granting it have been fulfilled. If, for instance, the conditions for eligibility of expenditure are not met or the deadline for sending reimbursement demands expires, actual payments will be less than 100 % of the commitments from which they originated.
The Commission and all other ‘actors’ involved are doing their best to make use of the amounts committed. This is a sign of good administration of resources and ensures that the European funds have reached the intended beneficiaries. Also, the existence of commitments which have not been followed can confirm that there are no blank cheques given and that money is spent only when due and when the rules are com-plied with.
By the end of 2011, the outstanding commitments amounted to EUR 207 billion. They could have been EUR 5 billion lower had there been sufficient payments in the budget 2011.
Treasury management
The Commission has accounts with Member State treasuries, central banks and com-mercial banks. The source of Community finance is almost entirely own resources. These are credited twice a month to the accounts opened with Member State treasur-ies or central banks. The funds are used to fund payments through commercial bank accounts on the ‘just in time’ principle.
The Commission’s Directorate-General for the Budget establishes the cash flow fore-casting, which is done for the very short term, for the month to come and for the budgetary year. Member States make their contributions to the budget in their national currencies, while most of the Commission’s payments are denominated in euro. The Commission has therefore to make foreign exchange transactions in order to have the euros necessary to make payments in those Member States that have not yet adopted the euro and to make payments in non-European Union currencies.
Section II
Revenue
The budget of the European Union is financed by own resources, other revenue and the surplus carried over from the previous year. When Parliament and the Council approve the annual budget, total revenue must equal total expenditure. The total amount needed to finance the budget follows automatically from the level of total expenditure. However, since outturns of revenue and expenditure usually differ from the budgeted estimates, there is a balance of the exercise resulting from the implementation. Normally, there has been a surplus, which reduces Member States’ own resources payments in the subsequent year.
Own resources
The basic rules on the system of own resources are laid down in a Council decision adopted by unanimity in the Council and ratified by all Member States. The previous Council Decision 2000/597 (ORD 2000) was replaced by Council Decision 2007/436 (ORD 2007). ORD 2007 entered into force on 1 March 2009 with retroactive effect back to 1 January 2007 (own resources payments for 2009 were thus made pursuant to ORD 2007 with retroactive effect for 2007 and 2008 (1). Own resources can be defined as revenue accruing automatically to the EU in order to finance its budget with-out the need for any subsequent decision by national authorities. The overall amount of own resources needed to finance the budget is determined by total expenditure less other revenue.
The total amount of own resources cannot exceed 1.23 % of the EU GNI. Own resources can be divided into the following categories:
2 traditional own resources (TOR); 2 the VAT own resource; and
2 the GNI own resource (‘the additional fourth resource’), which plays the role of re-sidual resource.
Finally, a specific mechanism for correcting budgetary imbalances in favour of the United Kingdom (UK correction) is also part of the own resources system.
Furthermore, some Member States may choose not to participate in certain justice and home affairs (JHA) policies. Corresponding adjustments are introduced to own re-sources payments (since 2003 for Denmark and since 2006 for Ireland and the United Kingdom).
Traditional own resources (i.e. customs duties and
sugar levies)
TOR are levied on economic operators and collected by Member States on behalf of the EU. TOR payments accrue directly to the EU budget, a0er deduction of a 25 % amount retained by Member States as collection costs.
Following the implementation into EU law of the Uruguay Round agreements on multi-lateral trade there is no longer any material difference between agricultural duties and customs duties under ORD 2007. Customs duties are levied on imports of agricultural and non-agricultural products from third countries, at rates based on the Common Customs Tariff.
In 2011, this resource corresponded to 13 % (EUR 16 646 million) of total revenue. A production charge is paid by sugar producers.
Revenue from this resource amounted to 0.1 % (EUR 131.7 million) of total revenue in 2011.
F I N A N C I A L R E P O R T
30
VAT own resource
The VAT own resource is levied on Member States’ VAT bases, which are harmonised for this purpose in accordance with Union rules. The same percentage is levied on the harmonised base of each Member State. However, the VAT base to take into account is capped at 50 % of each Member State’s GNI. This rule is intended to avoid the less prosperous Member States paying out of proportion to their contributive capacity, since consumption and hence VAT tend to account for a higher percentage of a coun-try’s national income at relatively lower levels of prosperity.
In 2011, the 50 % ‘capping’ was applied to six Member States (Ireland, Cyprus, Luxem-bourg, Malta, Portugal and Slovenia).
According to ORD 2007, the uniform rate of call of the VAT own resource is fixed at 0.30 % from 1 January 2007. However, for the period 2007–13 only, the rate of call of the VAT own resource has been fixed at 0.225 % for Austria, at 0.15 % for Germany and at 0.10 % for the Netherlands and Sweden.
In 2011, the total amount of the VAT own resource (including balances for previous years) levied reached EUR 14 798.9 million, or 11 % of total revenue.
The GNI own resource
The GNI own resource was introduced in 1988 to balance budget revenue and expendi-ture, i.e. to finance the part of the budget not covered by other revenue. The same per-centage is levied on each Member States’ GNI, established in accordance with Union rules. The rate is fixed during the budgetary procedure. The amount of the GNI own resource needed depends on the difference between total expenditure and the sum of all other revenue.
In 2011, under ORD 2007, the rate of call of GNI amounted to 0.6897 % (rounded figure) and the total amount of the GNI resource (including balances for previous years) levied reached EUR 88 412.6 million, or 68 % of total revenue.
According to ORD 2007, the Netherlands and Sweden receive a gross reduction in their annual GNI own resource contributions for the period 2007–13 only. ORD 2007 speci-fies the amount of this reduction (EUR 605 million and EUR 150 million in constant 2004 prices, which are adapted for current prices) and indicates that this reduction shall be granted a0er financing of the UK correction. This reduction is financed by all Member States.
The UK correction
The current UK correction mechanism was introduced in 1985 to correct the imbalance between the United Kingdom’s share in payments to the Community budget and its share in the Community expenditure. This mechanism has been modified on several occasions to compensate for changes in the system of EU budget financing, but the basic principles remain the same.
The cost of the correction is borne by the other 26 Member States. The distribution of the financing is first calculated on the basis of each country’s share in total EU GNI. The financing share of Germany, the Netherlands, Austria and Sweden is, however, re-stricted to one quarter of its normal value. This cost is redistributed across the remain-ing 22 Member States.
ORD 2007 introduced several changes to the calculation of the amount of the UK correction:
2 The fixation of the rate of call of the VAT own resource at 0.30 % and the reduced rates temporary granted to Germany, the Netherlands, Austria and Sweden (see above) increase the amount of the UK correction.
2 ORD 2007 suppresses the adjustment related to pre-accession expenditure from the 2013 UK correction (to be first budgeted in 2014) onwards.
2 An adjustment related to expenditure in the new Member States is introduced. From the 2008 UK correction (first budgeted in 2009) onwards, total allocated expendi-ture will be reduced by allocated expendiexpendi-ture in Member States which joined the EU a0er 30 April 2004, except for agricultural direct payments and market-related expenditure as well as that part of rural development expenditure originating from the EAGGF, Guarantee Section. This reduction was phased in progressively according to the following schedule: 20 % for the 2008 UK correction; 70 % for the 2009 UK correction; and 100 % onwards. The additional contribution of the UK resulting from the above reduction may not exceed a ceiling of EUR 10.5 billion, in 2004 prices, during the period 2007–13. In the event of further enlargement between 2009 and 2013, this ceiling will be adjusted upwards accordingly.
The total amount of the UK correction paid in 2011, pursuant to ORD 2007, amounted to EUR 3 595.9 million.
Other revenue and the surplus from previous year
Revenue other than own resources includes: tax and other deductions from EU staff remunerations; bank interest; contributions from non-member countries to certain EU programmes (e.g. in the research area); repayments of unused EU financial assistance; and interest on late payments, as well as the balance from the previous exercise. This balance is mainly derived from the difference between the outturn of own resources payments and expenditure in the previous year.
F I N A N C I A L R E P O R T
32
EU revenue 2011
Traditional own resources (TOR), net (75 %); 12.9 %
Surplus from previous year; 3.5 %
GNI own resource; 68.0 %
Other revenue; 4.2 % VAT own resource; 11.4 %
National contribution by Member State and traditional own resources collected on
behalf of the EU in 2011 (million EUR)
GNI
(bn EUR) VAT own resource GNI own resource UK correction GNI OR granted to Reduction in NL and SE
Total national
contribution Traditional own resources (TOR) net (75 %)
Total own resources
(1) (2) (*) (3) (**) (4) (**) (5) = (1) + (2)
+ (3) + (4) % % GNI (6) (5) + (6)(7) = % % GNI 375.5 BE 516.5 2 627.3 177.5 24.2 3 345.5 3.2 0.89 1 581.0 4 926.5 4.1 1.31 37.5 BG 51.2 274.1 18.4 2.4 346.1 0.3 0.92 49.1 395.2 0.3 1.05 144.4 CZ 207.7 1 170.4 74.6 9.3 1 462.0 1.4 1.01 220.6 1 682.5 1.4 1.17 247.5 DK 291.3 1 701.2 112.1 16.1 2 120.8 2.1 0.86 327.6 2 448.3 2.0 0.99 2 612.4 DE 1 671.5 17 610.4 218.3 170.9 19 671.1 19.1 0.75 3 456.0 23 127.1 19.3 0.89 15.2 EE 22.9 106.9 6.0 1.0 136.7 0.1 0.90 21.9 158.6 0.1 1.05 125.3 IE 193.5 884.4 52.7 8.3 1 139.0 1.1 0.91 199.8 1 338.7 1.1 1.07 208.2 EL 278.6 1 376.1 93.1 14.2 1 762.0 1.7 0.85 141.0 1 903.0 1.6 0.91 1 048.1 ES 1 964.4 7 355.1 487.7 69.0 9 876.1 9.6 0.94 1 170.2 11 046.3 9.2 1.05 2 034.0 FR 2 916.6 14 035.3 965.9 133.0 18 050.8 17.5 0.89 1 566.3 19 617.2 16.3 0.96 1 569.7 IT 1 811.8 11 703.4 717.9 103.1 14 336.2 13.9 0.91 1 741.7 16 078.0 13.4 1.02 17.2 CY 27.0 123.5 8.5 1.2 160.1 0.2 0.93 24.6 184.8 0.2 1.08 20.2 LV 15.9 133.6 9.0 1.2 159.8 0.2 0.79 22.6 182.3 0.2 0.90 29.6 LT 27.9 213.7 14.0 1.9 257.4 0.2 0.87 44.6 302.0 0.3 1.02 30.6 LU 46.7 215.1 15.0 2.1 278.8 0.3 0.91 14.3 293.1 0.2 0.96 94.6 HU 116.6 666.4 47.0 6.4 836.4 0.8 0.88 101.0 937.4 0.8 0.99
5.8 MT 9.5 43.5 2.9 0.4 56.3 0.1 0.97 10.1 66.5 0.1 1.14
608.1 NL 290.3 4 217.2 50.7 – 625.0 3 933.3 3.8 0.65 1 935.7 5 868.9 4.9 0.97 300.2 AT 306.1 2 150.0 24.0 19.1 2 499.2 2.4 0.83 189.5 2 688.7 2.2 0.90 353.9 PL 527.0 2 494.5 182.7 23.5 3 227.8 3.1 0.91 352.6 3 580.4 3.0 1.01 164.9 PT 299.3 1 207.8 81.6 10.8 1 599.4 1.5 0.97 135.0 1 734.4 1.4 1.05 134.7 RO 138.8 902.2 66.9 8.2 1 116.0 1.1 0.83 109.9 1 225.9 1.0 0.91 35.0 SI 54.7 251.9 17.9 2.4 326.9 0.3 0.93 74.2 401.1 0.3 1.14 67.8 SK 60.0 474.9 36.9 4.5 576.3 0.6 0.85 117.4 693.7 0.6 1.02 193.7 FI 266.9 1 436.1 87.1 12.6 1 802.8 1.7 0.93 152.4 1 955.2 1.6 1.01 396.1 SE 173.1 2 798.9 33.0 – 138.3 2 866.6 2.8 0.72 466.9 3 333.6 2.8 0.84 1 758.9 UK 2 513.1 12 240.0 – 3 595.9 116.2 11 273.4 10.9 0.64 2 551.8 13 825.2 11.5 0.79 12 629.1 EU-27 14 798.9 88 414.0 5.4 – 1.4 103 216.9 100 0.82 16 777.7 119 994.7 100 0.95
Surplus from previous year 4 539.4 Surplus external aid guarantee fund 0.0
Other revenue 5 465.9
Total revenue 130 000.0
(*) For simplicity of the presentation, the GNI-based own resource includes the JHA adjustment.
EU revenue 2000–11 (million EUR)
120 000 130 000
110 000
100 000
90 000
80 000
70 000
60 000
50 000
40 000
30 000
20 000
10 000
0
2000 2001 2002 2003 2004 2005 2006 2007 2008 2009 2010 2011
Surplus from previous year Other revenue GNI own resource VAT own resource
Traditional own resources (TOR), net (75 %)
National contribution per Member State and TOR collected on
behalf of the EU in 2011 (million EUR)
20 000 25 000
15 000
10 000
5 000
0
BE BG CZ DK DE EE IE EL ES FR IT CY LV LT LU HU MT NL AT PL PT RO SI SK FI SE UK
UK correction GNI own resource VAT own resource
Traditional own resources (TOR), net (75 %)
UK correction (EUR 3 595.9 million)
F I N A N C I A L R E P O R T
34
Donations
Pursuant to Article 19 of the Financial Regulation, the Commission may accept any donation made to the EU, such as foundations, subsidies, gi0s and bequests.
Acceptance of donations of a value of EUR 50 000 or more which involve a financial charge, including follow-up costs, exceeding 10 % of the value of the donation made, are subject to the authorisation of the European Parliament and of the Council, both of which shall act on the matter within 2 months of the date of receipt of the request from the Commission. If no objection has been made within that period, the Commis-sion takes a final deciCommis-sion in respect of acceptance.
The Commission has to estimate and duly explain the financial charges, including follow-up costs, entailed by the acceptance of donations made to the Communities (Article 13a of the Implementing Rules).
Following a Commission decision, in written procedure, to accept a donation which implies charges for the institutions, the decision is forwarded to Parliament and the Council. The Commissioner responsible for the budget may finally decide to accept the donation in the absence of a negative opinion, or to renounce to a donation in case of a negative opinion of Parliament or the Council.
In the case of a Commission decision to refuse a donation, these institutions are in-formed.
The Director-General of the Commission’s Budget Department is responsible for the ex-ecution measures following the Commission decision. In the case of a donation of real estate and its subsequent sale, the publicity rules laid down in the Financial Regulation have to be respected.
Donations occur very rarely. The procedure described above also applies when an EU institution other than the Commission receives a donation.
Section III
Expenditure
Section III presents expenditure incurred through the EU budget in 2011. It provides a description of the expenditure for the main programmes under each heading of the 2007–13 financial framework, as well as data on the allocation of expenditure by each Member State.
F I N A N C I A L R E P O R T
EU budget 2011 — Implemented payments (million EUR)
EU as a global player; 6 921 (6 %)
Citizenship, freedom, security, justice; 1 728 (1 %)
Natural resources; 56 038 (44 %)
Sustainable growth; 53 892 (43 %)
Administration; 7 918 (6 %)
EUR 126 497 million
Allocation of EU
expenditure for 2011
by Member State
Allocating expenditure to Member States is merely an accounting exercise that gives a very limited view of the benefits that each Member State derives from the Union. The Commission continues to stress this point at every opportunity (1).
This accounting allocation, among other drawbacks, is non-exhaustive and gives no indication of many of the other benefits gained from EU policies such as those relating to the internal market and economic integration, not to mention political stability and security.
In 2011, EUR 117 336.9 million (i.e. 90.7 % of the total implemented EU expenditure including EFTA contributions and earmarked revenue) was allocated to Member States. See notes in tables annexed for further details on the methodology used for the alloca-tion of expenditure.
(1) A full statement on this policy and its rationale was made in Chapter 2 of the 1998 Commission report ‘Financing of
F I N A N C I A L R E P O R T
38
Financial data structure
Execution of voted appropriations can be looked at from different perspectives depending on the emphasis one will put on the final information passed:
Expenditure
Re
venue
year 2012
Surplus from the year 2010 = EUR 4 539 million
Assigned revenue implemented = EUR 2 898 million (including EFTA and carryovers)
(C)
Assigned revenue carried over to year 2012 = EUR 3 748 million
Assigned revenue lapsing = EUR 5 million Including other
institutions = EUR 331 million
Including other institutions = EUR 2 873 million Including other institutions = EUR 373 million
Including other institutions = EUR 240 million
Traditional own resources (TOR) = EUR 16 778 million
Sugar levies = EUR 176 million Customs duties = EUR 22 195 million Amounts retained as TOR collection costs = EUR 5 593 million
Value Added Tax (VAT) own resource = EUR 14 799 million
GNI own resource (residual resource) = EUR 88 414 million
Others (such as UK correction, payments from/to Member States, etc) = EUR 4 million Own resources collected = EUR 119 995 million
Other revenue = EUR 5 466 million
Assigned revenue collected = EUR 1 524 million
year 2011
PA carried over from year 2010 and implemented in 2011 = EUR 1 352 million (B)
Payment appropriations (PA)
implemented (annual financial flow) — 2011 = EUR 126 497 million
(A+B)
PA carried over to year 2012 = EUR 1 020 million
PA + carryovers lapsing = EUR 792 million
Implemented voted budget 2011 (A) = EUR 125 145 million
A B General data structure of the Financial Report 2011 = Year of occurrence approach without assigned revenue
Implemented voted budget and implemented carryovers from the previous financial year excluding implemented assigned revenue
+ =
EUR 126 497 million
A B C Year of occurrence approach
Implemented voted budget and implemented carryovers from the previous financial year + implemented assigned revenue
+ + =
In total, 94 % of the EU budget is funding policies and projects in Member States. The chart below provides an overview of how each country benefited from the budget and gives the relative importance compared with each Member State’s gross national income (GNI) for a better understanding of the figures.
Expenditure by Member State
million EUR
% of GNI
0.0 1.5 3.0 4.5 6.0 7.5
0 2 500 5 000 7 500 10 000 12 500 15 000
PL ES FR DE IT BE UK EL HU PT CZ RO NL AT SK SE LT IE LU DK FI BG LV SI EE CY MT
F I N A N C I A L R E P O R T
40
Allocation of 2011
EU expenditure by
heading and by
Member State
Methodological note: allocation of expenditure
In 2011, total executed EU expenditure amounted to EUR 126 715 million (ex-cluding EUR 2 679.9 million of expenditure made from earmarked revenue and including EUR 218.1 million of expenditure made of EFTA contributions) or EUR 129 394.9 million (1) when including earmarked revenue and those of EFTA, of which EUR 117 336.9 million (i.e. 90.7 %) was allocated to Member States and EUR 6 438.3 million to third countries and EUR 5 619.7 million was not allocated. The corresponding 2010 figures were EUR 122 230.7 million, EUR 111 337.5 million (i.e. 91.1 %), EUR 6 522 million and EUR 4 371.2 million.
In 2011, EU expenditure allocated to third countries (i.e. EUR 6 438.3 million) con-cerned mainly part of: ‘The EU as a global player’ (EUR 5 174.9 million), research (EUR 573.3 million), TEN (EUR 295 million), fisheries (EUR 157.8 million) and other (EUR 237.4 million).
The 2011 EU expenditure which was not allocated (i.e. EUR 5 619.7 million) falls into the following categories:
2 expenditure financed from earmarked revenue: EUR 2 679.9 million; 2 part of expenditure under ‘The EU as a global player’ (EUR 1 557.4 million);
2 expenditure which, by its nature, cannot be attributed to specific Member States: EUR 1 382.4 million. This concerns part of administration (EUR 363.7 million), re-search (EUR 760.9 million), competitiveness and innovation (EUR 107.5 million) and other (EUR 150.3 million).
Methodology
Year of reference:
Executed and allocated expenditure are actual payments made during a financial year, pursuant to that year’s appropriations or to carryovers of non-utilised appro-priations from the previous year.
(1) Payments made from EUR 134 959.7 million of payments appropriations (i.e. from the sum of: EUR 126 727.1 million