Auxin biosynthesis in pea:
A characterisation of mutants
by
Ariane Gélinas-Marion
B.Sc. (Hons) School of Natural Sciences
Submitted in fulfilment of the requirements for the degree of Doctor of Philosophy University of Tasmania
This thesis contains no material which has been accepted for a degree or diploma by the University or any other institution, except by way of background information and duly acknowledged in the thesis, and to the best of my knowledge and belief no material previously published or written by another person except where due acknowledgement is made in the text of the thesis, nor does the thesis contain any material that infringes copyright.
Authority of access
This thesis may be made available for loan and limited copying in accordance with the Copyright Act 1968.
Statement of published works
The publishers of the paper comprising results included in Chapter 4 hold the copyright for that content and access to the material should be sought from the respective journals. The remaining non-published content of the thesis may be made available for loan and limited copying and communication in accordance with the
Copyright Act 1968.
Ariane Gélinas-Marion School of Natural Sciences
McAdam, S.A.M., Eléouët, M.P., Best, M., Brodribb, T.J., Carins Murphy, M., Cook, S.D., Dalmais, M. Dimitriou, T., Gélinas-Marion, A., Gill, W.M., Hegarty, M., Hofer, J.M.I., Maconochie, M., McAdam, E.L., McGuiness, P., Nichols, D.S., Ross, J.J., Sussmilch, F.C., Urquhart, S. (2017) Linking auxin with photosynthetic rate via leaf venation. Plant Physiology 175, 351-360. DOI:10.1104/pp.17.00535
Results from this publication are located in Chapter 4
Author contributions: S.A.M.M. developed the research plans for and supervised measurements of anatomy, gas exchange and hydraulics and wrote the manuscript with contributions from J.M.I.H. and M.P.E. who designed the research plans for molecular and phenotypic characterisation of mutant alleles; A.G-M. performed auxin quantifications and auxin activity analyses, writing relevant sections and collected anatomical data; S.D.C. prepared phylogenetic analyses, writing relevant sections; F.C.S. molecularly characterised a mutant allele and wrote relevant sections; E.L.M. acquired lines for auxin activity analyses; M.B., T.D., M.M., S.U. and M.C.M. collected anatomical and physiological data; P.M. designed specialised software for anatomical analyses; M.D. developed a mutant allele; D.S.N. assisted in the quantification of auxin; W.M.G. undertook resin imbedding; M.H. supervised and assisted in the characterisation of a mutant allele; T.J.B. assisted in experimental design; and J.J.R first observed the pss allele and complemented the writing.
McAdam, E.L., Meitzel, T., Quittenden, L.J., Davidson, S.E., Dalmais, M., Bendahmane, A.I., Thompson, R., Smith, J.J., Nichols, D.S., Urquhart, S., Gélinas-Marion, A, Aubert, G. and Ross, J.J. (2017). Evidence that auxin is required for normal seed size and starch synthesis in pea. New Phytologist 216 193-204. DOI: 10.1111/nph.14690
Author contributions: E.L.M. and L.J.Q. measured hormone and carbohydrate concentrations and examined starch granules; T.M. performed transgenic work, measured starch
I wish to thank all those who have provided support with their time, interest and knowledge over the last 4 years. You are many…
First and foremost, I would like to deeply thank my supervisors Adjunct Professor John Ross and Dr. Eloise Foo for supporting me during my studies. Your focus, enthusiasm, generosity and animated conversations have been much appreciated.
I also want to thank all the lovely people from Administration, the Glasshouse, the Molecular lab, the Hormone lab, the CSL (Dr. David Nichols), the Flowering group (principally Dr. Valérie Hecht) the LEAF lab and the Department in general (from honours students to head of school) for your unwavering assistance and esprit de corps!
Importantly, I deeply thank my family and friends for their unconditional and constant support. I am grateful to have you all in my life.
Finally, I want to thank my husband Stephen for being so helpful. Also, my
The optimisation of auxin concentrations, or auxin homeostasis, is modulated through several mechanisms including de novo biosynthesis, transport and
inactivation, mainly conjugation and catabolism. These mechanisms are thought to work in concert to spatiotemporally regulate auxin content at a cellular and tissue level. The principal focus of this thesis will be on auxin biosynthesis and
inactivation.
At present, the indole-3-pyruvic acid (IPyA) pathway is the only fully characterised route for auxin biosynthesis. In the first step, the amino acid tryptophan (Trp) is converted to IPyA by members of the TRYPTOPHAN AMINOTRANSFERASE (TAA1/TAR) family. In the second step, IPyA is converted to indole-3-acetic acid (IAA) by the YUC family of flavin-containing monooxygenases (FMO).
Members of the two gene families are widely distributed across plant species and the IPyA pathway is now considered to be the principal biosynthetic source of IAA, the main bioactive auxin in plants. However, the evidence in support for this route is primarily based on findings from Arabidopsis. Interestingly, previous data from
Pisum sativum (garden pea) suggest that other auxin biosynthetic pathways may also
be active in root tissue. These results expose the necessity of investigating the auxin biosynthesis pathway in a broader range of species.
Loss-of-function mutants are invaluable tools to establish links between gene
function, hormone content and morphological outputs. However, auxin-biosynthesis mutants are relatively rare in species other than Arabidopsis. Novel recessive mutants relating to the IPyA pathway, only recently available in pea, are the basis of this thesis. These comprise two alleles with disruptions in PsTAR1 (Pstar1-1 and Pstar1-2) and four alleles affecting PsYUC1 (the crispoid mutants crd-1 to crd-4).
morphology by characterising the phenotypes of the auxin mutants.
In the first experimental chapter, the two Pstar1 mutant lines are isolated. No phenotypes were observed in the novel mutants and despite PsTAR1 being
previously reported to be highly expressed in young pea seeds, the mutant analyses suggested that PsTAR1 is not required for auxin biosynthesis during early seed development. Complications experienced in the process of identifying the
homozygous recessive mutants, lead to the hypothesis that a second gene, a duplicate
of PsTAR1, nearly identical in sequence, is present in the pea genome, further
suggesting the possibility of a fifth PsTAR member.
In Chapter 3, the PsYUC1 enzyme structure is characterised using in silico techniques. Important domains and the potential binding residues of PsYUC1 are predicted. A comparative approach using the previously reported leaflet phenotypes of the crd alleles and the 3-dimentional structure of PsYUC1, a novel C-terminal motif is uncovered and proposed to be critical for the functioning of the pea enzyme.
In Chapter 4, a survey of the crd phenotypes is conducted to investigate the influence of the PsYUC1 gene on pea development in general. Severe phenotypes are
exhibited in the mutants demonstrating the importance of PsYUC1 for lateral organ formation and suggests a role in meristematic and/or primordial cell developmental modules. Supporting this, an auxin-reporter construct revealed that auxin activity is adversely affected in the mutants. However, IAA content while only mildly reduced in the apical bud, was not affected in several tissues despite the strong phenotypes. Interestingly, the reduction in IAA aspartate conjugate (IAAsp) content in all tissues tested, suggests that the rate of conjugation is a likely mechanism for auxin
homeostasis.
precursor, IPyA, is demonstrated to break down non-enzymatically and to contribute substantially to the IAA pool post-extraction. Variations on well-established
Declaration of originality ... ii
Authority of access ... ii
Statement of published works ... ii
List of published works ... iii
Acknowledgements ...iv
Abstract ... v
Table of content ... viii
Chapter 1 - A summary of auxin biology ... 1
1.1. General introduction ...1
1.1.1. IAA biosynthesis ... 2
1.1.2. Sites of production and IAA transport ... 3
1.1.3. Auxin perception and signalling ... 5
1.1.4. Auxin metabolism ... 6
1.1.5. Pisum sativum as a model species... 8
1.1.6. Thesis overview ... 8
Chapter 2 - The auxin biosynthesis gene PsTAR1 ... 12
2.1. Introduction ... 12
2.1.1. The tryptophan aminotransferases ... 12
2.1.2. Specific roles for the TARs in seed development ... 14
2.1.3. TARs in pea seeds ... 14
2.1.4. The Pstar1 mutant alleles ... 16
2.1.5. Aims ... 18
2.2. Materials and Methods ... 19
2.2.1. Plant materials ... 19
2.2.2. Genomic DNA extraction ... 19
2.2.3. Sequencing primer design ... 20
2.2.4. Phylogenetic analysis ... 21
2.2.5. Genotyping ... 21
2.2.6. Inferred protein structure and binding sites ... 22
2.2.7. Reciprocal crosses ... 23
2.2.8. Caméor and Torsdag SNP segregation ... 23
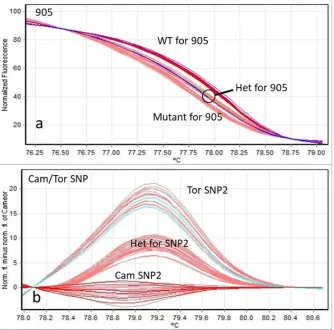
2.2.9. High resolution melt analysis ... 24
2.2.10. Transformation ... 24
2.2.11. Phenotypic characterisation ... 25
2.3.3. Pstar1-1 and Pstar1-2 homozygous recessives are not detected ... 31
2.3.4. Abortion rates are not affected in the mutant lines ... 36
2.3.5. Pstar1-1 and Pstar1-2 recessive gametes are viable ... 37
2.3.6. Unexpected SNP segregation ... 39
2.3.7. HRM genotyping finally reveals Pstar1 mutants ... 41
2.3.8. PsTAR3 is not ‘Gene 2’ ... 44
2.3.9. Transformation supports the two genes hypothesis ... 44
2.3.10. Plants breed true-to-type ... 47
2.3.11. Phenotypic characterization ... 49
2.3.12. Seed auxin content is not reduced in Pstar1-1 ... 51
2.4. Discussion... 52
2.4.1. Pstar1 gametes and rate of seed abortion are not affected in heterozygotes ... 52
2.4.2. Pstar1 mutants are finally obtained ... 53
2.4.3. The novel Pstar1 mutants do not exhibit any obvious phenotypes ... 54
Chapter 3 - Characterising the YUC1 pea enzyme and obtaining a novel crd mutant ... 56
3.1. Introduction ... 56
3.1.1. A paradigm shift ... 58
3.1.2. A novel yuc1 mutant allele ... 60
3.1.3. Aims ... 62
3.2. Materials and methods ... 63
3.2.1. Plant material ... 63
3.2.2. Phylogeny ... 63
3.2.3. Mutant alleles SIFT score ... 63
3.2.4. Inferred protein structure and binding sites ... 64
3.2.5. Genotyping the crd-4 allele ... 64
3.3. Results ... 66
3.3.1. One in a 100 ... 66
3.3.2. Inferred phylogeny ... 67
3.3.3. PsYUC1 protein structure ... 69
3.3.4. Important PsYUC1 binding amino acids ... 73
3.3.5. The effects of the crd mutations on PsYUC1 ... 80
3.3.6. The crd-4 mutant also carries the Pstar1-1 mutation ... 88
3.4. Discussion... 90
3.4.2. The crd mutations demonstrate the importance of several motifs ... 92
3.4.3. The crd-4 mutant reveals a novel region required for PsYUC1 function ... 94
3.4.4. Obtaining a novel crd allele ... 95
Chapter 4 - Characterisation of the crd mutant phenotypes ... 97
4.1. Introduction ... 97
4.1.1. Auxin and root development ... 98
4.1.2. The compound leaf of pea ... 100
4.1.3. Pea shoot ontogeny ... 101
4.1.4. The flowering programme of pea ... 103
4.1.5. Reproductive output... 104
4.1.6. Aims ... 106
4.2. Materials and Methods ... 109
4.2.1. Plant material ... 109
4.2.2. Controlled crosses ... 109
4.2.3. Phenotypic characterisation ... 110
4.2.4. Shoot dry weights ... 110
4.2.5. DR5 construct ... 110
4.2.6. Histological analysis of GUS activity ... 111
4.2.7. Analyte extraction ... 112
4.2.8. UPLC-MS... 113
4.3. Results ... 115
4.3.1. Disruption in PsYUC1 affects root development ... 115
4.3.2. The shoot vegetative development of crd-4 is altered ... 121
4.3.3. Allelic comparison of the crd flower phenotypes ... 133
4.3.4. Further reproductive traits are affected in the crd mutants ... 138
4.3.5. Auxin activity is affected in the crd mutants ... 144
4.3.6. IAA and IAAsp contents are affected in crd mutants ... 147
4.4. Discussion... 151
4.4.1. The lateral roots of crd mutants ... 151
4.4.2. The shoot development of crd mutants ... 153
4.4.3. Reproductive traits of crd mutants ... 156
4.4.4. GA does not appear to contribute to the crd phenotypes ... 158
4.4.5. The crd-4 mutation is as detrimental as the loss-of-function crd-3 ... 159
Chapter 5 - Inquiries into IAA inactivation in pea and the effects of IPyA breakdown ... 162
5.1. Introduction ... 162
5.1.1. Auxin metabolism: making IAA inactive ... 162
5.2. Materials and Methods ... 169
5.2.1. Chemicals ... 169
5.2.2. Plant material ... 169
5.2.3. Growth assays ... 170
5.2.4. Derivatisation and hormone extraction... 170
5.2.5. UPLC-MS... 171
5.3. Results ... 173
5.3.1. IAA oxidation does not appear to be active in the apical portion of pea ... 173
5.3.2. Applied IAAsp did not affect root length ... 178
5.3.3. IPyA and/or IAAld contributes to the IAA pool post-extraction ... 179
5.3.4. The antioxidant effect on stabilising IPyA and/IAAld ... 180
5.3.5. Relative IAA content in crd-4 ... 182
5.4. Discussion... 185
5.4.1. Evidence that oxIAA is not a catabolic product of IAA in pea apical buds... 185
5.4.2. IAAsp did not alter root growth ... 187
5.4.3. IPyA break down contributes to the IAA pool post-extraction ... 187
5.4.4. In conclusion ... 188
Chapter 6 – Concluding discussion ... 191
6.1.1. PsTAR1 does not appear to be essential for early seed development ... 191
6.1.2. A novel FMO domain is identified ... 192
6.1.3. PsYUC1 is required for normal lateral organ formation ... 193
6.1.4. Auxin metabolism is compromised in the crd mutants ... 194
6.1.5. IPyA breakdown contributes to the IAA pool post-extraction ... 195
6.1.6. Concluding remarks ... 195
Appendices ... 197
Chapter 1 - A summary of auxin biology
1.1. General introduction
Plants adapt their growth and development to respond to ever-changing internal and external cues. The molecular machinery that regulates the response processes is coordinated internally by signalling molecules, principally, plant hormones (reviewed in Davies, 2010). Auxin is one of the classical hormones and is considered critical to plant life. Indeed, auxin participates in a vast array of developmental processes, including root and shoot architecture, organogenesis and reproductive output, principally by modulating cell differentiation, cell division and cell elongation in a tissue-specific context (Abel and Theologis, 2010).
As with all hormone classes, auxin is a naturally-occurring bioactive compound found at low concentration (reviewed in Hedden and Thomas, 2008) . The term auxin is generally used singularly but there are five known endogenous auxins, three of which are known to have bioactive properties. Widespread in higher plants, the most studied auxin is indole-3-acetic acid (IAA). Present in a few legumes, such as peas and lentils, 4-chloroindole-3-acetic acid (4-Cl-IAA) was reported to play a critical role in seed development (McAdam et al., 2017a). Phenylacetic acid (PAA) is thought to be necessary for effective root/symbiont interaction (Somers et al., 2005). The functions carried out by butyric acid (IBA) and indole-3-propionic acid (IPA) remain unclear. They may possibly serve as stable forms of IAA storage and can be conjugated and hydrolysed back to their original form (Ludwig-Muller, 2011), but to date, have no known specific auxin activity (reviewed in Normanly, 2010; Woodward and Bartel, 2005). All have simple chemical
structures (Calderón-Villalobos et al., 2010) comprising an aromatic indole ring and a terminal carboxylic acid group.
Adamowski and Friml, 2015; Korasick et al., 2013; Ljung, 2013; Zhao, 2018). Indeed, plants must constantly maintain auxin homeostasis to respond appropriately to endogenous and environmental signals.
1.1.1. IAA biosynthesis
IAA is thought to be biosynthesised in the cytosol from precursors produced by the shikimate pathway, or indole-3-glycerol phosphate (IGP), indole (Normanly et al., 1993; Ouyang et al., 2000; Zhang et al., 2008) and tryptophan (Trp) (reviewed in Davies, 2010). IGP and indole, both precursors of Trp, are also considered to be direct precursors of IAA in the “Trp-independent” route, which has been implicated
in Arabidopsis early embryo patterning (Wang et al., 2015). However, key
components, functions and developmental impacts of the Trp-independent pathway remain uncertain. On the other hand, the role of tryptophan (Trp) as the main precursor for IAA is now well established in a range of species (Kriechbaumer et al., 2006; Mashiguchi et al., 2011; Tivendale et al., 2014; Zhao, 2018).
In the past, four Trp-dependent pathways have been proposed, with each being named based by the precursor downstream of Trp: indole-3-pyruvic acid (IPyA), indole-3-acetamide (IAM), tryptamine (TRA) and indole-3-acetaldoxime (IAOx) (reviewed in Tivendale et al., 2014). Certain in vivo and in vitro experimental data have demonstrated that several compounds involved in these pathways are able to participate in auxin production. For example, labelled-TAM was shown to be converted to IAA in pea roots (Quittenden et al., 2009) and in Arabidopsis, the IAOx-related mutants had altered IAA synthesis (Barlier et al., 2000; Boerjan et al., 1995; Ljung et al., 2005).
coded for by the TRP AMINOTRANSFERASE OF ARABIDOPSIS1 (TAA1) and
TAA1-RELATED (TARs) gene family (Stepanova et al, 2008; Tao et al, 2008). The
intermediate IPyA is then converted to IAA by flavin monooxygenases (YUCCA) enzymes (Mashiguchi et al., 2011; Won et al., 2011) encoded by the YUC gene family (Cheng et al, 2006; Zhao et al, 2001). Mounting genetic and biochemical evidence indicates that the IPyA pathway is most likely a major contributor to the IAA pool in higher plants due to its involvement in a range of vegetative and reproductive developmental processes (Dai et al., 2013; Mashiguchi et al., 2011; Stepanova et al., 2011; Won et al., 2011; Zhao, 2012). Many of these are described in the experimental chapters of this thesis.
Figure 1.1. The 2-step IPyA pathway. The TAA1/TARs transaminase Trp to IPyA and the YUCs decarboxylase IPyA to IAA.
1.1.2. Sites of production and IAA transport
IAA is produced in developing tissues, such as apical buds and young leaves and is generally described as being transported downwards, in a polar fashion, towards the roots. It is transported in two distinct fashion: passively through the phloem for long-distance transport (Swarup et al., 2001) and actively between cells, assisted by efflux and influx membrane transport proteins for short-distance transport (Friml, 2003). Indeed, due to its chemical nature, IAA is less polar (or more protonated) under low pH conditions, such as in the apoplast, and diffuses readily into cells. Once in the cytosol, the pH is higher and IAA becomes unprotonated. Being
TAA1/TAR s
YUCs
negatively charged, IAA can no longer diffuse across membrane and remains in the cell (Ljung, 2013). Active IAA transport was therefore proposed as a prerequisite for the formation and the distribution of the differential auxin concentration required by plants (Benková et al., 2003; Zažímalová et al., 2010).
The chemiosmotic model for auxin transport proposes that auxin content is modulated by the asymmetric localisation and the amount of AUXIN1/LIKE-AUX1(AUX/LAX) and PIN-FORMED (PIN) transport proteins at the cell
membrane (reviewed in Friml and Palme, 2002; Swarup and Péret, 2012). Indeed, the efflux carriers, visualised with GFP, accumulated at the membrane of cells (Friml et al., 2002) and correlated with auxin-reporter constructs activity revealing that novel organs eventually emerged from sites where auxin signalling was most active (Benková et al., 2003; Dubrovsky et al., 2008). Furthermore, the pin1 mutant of
Arabidopsis, with altered efflux carrier distribution, formed very few organs at the
shoot (Blilou et al., 2005; Petrášek et al., 2006). The polar transport of shoot-derived IAA was thought to generate the appropriate gradients and maxima required by the various sinks for growth and development to occur (reviewed in Adamowski and Friml, 2015; Robert and Friml, 2009).
However, IAA can also be locally synthesised at sites where it will be perceived. In other words, this locally produced auxin is not destined for transport but to trigger molecular changes in situ, at the site of production (reviewed in Zhao, 2018). Indeed, expression profiles, in situ hybridisation and mutant studies demonstrated that TAA1/TARs and YUCs do not have ubiquitous activity but have localised and dynamic expression patterns in specific cells both at a spatial and temporal level (Cheng et al., 2006, 2007; Stepanova et al., 2008; Tao et al., 2008). Mounting evidence further supports that local auxin biosynthesis is integral to a plethora of development processes and to the capacity of a plant to respond to its changing environment (reviewed in Zhao, 2018).
1.1.3. Auxin perception and signalling
Auxin homeostasis is of paramount importance for growth and development to occur normally but auxin must also be perceived for any change to take place. Research in auxin perception and signalling has progressed immensely and much of the
molecular machinery underpinning the mechanism has been identified, principally in Arabidopsis.
Nuclear auxin perception and the ensuing signalling molecular cascade relies on the ubiquitination of the AUXIN/INDOLE ACETIC ACID (Aux/IAA) proteins by the SKP-Cullin-F box (SCF) TRANSPORT INHIBITOR RESISTANT1/AUXIN SIGNALING F-BOX (TIR1/AFB) complex, referred to as the AFB receptor, once auxin is perceived (Dharmasiri et al., 2005; Kepinski and Leyser, 2005). In
summary, when auxin binds to an AFB receptor, Aux/IAA docks in the pocket and is carried away for proteolysis. This derepresses the Auxin Response Factors (ARFs), liberating the associated Auxin Response Elements (AuxRE) located in the promoter region of an auxin-inducible gene and in turn, allows transcription to occur (for reviews, see Guilfoyle and Hagen, 2007; Salehin et al., 2015).
The auxin signalling machinery imparts versatile output capacity to the auxin signal.
In Arabidopsis, there are six nuclear receptors (Dharmasiri et al., 2005), 23 ARFs
Interestingly, once Aux/IAA is degraded, the auxin molecule is released from the receptor and maintains its bioactive function (Calderón-Villalobos et al., 2012; Tan et al., 2007). Other mechanisms, such as transport and inactivation, are required to reduce the auxin signal at a cellular/tissue level.
1.1.4. Auxin metabolism
Auxin metabolism has been proposed to participate in the fine tuning of auxin homeostasis by optimising the IAA gradients at a cellular and tissue level (reviewed in Ludwig-Müller, 2011; Korasick et al., 2013). The metabolism of auxin is
regulated by several mechanisms including conjugation, storage and catabolism (reviewed in Ljung, 2013). Indeed, much of the auxin, up to 75% depending on the species studied, is modified in form and is biologically inactive (reviewed in Ludwig-Müller, 2011). IAA can be conjugated to sugars or amino acids via ester links (IAA Glucose, IAGlc) and amide links (IAA-AA) respectively (reviewed in Ljung, 2013). IAA can also be oxidised (2-oxoindole-3-IAA, oxIAA) (reviewed in Stepanova and Alonso, 2016) and methylated (ester methyl IAA, MeIAA) (Qin et al., 2005; Yang et al., 2008).
Figure 1.2. IAA metabolic pathways. IAA is methylated to MeIAA by IAMT1 and hydrolysed by MES17. The UGTs are responsible for ester-linked conjugation of IAGlc. The GH3s conjugates the amide-linked conjugates, ILRs and IAR3 hydrolyse IALeu and IAAla respectively and the DAOs oxidise IAA to oxIAA. IAAsp and oxIAA are proposed to be further broken down to oxIAAsp and oxIAA and IAGlc, to oxIAGlc. Solid arrows represent demonstrated conversions and dashed arrows indicate pathways where genes and enzymatic activity are uncertain.
1.1.5. Pisum sativum as a model species
Pisum sativum, referred to as pea hereafter, is classified as belonging to the
Hologalegina clade, the ‘cool-season legumes’, of the Papilionoideae subfamily. The papilionoid lineage underwent a whole genome duplication event at the beginning of its speciation approximatively 50 Mya (Shoemaker et al., 2006). Duplication events are not unique to legumes and lead to paralogous duplicates with new gene copies gaining novel or diversified/specific functions over time, when compared with the ancestral genes (Cannon, 2013). The pea genome has experienced several duplication events post speciation from Medicago. Indeed, despite sharing a high degree of chromosome-based synteny with Medicago, pea has a much larger genome (up to 10 times bigger or ~4770 Mbp) (Zhu et al., 2005). Pea and several legumes, such as soybean, lentil, chickpea, peanut, and the common bean, to name a few, are of great economic and agronomic importance (Duke, 2012). These crop species are significant resources for human nutrition, animal feed and several industries. In a scientific context, legumes are the third largest family of flowering plants and are efficient at fixing nitrogen. It is therefore imperative that model legumes be integral to studies pertaining to genetics, development biology, biochemistry, physiology and plant-microbe interactions.
Pea, in particular, due to its size, lends itself particularly well to physicochemical studies. Its short life cycle (3 to 4 generations per year) permits the crossing and selection of genetic material relatively rapidly.
1.1.6. Thesis overview
Results from mutant and phylogenetic analyses suggest that the TAA1/TAR and YUC gene families have expanded in both eudicots and monocots with extensive
The current thesis will concentrate on the TAR/YUC route of auxin biosynthesis in pea, addressing questions pertaining to IAA biosynthesis and metabolism and their effect on pea development.
The focus of this thesis will therefore be two-fold. First, to investigate the potential contributions that the IPyA pathway may have to auxin biosynthesis in pea by monitoring auxin precursors, conjugates and auxins content from several tissue types. Second, to examine the impacts that IPyA-derived auxin may have on pea morphology by characterising the phenotypes of the auxin mutants.
In the first experimental chapter, the strategy to identify two novel Pstar1 homozygous recessive mutants is outlined. Obtained from the reverse genetic technique TILLING (Dalmais et al., 2008), the mutants had to be genotyped based on the identification of their respective point mutations. This goal was complicated by the fact that contradictory results were obtained from the different genotyping techniques used. One hypothesis to explain this is that a second gene, a duplicate of
PsTAR1, nearly identical in sequence, is present in the pea genome. High-resolution
melt analysis (HRM), cloning techniques and segregation ratios over several generations supported this ‘Two Genes’ hypothesis. Once the Pstar1 homozygous lines were identified, phenotypes and auxin content were examined. Despite
PsTAR1 being previously reported to be highly expressed in young pea seeds, the
mutant analyses revealed that PsTAR1 is not required for auxin biosynthesis during that developmental stage. In fact, there were no obvious phenotypes attributable to these mutations.
important, are proposed to be critical for the stability and functioning of the pea FMO enzyme.
In Chapter 4, the crd phenotypes are further characterised to investigate the influence of the PsYUC1 gene on pea development in general. Lateral root number, rate of node and leaflet formation, floral organ morphology and seed yield were negatively impacted when compared with wild type lines. Visualisation of auxin activity with an auxin-reporter construct from actively developing tissues in the mutants and the WTs demonstrated that auxin activity is adversely affected in the mutants. However, IAA content was not affected in root and flower tissues and only mildly reduced in the apical bud despite strong phenotypes being exhibited. Differences in IAA aspartate conjugate (IAAsp) content between the WT and the mutants suggest that the rate of conjugation is a likely mechanism for auxin homeostasis. Based on phenotypic evidence and hormone profile, I propose that PsYUC1 is principally active at the meristematic and/or the primordial cells of root, shoot and inflorescence meristems where it participates in lateral organ formation. However, the IAA in crd mutants was often quite similar to that of the WT.
The last experimental chapter investigates potential explanations for the apparent decoupling of the crd phenotypes and IAA content. First, to test if other deactivation products are present in pea, 2-oxoindole-3-acetic acid (oxIAA), now considered to be the main auxin deactivation product in Arabidopsis (reviewed in Stepanova and Alonso, 2016), was monitored in pea apical portions. However, oxIAA was not detected and results demonstrated that IAAsp is the main conjugate in the shoot. In addition, the potential biological properties of IAAsp, previously proposed to be growth-promoting in pea roots (Ostrowski et al., 2016), were tested in root growth assays. This was done to ascertain that the reduced IAAsp content found in the crd mutants does not influence the phenotypes. The assays refuted the theory that IAAsp is biologically active per se. Furthermore, the unstable IAA precursor, IPyA, was previously shown to accumulate in Arabidopsis higher-order yuc mutant and its nonenzymatic breakdown was proposed to partially restore IAA content in mutant samples post-extraction. The present results do not support this proposition as the
crd-4 mutant did not contain higher levels of IPyA when compared with WT.
Chapter 2 - The auxin biosynthesis gene
PsTAR1
2.1. Introduction
Indole-3-acetic acid (IAA), the principal auxin in plants, is now thought to be principally biosynthesised via the two-step indole-3-pyruvic acid (IPyA) pathway (Mashiguchi et al., 2011; Won et al., 2011). In the first step, tryptophan (Trp) is converted to IPyA by the Trp aminotransferase enzymes. The Trp aminotransferases were first identified in Arabidopsis from two independent forward genetic screens (Stepanova et al., 2008; Tao et al., 2008).
2.1.1. The tryptophan aminotransferases
Phenotypic analysis of two allelic mutants with disruptions in the TRYPTOPHAN
AMINOTRANSFERASE OF ARABIDOPSIS1 (TAA1) gene indicated that TAA1 is a
key enzyme involved in auxin-dependent developmental processes and in auxin biosynthesis. The shade-avoidance sav3 mutant has reduced auxin biosynthetic activity and diminished auxin response or hypocotyl elongation when compared with the WT under shade conditions (Tao et al., 2008). The ethylene-insensitive wei8 mutant does not exhibit obvious morphological defects when compared with WT apart for root-specific defects when an ethylene precursor (ACC) is applied during growth (Stepanova et al., 2008). Four extra TAA1-related genes (TAR1-4) were also identified. Similarly to taa1, single tar mutants do not have obvious phenotypes, but multiple mutant combinations containing taa1 exhibit severe defects in meristem maintenance, root gravitropism, apical hook and gynoecium development. Results from the mutant combination analysis indicate a level of functional redundancy within the TAR family in Arabidopsis (Stepanova et al., 2008).
inhibitor N-1-napthylpthalamic (NPA) -resistant tir2 plants have reduced auxin activity under high temperature treatment. Root gravitropic defects, reduced root meristem and hypocotyl auxin response phenotypes were observed in the mutant (Yamada et al., 2009). Lastly, the cytokinin-induced root curling 1 (ckrc1) mutant is insensitive to cytokinin. The addition of cytokinin did not induce the expression of TAA1 in the mutant but did so in the WT. The ckrc1 mutant has defective root gravitropic response and reduced primary root growth (Zhou et al., 2011). The pleiotropic phenotypes of the mutant alleles demonstrate the importance of the TARs for plant development and the extent to which the enzymes contribute to multiple regulatory processes and interacts with a range of phytohormone pathways. The TARs have strong sequence similarities with the alliinases found in Allium species (Kuettner et al., 2002) and belong to the super-family of the α class of pyridoxal-5-phosphate (PLP) dependent enzymes (reviewed in (Percudani and Peracchi, 2003). Structural crystal studies of TAA1 proteins in bonded configuration with ligands revealed important residues for interaction with the PLP cofactor and confirmed that Trp is the preferred substrate for TAA1 (PDB code: 3BWN,
www.rcsb.org; Tao et al., 2008). In vitro assays of the WT and the mutant purified proteins tested in the presence of PLP confirmed that TAA1 has Trp
aminotransferase activity while activity in the mutant proteins was reduced
(Stepanova et al., 2008). Furthermore, the levels of IPyA extracted from Arabidopsis seedlings and flower buds from higher order mutants had a 32% and 62% reduction respectively when compared with WT (Mashiguchi et al., 2011).
The Trp aminotransferases are highly conserved in angiosperms. The TARs have been identified in Arabidopsis (Tao et al. 2008; Stepanova et al. 2008), maize (Zea mays) (Phillips et al., 2011), rice (Oriza sativa ) (Abu‐Zaitoon et al., 2012;
Yoshikawa et al., 2014), pea (Pisum sativum) (Tivendale et al., 2012) and wheat (Triticum aestivum) (Shao et al., 2017). Unlike in Arabidopsis, single tar mutants outside of the Brassicaceae have strong phenotypes when grown in normal
conditions. For example, in maize, vanishing tassel2 (vt2), a TAA1 co-orthologue, is semi-dwarf, has reduced leaf numbers due to defects in leaf initiation, barren
phenotypes due to a reduction in IAA levels (Yoshikawa et al., 2014). This indicates that the genetic and functional redundancy amongst the TARs in Arabidopsis appears to be less prevalent in other species and stresses the importance of investigating gene function at a multi-species level.
2.1.2. Specific roles for the TARs in seed development
The TARs are now well established as being central to auxin biosynthesis. There is also increasing evidence demonstrating the importance of the generation and maintenance of auxin gradients through de novo auxin synthesis during
embryogenesis and seed growth (reviewed in (Robert et al., 2015). The TAR gene family has been shown to be required during embryogenesis but expression patterns and spatial and temporal contribution of the specific TARs is variable across species. Indeed, in Arabidopsis, triple mutants are required to obtain embryo defects
(Stepanova et al., 2008). Discriminating between the developmental effects of the five TARs is challenging due to their apparent functional overlap.
Rice contains only two TARs (Abu-Zaitoon et al., 2014). A 50-fold increase in IAA was recorded during grain development and so, an increase in the expression of auxin biosynthetic genes was predicted. OsTAR1 (FBL) expression was weak in the early developmental stage (1 day after pollination, DAP) but increased dramatically at the beginning of the major starch synthesis phase (7 DAP) and was maintained until starch deposition was complete (21 DAP). On the other hand, OsTAR2 (FIB) was highly expressed throughout seed development (Abu-Zaitoon et al., 2014). Interestingly, OsTAR2 was also constitutively expressed throughout the plant in all tissues tested while OsTAR1 was only expressed in anthers, ovaries and seeds (Yoshikawa et al., 2014). These results suggest that OsTAR1 codes for a grain-specific TAR.
2.1.3. TARs in pea seeds
in particular. As pea seeds are an important protein-rich source of food and
feedstock, understanding how the TARs affect seed development has the potential to enhance yield and productivity.
There are four sequenced TARs in pea; three are annotated in GenBank (PsTAR1,
PsTAR2, PsTAR3, www.ncbi.nlm.nih.gov/) and the forth TAR (PsCam057706) can
be found in the Pea RNA gene atlas (bios.dijon.inra.fr/FATAL/cgi/pscam.cgi). Data from the Pea RNA Atlas show a clear delineation of gene expression amongst the
PsTAR members. PsTAR1 and PsTAR3 are close homologues, sharing a high
sequence similarity. However, they are differently expressed spatially with PsTAR1 being mainly expressed in young pods and immature seeds, while PsTAR3 is predominantly expressed in the root system. PsTAR2 and its closely related PsCam057706 are expressed in all tissues tested (Table S2.1).
Expression profiles of PsTAR1, PsTAR2 and PsTAR3 in developing seeds have been described (McAdam et al., 2017a; Tivendale et al., 2012). Similarly to rice,
expression profiles of the PsTARs were also temporally partitioned but somewhat differently (Tivendale et al., 2012). PsTAR1 was predominantly expressed in the early stages of seed development unlike OsTAR1 that predominated in the later stages (Abu-Zaitoon et al., 2014). The high expression of PsTAR1 also correlated with elevated levels of IAA. As seed development progressed, at 12 days post anthesis (DPA), IAA levels decreased substantially as did PsTAR1 expression. A reversal of the pattern occurred with PsTAR2 (Tivendale et al., 2012). Low
expression levels in the early stages correlated with low levels of the highly bioactive seed-specific chlorinated form of auxin found in pea (4-Cl-IAA) (Lam et al., 2015; Reinecke, 1999). At 16 DPA, PsTAR2 was highly expressed and high levels of 4-Cl-IAA were recorded. In the later stage (35 DPA), 4-Cl-4-Cl-IAA content had substantially decreased, PsTAR2 expression had decreased by 60% and PsTAR3 was marginally expressed, but still only about 5% of the PsTAR2 expression level(Tivendale et al., 2012). PsTAR3 does not appear to be an important contributor during seed
development.
had decreased by 90% in the later developmental stages (Tivendale et al., 2012). Reduced auxin content was subsequently linked to seed phenotype. Indeed, mature seeds of the Pstar2 mutant alleles are smaller, in part due to smaller cell size, and
Pstar2-1 seeds are wrinkled, with significantly decreased starch content and starch
granule morphology resembling that found in immature WT seeds (McAdam et al., 2017). These results indicate that PsTAR2 is a key determinant in starch synthesis and accumulation during the later stages of seed development and is most likely involved in 4-Cl-IAA synthesis (McAdam et al., 2017a). This raises the question; does PsTAR1 function as an important auxin biosynthesis gene in early pea seed development? And is PsTAR1 required for successful embryo development?
2.1.4. The Pstar1 mutant alleles
Eleven uncharacterised Pstar1 mutant alleles were previously obtained from an ethyl methanesulfonate collection using the Target-Induced Local Lesions in Genome (TILLING) screening method (Table S2.2). TILLING is a forward and reverse genetics protocol developed for species that are recalcitrant to Agrobacterium-based transformation, such as pea (Dalmais et al., 2008). Two of those lines, line 905 and 2601, were predicted to produce truncated proteins while five had SIFT scores below the accepted threshold and were therefore predicted to be aberrant.
Several lines with a range of predicted impacts were grown to obtain mutants and to compare the effects of the different mutations: line 784, 1240, 2121 and 1424, predicted as aberrant and line 970 and 2374, predicted to be WT-like. However, no obvious phenotypes were perceivable, and no homozygous recessive individuals were detected from any of the Pstar1 populations (R. Ali, unpublished).
The requirement of specific genes to the process of fertilisation has previously been demonstrated in Arabidopsis mutants. The abstinence by mutual consent (amc) mutant has disrupted male/female gamete interaction during fertilisation (Boisson-Dernier et al., 2008). Recessive pollen tube growth and discharge is impaired when interacting with a recessive female gametophyte, thus preventing the production of homozygous mutant seeds. Boisson-Dernier and colleagues (2008) proposed that ‘a diffusible signal emanating from either gametophyte’ is required for pollen tube reception. In this model, the impaired production or release of an unknown molecule from a recessive gametophyte can be rescued by the presence of the molecule
produced by another functional gametophyte (Boisson-Dernier et al., 2008). The phenomenon of a second pollen tube rescuing an earlier failed attempt at fertilisation by a previous dysfunctional gamete was termed ‘fertilisation recovery’ by Kasahara and colleges (2012). The fertilisation rates of the gametophytic fertility mutant duo
pollen3-2 (duo3-2; also called g21) were higher than expected due to WT pollen
fertilising an ovule after a failed attempt by a mutant pollen (Kasahara et al., 2012).
This similar line of logic was extended to our system as the novel Pstar1 mutant lines did not appear to be able to produce homozygous mutant seeds. The Pstar1 pollen tube and female gametophytes could have impaired de novo auxin
biosynthesis. If auxin directly or indirectly modulates a signal required for male-female interaction, a decrease in auxin content would prevent the recessive gametes from fertilising one another. However, if gametes were viable and an essential auxin pool derived from PsTAR1 was impaired in the mutants, seeds may be formed but abort during the early embryo stages.
This led to speculation regarding potential reasons for the apparent lack of homozygous recessive seeds/plants for either of the two mutations concerned.
Three potential explanations are:
1. Recessive pollen fertilises recessive ovule, a homozygous recessive zygote is produced but subsequently aborts.
3. The two recessive gametes are viable, but their interaction is impaired for an unknown reason.
2.1.5. Aims
The aims of this chapter are to investigate the roles that PsTAR1 may have in pea development in general with a particular focus on seed production and development. Based on previous methods employed to examine PsTAR2 function in auxin biology and seed development (Tivendale et al., 2012; McAdam et al., 2017), similar
strategies will be used to address the goals of this project. A multidisciplinary approach comprising genetic and molecular techniques, auxin quantification and morphological characterisations will be used to tackle the next three specific goals.
The first goal, with a focus on the two truncated lines (905, Pstar1-1 and 2601,
Pstar1-2), is to isolate and obtain novel Pstar1 mutant and to characterise the mutant
alleles. Gamete viability and rate of seed abortion will also be investigated to further test the impacts of the Pstar1 mutations on those developmental processes. A polymerase chain reaction (PCR), restriction fragment length polymorphism analysis (RFLP) and sequencing based approach will be used to genotype the segregating populations and identify the Pstar1 mutants.
The second goal is to characterise the phenotypes of the novel Pstar1 mutants. Morphological phenotypes will be examined for each genotype. All apparent vegetative phenotypes will be monitored, with an emphasis on reproduction and early seed development.
The third goal is to investigate if PsTAR1 has a temporal auxin biosynthesis role during seed development. IAA and 4-Cl-IAA content, two auxins relevant to seed development (Reinecke et al., 1999; Tivendale et al., 2012; Lam et al., 2015; McAdam et al., 2017), will be quantified in Pstar1 mutants and WT seeds. Analysing auxin patterns in Pstar1 mutants will help to test if the Pstar1-1 and
2.2. Materials and Methods
2.2.1. Plant materials
The Pstar1-1 (line 905) and Pstar1-2 (line 2601) alleles (the mutant alleles) are on
the dwarf Caméor background (line JI 3253) and were back-crossed six times to remove any other mutations potentially present in the genome. The wild-type (WT) plants used for this study were the dwarf (le-1) cv. Caméor, the tall (LE) cv. Torsdag (JI 3167) and the WT progeny segregating from heterozygous parents. All plants used were the progeny from the sixth backcrosses. Seeds were nicked to allow for even germination rate and treated with a fungicide at sowing time. All plants were grown individually in slimline 14 cm sterilised pots containing a 1:1 ratio of
vermiculite and gravel then topped with 3 cm of potting mix. Seeds were germinated and grown in a heated greenhouse under natural photoperiod conditions (Hobart, Tasmania).
Of importance to note and to clarify nomenclature, Pstar1-1 and Pstar1-2 are referred as the ‘905 SNP’ (Single Nucleotide Polymorphism) and the ‘2601 SNP’, respectively, in some of the experiments included in this chapter.
2.2.2. Genomic DNA extraction
Genomic DNA extraction of all plant material was performed using a modified version of a CTAB protocol described in (Doyle and Doyle, 1987). Young expanding leaves were harvested (~100 mg), immediately frozen in liquid N2 and stored at -80°C until needed. Material was grinded for 2 minutes (30Hz) with a Tissue Lyser in 1.7ml screw-cap Eppendorf tubes containing Tungsten carbide beads (3mm, Qiagen) without lysis buffer. This step is critical as it disrupts the cells, releases the nucleic content and shears proteins and carbohydrates contained in the plant material. Extraction buffer (500 μl; 100 mM TRIS-HCl pH 8, 1.4 M NaCl, 20 mM EDTA, 2% w/v CTAB) was added to each tube, thoroughly mixed and
sequentially where 500 μl of chloroform/Isoamylic alcohol (24:1 ratio) was added to the tubes, mixed by gentle inversion, centrifuged at 14000 rpm for 1 min and the upper aqueous phase was transferred to new 1.5 ml tubes. After the majority of the organic content was removed from the samples, 1ml of precipitation buffer was added (50 mM TRIS-HCl pH 8, 10 mM EDTA, 1% w/v CTAB), mixed by gentle inversion, incubated at room temperature for 10 min and centrifuged at 14000 rpm for 10 min to form a pellet. Supernatant was discarded, RNAse A buffer added to the tubes containing the pellet (300 μl; 1.5M NaCl, 25mg/ml Rnase A) and incubated for 30 min at 50°C. To precipitate the DNA, 600 μl of 100% ethanol was then added to the tubes, inverted gently, centrifuged at 14000 rpm for 10 min and the
supernatant discarded. Pellet was washed (200 μl; 70% ethanol), centrifuged at 14000 rpm for 5 min, air-dried and resuspended in 100 μl of water. All DNA samples were kept at -18°C.
2.2.3. Sequencing primer design
All primers were designed using Primer 3 (fokker.wi.mit.edu/primer3/input.htm) with an optimal primer size of 30±2 base pairs (bp), melting temperature (Tm) of 70±1°C and a GC nucleotide % of 35 to 55. Primer efficiency and secondary structures were tested for with Net Primer (premierbiosoft.com). Hairpins of -0.64, 3’ dimmers of -8 and 5’ dimmers of -6 were tolerated. All primers used for
sequencing are included in Table 2.2. Once sequenced, data were organised with the Sequencher software (5.1), which also provided the predicted coding protein
Table 2.2. Full-length and nesting primers used for sequencing PsTAR1.
2.2.4. Phylogenetic analysis
The phylogeny of Pisum sativum TARs was inferred using alignments of full- length translated TAA1/TAR protein sequences. The phylogeny tree was rooted using the canonical garlic alliinase (Rabinkov et al., 1994). Sequences can be found under the relevant accession numbers in the GenBank/EMBL database, the Arabidopsis information resource TAIR (www.arabidopsis.org/) and the pea RNA-seq gene atlas (bios.dijon.inra.fr/FATAL/cgi/pscam.cgi). The sequences were aligned using clustalW (www.genome.jp/) with BLOSUM matrices as these are the most efficient at carrying out protein database homology searches.
2.2.5. Genotyping
Due to the lack of visual phenotypes in the two mutant lines, genotyping protocols based on PCR and restriction fragment length polymorphism analysis (RFLP) were developed for the Pstar1 alleles (Dr S.E. Davidson and Dr L.J. Quittenden) (Table 2.3). Prior to digest, gDNA was extracted, as above, and amplified with the Advantage 2 polymerase mix (Clontech) or the proofreading polymerase (Velocity DNA polymerase; Bioline). In some instances, seedling tissue was amplified with the Terra PCR Direct Polymerase Mix (clontech.com). For both strategies, allele specific CAPS markers designed using the dCAPS Finder 2.0
(helix.wustl.edu/dcaps/dcaps.html) were used to amplify the desired amplicons Gene Primer name Sequence (5’ to 3’)
PsTAR1 67g Fw (gDNA) TCCAAACACAAGAACTAAAACCAACAACTA
90 Fw (cDNA) ATGGTGGTTGCTAGAGACGGTTCATCATCT
126Nest Fw (cDNA) TACCTCTCTCCAATCTCTCATACGA 836 Rev (cDNA) CGAAAAAGAGGCGGTCTGATGGAGTG 1418Nest Rev (cDNA) CATCACAAATCACTTCAATAATCTTAGCAG
(Table 2). Aliquots from the PCR products (5 μl) were digested using the CutSmart Buffer protocol (NEB.com) with template specific restriction enzymes (Table 2.4). NEB recommended protocols for each enzyme were followed.
Table 2.3. RFLP specific primers for each allele in line 905 and line 2601.
Table 2.4. PsTAR1 lines with respective enzymes used, amplicons size from PCR product and cut patterns expected for each allele.
2.2.6. Inferred protein structure and binding sites
The PsTAR1 and mutant alleles protein architectures were predicted using the Phyre2
server (Kelley and Sternberg, 2009). For visualisation and presentation, structures generated with RaptorX were used due the manipulation capacity of the server (http://raptorx.uchicago.edu). To identify the potential binding residues,
MAMMOTH (Ortiz et al., 2002) was used to perform a full structural scan of the modelled structure against a library of protein structures with bound ligands.
Line allele Primer name Sequence (5’ to 3’)
905 WT 905dCap Fw GGGTGATCCAGTGGGATTCAGGAAATTCCG
391 Rev CAGCAACAACATTGAAGGGAATATGAGAGG
mutant 67gFw TCCAAACACAAGAACTAAAACCAACAACTA
391 Rev CAGCAACAACATTGAAGGGAATATGAGAGG
2601 WT 133 Fw GGAGAAATTGAGTGAAGAAGCAAAAGTGG
91 Rev TGACACACCAATGGAGCTTAGGTGCAAG
mutant 1071dCAP Fw GGAATGTTGTTTATGACTTGGCCTATTCTT
91 Rev TGACACACCAATGGAGCTTAGGTGCAAG
Line Cleaved allele Amplicon size Enzyme required Cleaved product
905 WT 290 bp HpaII 270/20bp
mutant 526 bp DdeI 267/258
2601 WT 1100 bp BsII 838/262
Homologous structures were then aligned with TMalign (Zhang and Skolnick, 2005) which resulted in the identification of the ligand clusters. Residues that were within a distance threshold (0.8 ångström) of the clustered ligands were predicted to be part of the binding site. Data were then compared to the Arabidopsis TAA1 (Tao et al, 2008) to infer the relevant binding residues of PsTAR1.
2.2.7. Reciprocal crosses
Reciprocal crosses were performed to assess if the female or the male Pstar1-1 and
Pstar1-2 recessive gametes are viable or if the interaction between the two recessives
is impaired, thus preventing fertilisation. Torsdag (line 107, LE) was used to ascertain that our original crosses were successful, as LE, in Torsdag, would rescue the dwarf phenotype of Caméor in the F1 generation.
All plants used in the crosses were emasculated prior to anther dehiscence. Mature pollen from Torsdag (line 107) was used to pollinate PsTAR1.Pstar1 flowers and mature PsTAR1.Pstar1 pollen was used to pollinate Torsdag. Resulting F1 seeds were grown. If the male recessive gametes are not functional, heterozygotes should not be obtained when crossed to Torsdag and if the female gametes are not viable, heterozygotes should not be produced when fertilised by Torsdag pollen. If
interaction between the two recessive Pstar1 gametes is impaired, the F2 generation originating from the heterozygotes carrying the Pstar1 alleles should not produce any homozygous recessive seeds. All plant material was sequenced and genotyped using RFLP protocols.
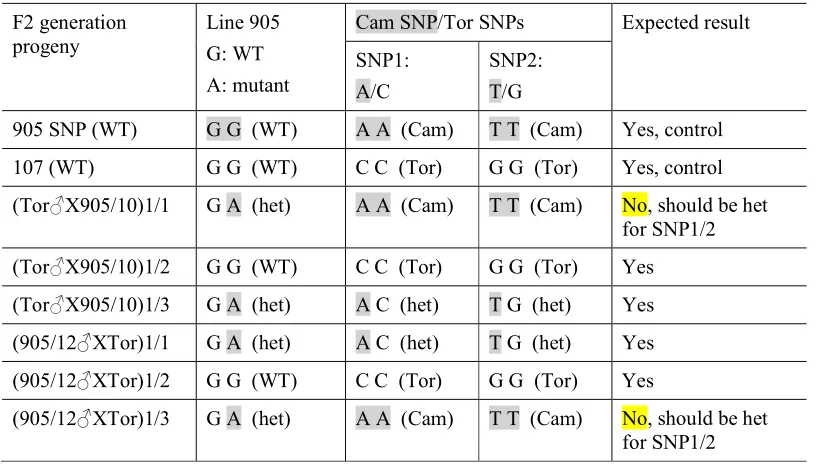
2.2.8. Caméor and Torsdag SNP segregation
2.2.9. High resolution melt analysis
High resolution melt (HRM) analysis was conducted using a SensiFAST HRM Kit (Bioline) with gene specific primers (Table 2.5). Each reaction contained 2 μL of sample gDNA (~ 50 ng μL), 5 μL of Sensifast mix, 1 μL each of forward and reverse primer (10 mM) and dH2O. Reactions were mixed using a CAS- 1200 liquid
handling robot (Corbett) and amplified using a rotorgene Q real time PCR cycler (Qiagen). All cycling runs were as follows: 95°C for 5 minutes, 50 cycles of (95°C for 10 seconds, 60°C for 30 seconds), 95°C for 5 minutes, 50°C for 5 minutes. HRM analysis included a 90 second first step and then, between 65°C and 85°C,
temperature was incrementally increased by 0.1°C every 2 seconds. Only samples with confidence level of 95% and above were included in the results.
Table 2.5. Primers used to genotype line 905, line 2601 and SNP2 contained in
PsTAR1 using high resolution melt analysis (HRM).
2.2.10. Transformation
Pisum sativum gDNA was extracted from apical portions of 4-week-old Caméor,
PsTAR1-1 and Pstar1-1 seedlings. PCR with Advantage 2 polymerase mix
(Clontech) and ThermoPol (NEB) and gene specific primers (Table 2.6) resulted in PCR fragments with the expected bands (227 base pairs) on agarose gel. The PCR
Gene SNP Primer Sequence (5’ to 3’) Amplicon size
PsTAR1 905 126 Fw TACCTCTCTCCAATCTCTCATACGA 301 bp
303 Rev CTTATCTTCTGTGTTTGCATTCCCA
242g Fw GTGATCCAGTGGGATTCAGG 138 bp
379g Rev TTGCATTCCTCATTTGTGGT
2601 1066g Fw CTGATGGAGAAGGGAATGTTG 134 bp
1200g Rev CGATACGAGAACCGGCGTGA
SNP2 334 Fw TTGGGAATGCAAACACAGAA 139 bp
products were purified (PCR clean-up system; Promega), ligated into pGEM-T-easy, and transformed into JM109 competent Escherichia coli (Promega). Plasmid DNA was isolated from individual colonies (Wizard plus SV minipreps; Promega) and sequenced by Macrogen DNA sequencing services (dna.macrogen.com/eng/). Nucleotide sequences were analysed and cleaned up using the Sequencher software version 5.1 (genecodes.com).
Table 2.6. PsTAR1 specific primer used to transform line 2601.
2.2.11. Phenotypic characterisation
Internode and stem length, shoot to root dry weight ratios, flowering node, time of flowering, number of pods, seeds per pod and seed weight were quantified and recorded.
2.2.12. Quantification of free auxins and UPLC-MS
Endogenous IAA and 4-Cl-IAA levels were measured from excised immature seeds (7 days post anthesis; 5mg each) from single pods. Seeds numbers ranged between 5.5 and 6.5 for each sample. Seeds were pulverised with a physcotron (Microtech) in 1 ml of 65% isopropanol containing 250 mg L-1 of butylated hydroxytoluene (BHT) along with the labelled internal standards [13C6] IAA (Cambridge Isotope
Laboratories) and [2H4] 4-Cl-IAA (generously supplied by Prof. Jerry Cohen). Samples were extracted overnight at 4°C then centrifuged to form pellets. The supernatants were transferred to clean eppendorfs and dried in a sample concentrator. Hormones were resuspended in 1% acetic acid in dH2O before being analysed by LC-MS.
Gene Line Primer name Sequence (5’ to 3’) Amplicon size
PsTAR1 2601 1081 FW CTGATGGAGAAGGGAATGTTG 227 bp
Samples were analysed as previously (Cook et al., 2016) with a solvent combination of 1% (v/v) acetic acid in water (solvent A) and acetonitrile (solvent B). The
modified UPLC program, ‘Phenylalanine Method’ or PA Method, was 95% A: 5% B to 50% A: 50% B at 4.5 min, followed by immediate re-equilibration to starting conditions for 3 min. The flow rate was 0.35 mL min-1 with the column held at 35°C, and the sample compartment was at 6°C. The mass spectrometer was operated in positive and negative ion electrospray mode with a needle voltage of 2.8 kV, and MRM was used to detect all analytes (Table 2.7). The ion source temperature was 130°C, the desolvation gas was N2 at 950 L per hour-1, the cone gas flow was 100 L per hour-1, and the desolvation temperature was 450°C. Data were processed using MassLynx software.
Endogenous hormone level contained within each sample was calculated by comparing the endogenous hormone transition peak area from and corresponding internal standard peak area.
For IAA:
endogenous peak area x ng of internal standard added = ng of IAA per g FW exogenous peak area g of fresh weight (FW)
The levels of 4-Cl-IAA were calculated in the same manner, however, a correction factor had to be used prior.
To correct endogenous 4-Cl-IAA:
uncorrected peak area – 0.06 x uncorrected internal standard peak area
To correct internal standard [2H4]4-Cl-IAA:
Table 2.7. MRM transitions monitored to identify and quantify endogenous auxins and labelled standards.
mode Analyte Primary transition Approximate
2.3. Results
2.3.1. PsTAR1 is a Trp aminotransferase
PsTAR1 belongs to the ArabidopsisTAA1 clade (Tivendale et al., 2012) and similarly
[image:39.612.152.433.351.572.2]to TAA1, TAR1 and TAR2, clusters separately from the canonical garlic alliinase (Figure 2.1). The translated PsTAR1 protein shares greatest homology with TAA1 from Arabidopsis (Table 2.8). Thealliinase C-terminal /aminotransferase class I and II domains are conserved in PsTAR1 as are important binding and catalytic amino acids (Figure S2.1) (Tao et al., 2008).
Figure 2.1. Inferred phylogenetic tree of the Arabidopsis and Pisum TAR family members. cDNA sequences and appellation from TAIR
(www.arabidopsis.org/index.jsp) and the pea RNA-seq gene atlas
Table 2.8. Similarity scores of the TAR proteins generated by ClustalW
(www.genome.jp). Arabidopsis sequences originate from TAIR and pea sequences from Genbank (ncbi.nlm.nih.gov) and the Pea Gene Atlas
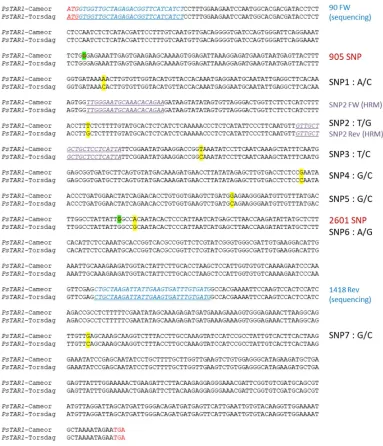
Several pea lines carrying mutations in the TAR1 gene were obtained from a TILLING programme. Two lines were selected because they had point mutations resulting in premature truncation in the coding region. The Pstar1-1 mutation (line 905) contains a G to A substitution early in the second exon and the Pstar1-2 mutation (line 2601)contains a G to A substitution halfway through the third exon (Figure 2.2). Both mutations convert the affected Trp residue (W45 and W200, respectively) to a stop codon. Truncation occurs prior to the important catalytic lysine residue necessary to the transamination of pyridoxal-5-phosphate-dependent aminotransferases (Figure 2.2) (Ferreira et al., 1993; Hennig et al., 1997). The
Pstar1-1 and Pstar1-2 mutations are therefore considered to be null alleles.
Figure 2.2. Schematic representation of PsTAR1 genomic sequence from the ATG start to the TGA stop. The grey boxes are the exons. The two pea mutant alleles are marked Pstar1-1 (L905, G203A) and Pstar1-2 (L2601, G1041A). The three
2.3.2. Inferred mutant proteins functionality
As the two Pstar1 mutant alleles harbor stop codons prior to the PLP binding site, very little protein functionality should to be retained by the truncated proteins. Inferred protein structures based on the Arabidopsis TAA1 crystal structure revealed little capacity for catalytic activity to occur (Figure 2.3). Indeed, based on the
Arabidopsis TAA1 protein NMR in solution with several ligands, predicted binding
[image:41.612.154.522.307.628.2]residues are missing in the pea mutant alleles, including the Alliinase C-Terminal (Figure S2.1).
Figure 2.3. 3D protein architectures of Arabidopsis TAA1, inferred PsTAR1 and Pstar1 mutants. The proteins are shown as ribbon diagrams. The well-characterised AtTAA1 is included for comparison. (structural models generated with
http://raptorx.uchicago.edu/StructurePrediction/).
AtTAA1
PsTAR1
2.3.3. Pstar1-1 and Pstar1-2 homozygous recessives are not
detected
The original accessions of line 905 (which carries the Pstar1-1 mutation) and line 2601 (Pstar1-2 mutation) had no visual phenotypes permitting discrimination between WT and mutant plants. Therefore, heterozygosity of these lines was considered a possibility. RFLP and sequencing protocols were developed and used to genotype the subsequent populations as this strategy had been previously
successful for Pstar2 (Tivendale et al., 2012) and Pstar3 (Davidson and Ross, unpublished). However, after crossing line 905 and line 2601 to the parental Caméor line, populations appeared to consist only of heterozygous and WT progeny. The two lines were backcrossed six times. At each sowing and genotyping efforts, WT and heterozygotes were consistently detected. The mutations were maintained in heterozygous plants. In excess of 300 plants originating from the crosses were genotyped for the purpose of this chapter. However, homozygous recessive plants were never detected.
Under the RFLP protocol used, in line 905, the mutant allele does not cleave (290 bp) and a single band of that weight is expected if a plant is homozygous recessive for the 905 mutation. The WT allele cleaves into two products (270 and 20 bp). The smaller of the two products (20 bp) is not generally visible on the gel and so, a single band at the 270 bp mark on the ladder is interpreted as being WT. Two bands being present on the gel (290 and 270 bp) suggests that both the WT and the mutant alleles are contained in the sample’s genome. This plant would be defined as being
Figure 2.4. Examples of typical RFLP electrophoresis gels of segregating samples from line 905. Lane 1 is defined as WT; lanes 2 to 7 are defined as ‘heterozygous’; lane 8 is a positive control and line 9 and 10 are negative controls. Note: lanes 5 to 7, the upper band (290 bp) is stronger than the lower (WT, 270 bp) band.
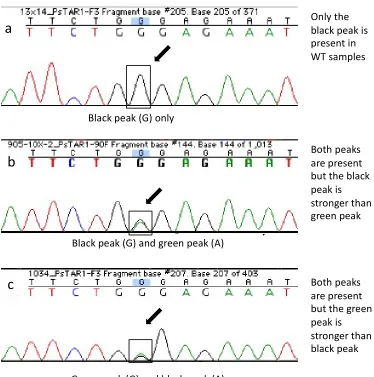
Figure 2.5. Examples of sequencing chromatograms of segregating samples from line 905 carrying the Pstar1-1 mutation. a) Only the WT (G, black peak) is present in samples defined as WT. b and c), chromatograms clearly demonstrating the WT (G, black peak) and mutant (A, green peak) alleles in the samples defined as heterozygotes. c) The mutant (A, green peak) is slightly stronger than the WT (G, black peak). No homozygous recessives were detected in line 905.
Green peak (G) and black peak (A)
c
Only the black peak is present in WT samples
Both peaks are present but the black peak is stronger than green peak
Both peaks are present but the green peak is stronger than black peak Black peak (G) and green peak (A)
Black peak (G) only
Similar patterns of band profiles were obtained in line 2601 (Figure 2.6). The WT allele is cleaved into two products (838 and 262 bp) and the mutant allele does not cleave (1100 bp). Again, in heterozygotes, the 2601 mutation band could appear of weaker strength to that of the WT band or appeared stronger (Figure 2.6, lane 7).
Figure 2.6. Examples of typical RFLP electrophoresis gels of segregating samples from line 2601. Lane 1, 4, 5 and 7 are defined as ‘heterozygous’; lane 2, 3 and 6 are defined as WT; lane 8 is a positive WT control and line 9 is a negative control. Note lane 7, the upper band (1100 bp) is stronger than the lower band (WT, 838 bp).
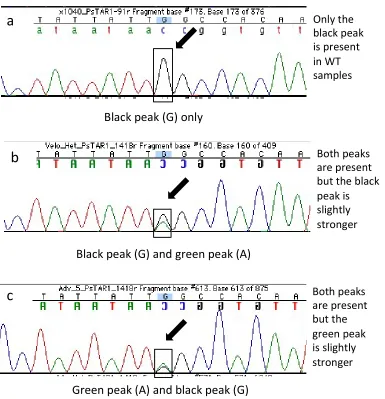
Similarly to sequencing results from line 905, no homozygous recessive plants were detected in sequenced samples from line 2601 (Figure 2.7). WT samples always had a clear black peak (G) while samples defined as heterozygous, had either a stronger WT allele black peak (G) and weaker green peak (A) or the opposite.
500
bp
Figure 2.7. Examples of sequencing chromatograms of segregating samples from line 2601 carrying the Pstar1-2 mutation. a) Only the WT (G, black peak) is present in samples defined as WT. b and c), chromatograms clearly demonstrating the WT (G, black peak) and mutant (A, green peak) alleles in the samples defined as heterozygotes. c) The mutant (A, green peak) is slightly stronger than the WT (G, black peak). No homozygous recessives were detected in line 2601.
a
Onlytheblackpeak ispresent
inWT
samples
c
Bothpeaksarepresent butthe
greenpeak
isslightly stronger
b
Black
peak
(G)
and
green
peak
(A)
Green
peak
(A)
and
black
peak
(G)
Black
peak
(G)
only
2.3.4. Abortion rates are not affected in the mutant lines
As homozygous recessive plants could not be detected in segregating populations, mutant seeds may abort early during development. To test this possibility, abortion rates in heterozygous and WT plants were quantified. To do so, the following were scored: the number of viable seeds (VS), the number of central abortions (CA) or the number of aborted seeds located between two viable seeds and the total number of possible seeds (PS); VS + CA = PS. In pea, seeds at either end of a pod are often aborted. These were not included in the scoring and calculations. In a segregating population originating from a heterozygote, a 1:2:1 ratio of WT, heterozygotes and homozygous recessive is expected. In other words, a quarter of the progeny is expected to be homozygous recessive. Following this line of logic, if fertilisation occurs between the two Pstar1 gametes and the seeds subsequently abort, an increase in abortion rate is expected in heterozygous plants when compared with WT plants. However, the percentage of aborted seeds did not differ between heterozygous and WT plants (Table 2.9). These results indicate that homozygous recessive seeds do not abort post fertilisation and that explanation 1 (above in the introduction) does not apply.
Table 2.9. Percentage of aborted seeds from WT plants and ‘heterozygous plants carrying the Pstar1 mutations in line 905 and line 2601
Defined by RFLP as carrying:
Viable seeds + central abortions
Number of abortions
Percentage of aborted seeds
905 WT 154 22 14.3%
905 ‘heterozygote’ 943 128 13.6%
2601 WT 134 45 33.6%
2.3.5. Pstar1-1 and Pstar1-2 recessive gametes are viable
To test the viability of the Pstar1 recessive male and female gametes, reciprocal crosses were made between the cultivar Torsdag (line 107) and 905 and 2601 plants carrying their respective Pstar1 alleles. Torsdag was selected as it carries LE, which controls internode length via the gibberellin pathway (Lester et al., 1997; Potts et al., 1982). The F1 progeny resulting from the crosses would be heterozygous for LE and be of tall stature, as opposed to the dwarfism of Caméor, line 905 and 2601. This was the case (data not presented) and the crosses were considered successful (n=10 for each cross; a total of 40 plants). In the F1 generation, a ratio of 1:1 WT to heterozygotes was obtained. As reciprocal crosses produced heterozygotes, both the female and the male recessive gametes are viable when crossed with dominant alleles originating from Torsdag (Table. 2.10). Recessive Pstar1 pollen could fertilise ovules from Torsdag and recessive Pstar1 ovules could be fertilised by Torsdag pollen. Therefore, the lack of homozygous recessive progeny in line 905 and 2601 cannot be explained by dysfunctional recessive gametes. In other words, explanation 2 does not apply.
Table 2.10. Punnet square demonstrating that heterozygotes are detected in the F1 generation originating from reciprocal crosses between line 905 or line 2601 and Torrsdag (line 107). Gametes highlighted in yellow originate from line 905 or line 2601.
Gametes originating from:
Line 905 and line 2601 PsTAR1 ♀ Pstar1 ♂ Torsdag
line 107
PsTAR1 ♀ Pstar1 ♂
PsTAR1 ♀ PsTAR1 ♂ PsTAR1 ♀
PsTAR1 ♂
Gametes originating from:
Line 905 and line 2601 Pstar1 ♀ PsTAR1 ♂ Torsdag
line 107
PsTAR1 ♀ PsTAR1 ♂
PsTAR1 ♀ PsTAR1 ♂ Pstar1 ♀
PsTAR1 ♂
Crossing pollenfrom 905or2601 thatcarries
Pstar1toWT ovules from107
CrossingWT
pollenfrom 107to905or 2601that carriesPstar1
The F2 seeds originating from heterozygotes carrying Pstar1-1 or Pstar1-2 were grown on to observe the inheritance of the mutant alleles (n=30 for each cross; 30x2x2 = 120 plants in total). Again, no mutants appeared to be present in the segregating population (Table 2.11). A ratio of 1:3 WT to heterozygotes was obtained. These results indicate that the interaction between the two recessive gametes may be impaired, preventing fertilisation to occur. The results also imply that WT pollen may rescue failed fertilisation attempts by defective recessive pollen, as previously reported in the Arabidopsis duo3-2 mutant (Kasahara et al., 2012) and amc mutant (Boisson-Dernier et al., 2008). In other words, explanation 3 might apply.
Table 2.11. Segregation of the PsTAR1 alleles from the heterozygous F2 generation originating from the F1 generation (above). a) Homozygous recessives are not detected. b) A ratio of 3:1 heterozygote to WT is obtained Alleles highlighted in yellow originate from line 905 or 2601.
F2
generation
PsTAR1
Pstar1
PsTAR1
PsTAR1
PsTAR1
Pstar1
PsTAR1
Pstar1
PsTAR1
Pstar1
Pstar1
Pstar1
F2
generation
PsTAR1
Pstar1
PsTAR1
PsTAR1
PsTAR1
Pstar1
PsTAR1
Pstar1
PsTAR1
Pstar1
PsTAR1
Pstar1
Homozygous recessives are not detected in the F2 generationA 3:1 ratio of heterozygous to WT is obtained