See discussions, stats, and author profiles for this publication at: https://www.researchgate.net/publication/330524863
Prefab timber panels - A study to investigate the potential of export trade
Conference Paper · January 2019
CITATIONS 0
READS 29
5 authors, including:
Some of the authors of this publication are also working on these related projects:
Fuel Poverty in New Zealand Homes View project
PRODUCTIVITY IN ROAD PAVEMENT MAINTENANCE & REHABILITATION PROJECTS: PERSPECTIVES OF NEW ZEALAND ROADING CONTRACTORS ON THE CONSTRAINTS AND IMPROVEMENT MEASURES View project
Eziaku Onyeizu Rasheed
Massey University
28PUBLICATIONS 60CITATIONS SEE PROFILE
Wajiha Shahzad
Massey University
7PUBLICATIONS 13CITATIONS SEE PROFILE
Temitope Egbelakin
Massey University
48PUBLICATIONS 146CITATIONS SEE PROFILE
Jasper Mbachu
Bond University
THE 5
THANNUAL NZBERS 2017
Advancing collaborative built environment
research and practice in New Zealand
Tuesday 17 - Wednesday 18 October 2017
TABLE OF CONTENTS
PAPER TITLE & AUTHORS PAGES
KEY FACTORS INFLUENCING THE PRODUCTIVITY PERFORMANCE OF CONSTRUCTION INDUSTRY: A LITERATURE REVIEW
NGUYEN, T.H.; MBACHU, J.; PARK, KS & SHAHZAD, W. 1-11
UNVEILING THE “BOTTLE BRICK TECHNOLOGY”
SANKARANARAYANAN, ADITHYA 12-22
DEVELOPMENT OF A MULTIPLE-CRITERIA DECISION ASSESSMENT FRAMEWORK FOR ADAPTIVE REUSE CASE STUDY BUILDING SELECTION
YAKUBU, ITOHAN ESTHER; EGBELAKIN, TEMITOPE; RASHEED, EZIAKU; MBACHU, JASPER & SHAHZAD, WAJIHA 23-37
SUSTAINABLE REFURBISHMENT FOR SCHOOL BUILDINGS IN NEW ZEALAND: A LITERATURE REVIEW
LE, T.H.A; PARK, K.S; RASHEED, E.O; MITHRARATNE, N & DOMINGO, N.D 38-48
PREDICTORS OF BUILDING DEVELOPMENT COST TREND: A NEW ZEALAND MULTI-LEVEL ANALYSIS
ZHAO, LINLIN; MBACHU, JASPER; DOMINGO, NILUKA & SHAHZAD, WAGIHA 49-59
EVALUATING THE PERCEPTION OF SMALL-TO-MEDIUM-SIZE-ENTERPRISES ON ELEVEN INFLUENTIAL FACTORS OF PREPAREDNESS DECISIONS
EGBELAKIN, TEMITOPE; POSHDAR, MANI & JAYASINGHE, THARINDU 60-68
PREFAB TIMBER PANELS - A STUDY TO INVESTIGATE THE POTENTIAL OF EXPORT TRADE
RAZEEN, MOHAMMED; SHAHZAD, WAJIHA; MBACHU, JASPER; EGBELAKIN, TEMITOPE & RASHEED, EZIAKU 69-76
A CRITICAL REVIEW OF THE ORGANISATIONAL WASTE IN THE CONSTRUCTION INDUSTRY
PURUSHOTHAMAN, MAHESH BABU; SEADON, JEFF & MOORE, DAVE 77-86
MAXIMIZING THE PRODUCTIVITY OF THE PRECAST CONCRETE PLANTS BY IMPLEMENTING THE LEAN MANAGEMENT SYSTEM
R, ANSARI; T, EGBELAKIN; J, MBACHU; E, RASHEED & W, SHAHZAD 87-97
CAPTURING CONSTRUCTION CLIENT VALUES
SADEGH ALIAKBARLOU 98-99
FOSTERING PRODUCTIVITY ACROSS NEW ZEALAND CONSTRUCTION INDUSTRY USING INNOVATION
SORAYA, S. ALIREZA; WILKINSON, SUZANNE J. & BABAEIAN JELODAR, MOSTAFA 100-106
BENEFITS AND ISSUES IN UPTAKE OF SMARTPHONE APPS IN NEW ZEALAND CONSTRUCTION INDUSTRY: WHAT MICRO AND SMALL BUSINESS PERCEIVE
LIU TONG; MBACHU JASPER & MATHRANI ANURADHA 107-114
ESTIMATE THE VENTILATION RATE IN TWO NEW ZEALAND PRIMARY CLASSROOMS
YU WANG; MIKAEL BOULIC; ROBYN PHIPPS; MANFRED PLAGMANN; CHRIS CUNNINGHAM; CHRIS THEOBALD;
PHILIPPA HOWDEN-CHAPMAN & MICHAEL BAKER 115-122
PROCUREMENT METHOD SELECTION IN CONSTRUCTION A CONCEPTUAL LITERATURE REVIEW
1
Introduction
1.1 Background of Study
The construction industry is considered to be one of the most important industries in the economy of every country and New Zealand is no exception. Construction is classified as one of the six individual largest sectors in New Zealand, accounting for 7.2% of total GDP according to the New Zealand Government (2014). Construction services is a large and diverse sub-sector, employing some 96,000 workers, 37% of whom are self-employed (New Zealand Government, 2014). Included are many occupations which typically are sub-contracted to both small and large building projects. These include electricians, plumbers, concreters, carpet layers, plasterers, joiners and so on according to Zuo, Wilkinson, and Seadon (2013).
Productivity plays an important role within the economy in general and within the construction industry in particular. There has been a vast amount of research into construction productivity over the last 50 years to productivity looking at a wide variety of issues (Loosemore, 2014). At the company level, improving productivity is fundamental to survival for firms because it means that they can meet their commitments to workers, shareholders, and governments while remaining
competitive (or even improve competitiveness) in the market (John & Van Dai, 2011). At the industry level, productivity improvement is essential for the health of the whole sector, as it is seen as the only valid way to pay for an increased standard of living (John & Van Dai, 2011). In the context of the construction industry, productivity improvement is particularly important because inadequate increases in productivity will mean sharper rises in construction costs, with adverse social implications and declining work for the industry (Ganesan, 1984). In New Zealand, this holds true because productivity growth in the construction sector may have significant effects on the affordability of housing in the country (Davis, 2007).
Much research is about construction productivity worldwide. However, the number of studies in the context of New Zealand is few, such as research by Carson and Abbott (2012), Chris and Malcolm (2012), Drotning, Howells, and Hazeldine (1973), Durdyev and Mbachu (2011), Saeed (2014), John and Van Dai (2011), Shahzad (2011), Shahzad (2016), Shahzad and Mbachu (2012), Will, Malcolm, and Chris (2015).
Many researchers have made observations about the productivity of the construction industry in New Zealand
ABSTRACT
The purpose of this paper is to identify factors influencing productivity and performance in the construction industry. The research will review the literature across 60 references from numerous countries to identify the factors affecting construction productivity generally. Then the researcher will use the mixed method approach involving qualitative and quantitative data in the stage 2 of the research to have in-depth analysis.
The findings in the research will provide insights into the key factors affecting productivity in the construction industry and other aspects of construction productivity such as: productivity definition, measurements to improve productivity performance.
Key words: Construction, contractors, New Zealand, performance, productivity
Key factors influencing the productivity performance of construction
industry: A literature review
1
Nguyen, T.H.;
2Mbachu, J.;
3Park, KS.;
4Shahzad, W.
1,2,3,4School of Engineering and Advanced Technology, Massey University, Auckland
and those observations have shown that the productivity trend in the context of New Zealand’s construction industry is low. The figure in the report “Productivity by the Numbers: The New Zealand Experience” (Conway & Meehan, 2013) shows that productivity in the context of the construction industry in New Zealand remains flat and has sometimes decreased during the last 20 years from the 1990s until now, with the growth rate from -0.4% to just 0.9%. John & Van Dai (2011) also hold the same view, which is that productivity in the construction industry in New Zealand has tended to be flat, while neighbour Australia is experiencing a strong productivity performance during the same period (Hughes & Thorpe, 2014). Furthermore, John & Van Dai (2011) stated in their research that productivity studies into New Zealand construction have either highlighted “failure” to increase productivity or have exhorted the industry to “improve” its “poor performance” (Black, Guy, & McLellan, 2003).
Also, the number of research publications regarding factors affecting construction productivity is numerous. However, research on the factors affecting construction productivity from the perspective of contractors is sparse. Therefore, research related to productivity performance of contractors in the construction industry requires more study in the future.
The fact is that contractors are key role players contributing to the productivity and performance of the construction industry. It is clear that the success or failure of construction projects depends largely on the productivity performance of contractors because they are responsible for important activities in the construction process (de Araújo, Alencar, & Mota, 2016).
1.2 Research Aims and Objectives
The specific objectives of this research are:
a) To explore the key factors constraining productivity and performance of the construction industry.
b) To develop a hypothesis causal relationship of the identified factors
c) To explore measurement of construction productivity improvement
1.3 Research Methods
In this research, the author will review the secondary data of around sixty references including journals, reports,
theses in order to identify the factors affecting the construction productivity. This step is essential for collecting data in next step to provide in deep knowledge about the contractors’ productivity performance in the context of New Zealand.
2
Literature Review
2.1 Productivity Definition
There are many ways to define the term “Productivity”. The common definition of productivity is by Organisation of Economic Cooperation and Development (OECD) (2001) as a ratio of a volume measure of output to a volume measure of input use. Even though there is not disagreement on this definition, there is neither a unique purpose for, nor a single definition of, productivity.
A common mathematical expression for productivity is the output divided by the input (Liou & Borcherding, 1986). The concept by OCED is a relative concept which can be considered in terms of capital, investment, and labour, or other suitable inputs and outputs (Hughes & Thorpe, 2014). This concept has been cited in many articles as the common definition of the term “Productivity”.
This concept has been formed as a common equation as below:
𝑃𝑃𝑃𝑃𝑃𝑃𝑃𝑃𝑃𝑃𝑃𝑃𝑃𝑃𝑃𝑃𝑃𝑃𝑃𝑃𝑃𝑃𝑃𝑃= 𝑂𝑂𝑃𝑃𝑃𝑃𝑂𝑂𝑃𝑃𝑃𝑃
𝐿𝐿𝐿𝐿𝐿𝐿𝑃𝑃𝑃𝑃𝑃𝑃+𝐸𝐸𝐸𝐸𝑃𝑃𝑃𝑃𝑂𝑂𝐸𝐸𝐸𝐸𝐸𝐸𝑃𝑃+𝑀𝑀𝐿𝐿𝑃𝑃𝐸𝐸𝑃𝑃𝑃𝑃𝐿𝐿𝑀𝑀
Equation 1: A Common Equation of Productivity (Shamil George, 2016)
However, the different analytical standpoints will comprise different meanings of productivity and, generally, the definition of productivity depends on the objectives of measurement, availability of data, and the preferences of the researchers (Chau & Walker, 1988).
2.2 Measuring Construction Productivity
Productivity, especially in the construction industry, has always been very difficult to measure and control according to John and Van Dai (2011). It is because the construction tasks are generally not simple, they are inter-dependent and are hard to quantify.
are labour productivity and capital productivity as single-factor productivity measurements (Black et al., 2003), Chia, Skitmore, Runeson, and Bridge (2012).
In the case of the New Zealand construction industry, examples of partial productivity indexes include those by Davis (2007), Janssen and McLoughlin (2008), who all estimated New Zealand labour productivity figures. In terms of total factor productivity indexes, there have been a number of main works undertaken on the New Zealand construction industry as part of economy-wide productivity estimates such as Black, Guy & McLellan (2003), Chris and Malcolm (2012).
Therefore, the following parts in the literature review will present those measurements.
Labour productivity
Labour productivity is a partial productivity measure and
reflects the combined influence of a host of factors
(Organisation for Economic Co-operation and Development, 2001). It is typically measured as output per person employed or per hour worked (Chia et al., 2012). Labour productivity is the most common measurement of productivity used in the construction industry (Chau & Walker, 1988). It offers a dynamic measure of economic growth, competitiveness and living standards within the economy, which can help explain the principal economic foundations that are essential for both economic growth and social development (OECD, 2008). That measurement can be illustrated by the following equation:
Labour productivity = Volume measure of output/Measure of input use
Equation 2: A Common Equation of Labour Productivity
The volume measure of output can be the gross domestic product (GDP) and gross value added (GVA). The measure of input can use the total number of hours worked of all persons employed of total employment (OECD, 2008). Single-factor productivity or labour productivity measures have been adopted as indicators for key government policy objectives, and as can be seen in the formula which is easy to measure and control (Crawford & Vogl, 2006).
Capital productivity
Capital productivity is usually defined as the output of, or return on, capital invested (Chia et al., 2012). The basic
measures of outputs are gross output and value-added output.
Total factor productivity
Total factor productivity (TFP) is a significant factor used
to measure the development potential and competitiveness of a certain production unit (Xueqing, Yuan, Bingsheng, Yinghua, & Hui, 2013). Whilst the labour factor has been considered as the single factor input for measuring the productivity, the total factor (multi-factor) productivity measures take into account the impact of all inputs on output (Crawford & Vogl, 2006).
Economists tend to prefer estimating multi-factor production functions because the multi-factor method provides more in-depth analysis on productivity. However, the data and measurement requirements for such as approach are considerably more demanding and cannot be sure that approach will provide exact results (Crawford & Vogl, 2006).
Some agencies use the economic model in terms of dollars, because dollars are the only measure common to both inputs and outputs (EL-Gohary; & Aziz, 2014). The equation below shows the total factor productivity (TFP), which represents this type of model:
𝑇𝑇𝑃𝑃𝑇𝑇𝐿𝐿𝐿𝐿𝐿𝐿𝑃𝑃𝑃𝑃𝑃𝑃+𝑀𝑀𝐿𝐿𝑃𝑃𝐸𝐸𝑃𝑃𝑃𝑃𝐿𝐿𝑀𝑀𝑀𝑀𝑇𝑇𝑃𝑃𝑃𝑃𝐿𝐿𝑀𝑀+𝐸𝐸𝐸𝐸𝑃𝑃𝑃𝑃𝑂𝑂𝐸𝐸𝐸𝐸𝐸𝐸𝑃𝑃𝑂𝑂𝑃𝑃𝑃𝑃𝑂𝑂𝑃𝑃𝑃𝑃+𝐸𝐸𝐸𝐸𝐸𝐸𝑃𝑃𝐸𝐸𝑃𝑃+𝐶𝐶𝐿𝐿𝑂𝑂𝑃𝑃𝑃𝑃𝐿𝐿𝑀𝑀
Equation 3: A Common Equation of Labour Productivity
Where;
TPF = the ratio of dollars of output to dollars of input
Those measurement methods above are included in the economic perspectives of construction productivity. However, in terms of the strategic perspectives, Shahzad (2016) has improved the productivity measurement in her study by using the measurement of time saving and cost saving.
2.3 Factors Affecting Construction Productivity
Mwakali, & Hansson, 2007; Alwi, 2003; Chris & Malcolm, 2012; Enshassi, Mustafa, Mohamed, & Mayer, 2007; P. Ghoddousi & M. R. Hosseini, 2012; Mahamid, 2016; Makulsawatudom, Emsley, & Sinthawanarong, 2004). It is said that if all factors affecting productivity have been identified, then productivity can be forecasted effectively (Lema, 1995).
Besides the factors influencing construction productivity, many other researchers focus on the factors influencing labour productivity (Dai & Goodrum, 2012; El-Gohary & Aziz, 2014; Enshassi et al., 2007; Abdulaziz M. Jarkas, 2016; A. M. Jarkas, Al Balushi, & Raveendranath, 2015; Abdulaziz M. Jarkas & Bitar, 2014; John & Van Dai, 2011; Kadir, Lee, Jaafar, Sapuan, & Ali, 2005; Serdar & Jasper, 2011a).
Serdar & Jasper (2011b) provided a robust identification of constraints regarding construction productivity by categorizing them into external constraints and internal constraints. Those constraints are included in Figure 1 below:
Figure 1: External and internal constraints of construction productivity [Source: Durdyev (2011)]
Hughes and Thorpe (2014) found the enabling factors in construction productivity in Australia through their review. The authors used the Likert scale and structured questionnaire to identify 47 factors affecting construction productivity in Queensland, Australia. Then, the 15 highest ranking factors have been discussed; those are:
Rework, Incompetent supervisor, Incomplete drawings, Work overload, Lack of materials, Poor communications, Poor site conditions and poor site layouts, Overcrowding, Inspection delay/Absenteeism/Work turnover/Accident, Tools and equipment breakdown, and Lack of tools and equipment. Among those factors, the two factors that have the most effect on construction productivity in Queensland are Rework and Incompetent supervisors.
Similarly, Bierman, Marnewick, and Pretorius (2016) also identified factors affecting construction productivity in South Africa. There are 51 identified factors; the authors categorized them into six groups: Management, Consultant, Labour, Site, Weather, and Tools/Equipment.
And each group has at least five specific factors. Then, in their review, the authors ranked the factors by Impact, Frequency and Modified. The results are as below:
Figure 2: Comparison between the three difference Rii values for six groups of factors [Source: Bierman et al. (2016)]
approximation of added time due to the various factors.
Figure 3: Approximation of added time due to factors [Source: P. Ghoddousi and M. R. Hosseini (2012)]
Makulsawatudom et al. (2004) conducted a study to identify the critical factors influencing construction productivity in Thailand. They concluded that the top critical factors include: lack of materials, incomplete drawings, incompetent supervisors, lack of tools and equipment, absenteeism, poor communication, instruction time, poor site layout, inspection delay, and rework.
Similar to previous researchers, Olomolaiye et al. (1998) cited in Mahamid (2013) concluded that factors affecting construction productivity are not similar between countries and also between projects and, even for the same project, they may depend on circumstances. The researchers divided the factors affecting construction productivity into two different categories: internal factors and external factors. External factors included the nature of the industry, construction client knowledge of construction procedure, weather, and the level of economic development. Internal factors included management, technology, labour, and labour unions.
Therefore, in conclusion, from regions to regions, countries to countries, the factors affecting construction productivity have been identified and classified in some common ways such as internal factors and external factors, or by groups. Generally, the range of the total number of factors was from around 30 factors to 50 factors. The most common groups of factors affecting construction productivity are:
1. Materials/Tools/Equipment 2. Management
3. Consultants 4. Labour 5. Sites 6. Reworks
7. Construction methods/Technology 8. Weather.
2.3.1 Materials/Tools/Equipment
Lack of materials, tools and equipment is the significant factor constraining construction productivity. This group has been studied by many researcher such as P. Ghoddousi and M. R. Hosseini (2012), Makulsawatudom et al. (2004), Hughes and Thorpe (2014), Mahamid (2016), Lim and Alum (1995), Enshassi et al. (2007), Hwang, Zhu, and Ming (2016), and Alinaitwe et al. (2007), Ghoddouse and Mohammad (2012) identified four factors in this group: lack of proper tools and equipment on-site, the shortage of materials, materials have not arrived onsite yet, and tools/equipment breakdown due to aging or poor maintenance. Loosemore (2014) holds the same points of view to classify this group of materials/tools/equipment factors. However, the research is divided into two sub-groups as lack of materials and tools/equipment breakdown/lack of tools and equipment. Therefore, it can be seen that materials/tools/equipment are the significant factors impacting construction productivity. This group consists of many other secondary factors because the construction materials, tools and equipment are very important to the construction work. Lack of materials, tools and equipment could lead to time and cost delays, resulting in time and cost overruns. Consequently, Mahamid (2013) found that lack of materials and equipment is one of the most important factors, accounting for more than 70 percent of the importance index in the research.
The list of sub-factors in the category of materials/tools/equipment is:
• Lack of proper tools and equipment on-site • Shortage of materials
• Materials have not arrived on-site yet • Tools and equipment breakdown
2.3.2 Management
Ghoddouse and Mohammad (2012) in Iran including lack of management skills such as no construction planning. Also, the management skills for safety planning are considered as a factor in the management group. Similarly, Alghonamy (2015) stated a number of sub-factors such as poor planning and scheduling, poor site management, poor resource management, poor communications and slow decision-making. Especially, the factor of management has been studied by Bierman et al. (2016) in South Africa showing that there are about 23 sub-factors of management affecting productivity performance in the construction industry. Those same factors have been mentioned in Hwang et al. (2016) in Singapore. However, the author contributes some additional sub-factors related to the management groups: supervision, and competency of the project manager. In the research, Hwang et al. (2016) classified the factors affecting the construction productivity into groups and ranked those groups. The management factors account for an average of around 4 (the mean by ranking), which shows that the significance of management groups is equivalent to projects factors, manpower factors and technical factors. The fact is that if a project is affected by poor management skills as mentioned, it definitely faces many set-backs or failures. The list of sub-factors in this research will be indicated as below:
• Lack of construction planning
• Lack of management of safety planning • Poor planning and scheduling
• Poor site management • Poor resource management • Poor communications • Slow decision-making.
2.3.3 Consultants
The reasons related to Consultants have been analysed and there are some sub-factors under the category of group of consultants impacting on construction productivity. The studies from various countries such as: Bierman et al. (2016), Makulsawatudom et al. (2004), Mahamid (2016), Hughes and Thorpe (2014), and Alinaitwe et al. (2007). Bierman et al. (2016) have been analysed and list a number of sub-factors in this group in order to illustrate that the factor caused by consultants also has been considered as a significant factor affecting construction productivity in South Africa. The list of sub-factors is consistent with the previous studies. It includes:
• Late issue of drawings to contractors • Delayed reply to Request for Proposal
• Late issue of specification/information to contractors
• Delayed inspection by consultant • Complexity of design
• Incompetent drawings or design changes.
The above sub-factors can lead to time delays and cost overruns. Therefore, construction productivity is certain to be affected absolutely.
2.3.4 Labour
This group of factors has been mentioned in most studies related to construction productivity because labour plays such an important role in the construction context. Without labour factors construction projects cannot be conducted and completed. Therefore, the sub-factors included in the group of factors related to labour have been listed in many countries around the world by many researchers. These include Mahamid (2016), Jaffe, Le, and Chappell (2016), Hwang et al. (2016), Alghonamy (2015), Jarkas and Bitar (2014), Loosemore (2014), Hughes and Thorpe (2014), Zuo et al. (2013), El-Gohary and Aziz (2014), (Zuo et al., 2013), Alinaitwe et al. (2007), and Makulsawatudom et al. (2004).
According to Hwang et al. (2016), manpower refer to factors affecting labour in all construction projects. It is indicated that workers with a perception of higher productivity could deliver a better production output; workers with experience and great skills affect a project’s productivity.
The list of sub-factors related in the grouping of labour and included in the research of Hwang et al. (2016) is consistent with previous studies such as those of Bierman et al. (2016), Abdulaziz M. Jarkas and Bitar (2014), and Makulsawatudom et al. (2004). It comprises:
• Motivation of workers • Worker skill level • Absenteeism • Labour turnover • Workers’ experience
• Difficulty in recruitment of workers • Level of education of the worker
The factors pertaining to project site have been indicated as having high impact on construction productivity. As with the other categories, this category has been analysed in many studies such as those by Bierman et al. (2016), Hwang et al. (2016), Alghonamy (2015), Hughes and Thorpe (2014), Makulsawatudom et al. (2004), Alinaitwe et al. (2007).
The list of factors has been analysed as indicated below:
• Poor site layout • Poor site condition
• Site condition after inclement weather. • Site congestion
• Geographical location of site.
2.3.6 Reworks/Poor Work done
According to Hughes and Thorpe (2014), reworks on construction projects can be considered as unnecessary effort of redoing a process or activity. In the construction context, the causes leading to the problem of reworks are errors, omissions, failures, changes, poor communication, and poor coordination. The authors estimated that the effect of reworks on the performance and productivity of construction projects could be the addition of around 10 percent to total project cost. According to the literature summarized by Whiteside (2006), the factor of reworks is mostly unnecessary and is avoidable.
On the other hand, the previous studies by Patrick (2000) and Love and Heng (2000) concluded that the costs caused by reworks can be quite high compared with the cost of the project. It can surge up to 25 percent of the actual construction cost. This statement is consistent with other authors such as Makulsawatudom et al. (2004), and Alinaitwe et al. (2007).
2.3.7 Weather
Ghoddouse and Mohammad (2012) conducted their research considering adverse weather and thermal conditions as one particular factor. This factor is ranked as the sixth most important ground among the seven groups and the ninth declining factor amongst the factors negatively affecting productivity. Generally, construction projects take place in an open environment, thus environmental conditions may impact upon the condition of the jobsite as well as upon the workers.
Jarkas and Bitar (2014) also hold the same opinion on the external factor affecting construction productivity. The authors pointed out that productivity losses due to snow and cold temperatures were 41% and 32% respectively. In Singapore, a heavy downpour during the monsoon season and interference from wet weather can affect construction productivity (Lim & Alum, 1995). Although it was not the top factor affecting construction productivity, it is known that in some countries with bad weather conditions, that factor can cause much damage and has significant negative impacts.
2.3.8 Construction Methods/Technology
Many researchers have analysed factors related to construction methods and technology to know their impact on construction productivity. Karimian et al. (2016), Jarkas and Bitar (2014), and Hwang et al. (2016), indicated that the construction methods or technology also have particular effects on productivity. It is clear that incomplete or unclear technical specifications will require continuous requests for clarification, inevitably leading to interruptions or disruptions in construction progress Jarkas and Bitar (2014). According to Goodrum and Haas (2002), changes in technology contribute to an increase in productivity. And Karimian et al. (2016) stated that technology can significantly influence productivity and performance in road maintenance projects.
The list of factors within this category has been indicated in the research of Jarkas and Bitar (2014), Arashpour and Arashpour (2015) and Ghoddouse and Mohammad (2012) as below:
• Utilizing traditional construction methods instead of modern technology
• Operatives do not possess the skills and experience necessary to perform the tasks • The company is executing these types of projects
for the first time
• Standardisation and specifications
• Changes in technology (Dai & Goodrum, 2012) • Poor construction methods (Alinaitwe et al.,
2007)
2.4 Summary of Literature Review
these broad categories have been identified from various countries all over the world. The review of existing literature shows that ‘materials/tools/equipment’ and ‘labour’ are the two most significant categories, as they have been mentioned and identified in all previous studies as resulting as critical factors for construction projects.
Conclusion
This research explored the key factors affecting the productivity performance of the construction industry, then 37 sub-factors within 8 groups have been identified from country to country, project to project. Furthermore, this research also reviewed the measures to improve the construction productivity from previous researches, they are labor productivity, capital productivity and total factor productivity. Each project, each country has the own method to measure the construction productivity in the world.
The limitation of this research is only state the factors affecting productivity performance and productivity measurement as a review article. Therefore, the recommendation for further study is factors specifically affecting the contractors’ productivity and the causal relationship between those factors will be completed in the next stage of the research by pilot interviews and questionnaire survey sending to various participants in New Zealand.
References
Alghonamy, A. (2015). Factors affecting construction productivity in Saudi Arabia. International Journal of Applied Engineering Research, 10(6), 14891-14904.
Alinaitwe, H. M., Mwakali, J. A., & Hansson, B. (2007). Factors affecting the productivity of building craftsmen - studies of Uganda. Journal of Civil Engineering and Management, 13(3), 169-176. doi: 10.1080/13923730.2007.9636434
Alwi, S. (2003). Factors influencing construction productivity in the Indonsesian context.
Arashpour, M., & Arashpour, M. (2015). Analysis of workflow variability and its impacts on productivity and performance in construction of multistory buildings. Journal of Management in
Engineering(6), 4015006. doi: 10.1061/(ASCE)ME.1943-5479.0000363
Bierman, M., Marnewick, A., & Pretorius, J.-H. (2016). Productivity management in the South African civil construction industry - factors affecting construction productivity. Journal of the South African Institution of Civil Engineering(3), 37. doi: 10.17159/2309-8775/2016/v58n3a5
Black, M., Guy, M., & McLellan, N. (2003). Productivity in New Zealand 1988 to 2002. New Zealand Economic Papers(1), 119.
Carson, C., & Abbott, M. (2012). A review of productivity analysis of the New Zealand construction industry. Australasian Journal of Construction Economics and Building(3), 1.
Chau, K. W., & Walker, A. (1988). The measurement of total factor productivity of the Hong Kong construction industry. Construction Management & Economics, 6(3), 209.
Chia, F. C., Skitmore, M., Runeson, G., & Bridge, A. (2012). An analysis of construction productivity in Malaysia. Construction Management & Economics, 30(12), 1055-1069. doi: 10.1080/01446193.2012.711910
Chris, C., & Malcolm, A. (2012). A review of productivity analysis of the New Zealand construction industry. Australasian Journal of Construction Economics and Building, Vol 12, Iss 3, Pp 1-15 (2012)(3), 1. doi: 10.5130/ajceb.v12i3.2584 Conway, P., & Meehan, L. (2013). Productivity by the
numbers: The New Zealand experience New Zealand Productivity Commission.
Crawford, P., & Vogl, B. (2006). Measuring productivity in the construction industry. Building Research & Information, 34(3), 208-219. doi: 10.1080/09613210600590041
contractors. Engineering, Construction and Architectural Management(4), 350. doi: 10.1108/eb021088
Dai, J., & Goodrum, P. M. (2012). Generational differences on craft workers' perceptions of the factors affecting labour productivity. Canadian Journal of Civil Engineering, 39(9), 1018-1026. doi: 10.1139/l2012-053
Davis, N. (2007). Construction sector productivity: Martin Jenkins.
de Araújo, M. C. B., Alencar, L. H., & Mota, C. M. M. (2016). Model for contractor performance evaluation in construction industry. Paper presented at the Systems, Man, and Cybernetics (SMC), 2016 IEEE International Conference on.
Drotning, J. E., Howells, J. M., & Hazeldine, T. (1973). Productivity bargaining in New Zealand: a case study. Industrial Relations Journal, 4(1), 21-29. Durdyev, S. (2011). Pareto analysis of on-site productivity
constraints and improvement techniques in New Zealand building industry, Massey University at Albany, New Zealand.
Durdyev, S., & Mbachu, J. (2011). On-Site Labour Productivity of New Zealand Construction Industry: Key Constraints and Improvement Measures. Australasian Journal of Construction Economics and Building, The(3), 18.
El-Gohary, K. M., & Aziz, R. F. (2014). Factors Influencing Construction Labor Productivity in Egypt. Journal of Management in Engineering, 30(1), 1-9. EL-Gohary;, K. M., & Aziz, R. G. (2014). Factors Influencing
Construction Labor Productivity in Egypt. Journal of Management in Engineering, 30(1), 1-9. doi: 10.1061/(ASCE)ME.1943-5479.0000168
Enshassi, A., Mustafa, Z. A., Mohamed, S., & Mayer, P. E. (2007). Factors affecting labour productivity in building projects in the Gaza strip. Journal of Civil Engineering and Management, 13(4), 245-254. Ganesan, S. (1984). Construction productivity. Habitat
International, 8(3-4), 29-42.
Ghoddousi, P., & Hosseini, M. R. (2012). A survey of the factors affecting the productivity of construction projects in Iran. Technological & Economic Development of Economy, 18(1), 99-116. doi: 10.3846/20294913.2012.661203
Ghoddousi, P., & Hosseini, M. R. (2012). A survey of the factors affecting the productivity of construction projects in Iran. Technological and Economic Development of Economy, 18(1), 99-116. doi: 10.3846/20294913.2012.661203
Goodrum, P. M., & Haas, C. T. (2002). Partial factor productivity and equipment technology change at activity level in US construction industry. Journal of Construction Engineering and Management, 128(6), 463-472.
Hughes, R., & Thorpe, D. (2014). A review of enabling factors in construction industry productivity in an Australian environment. Construction Innovation(2), 210. doi: 10.1108/CI-03-2013-0016
Hwang, B.-G., Zhu, L., & Ming, J. T. T. (2016). Factors affecting productivity in green building construction projects: The case of Singapore. Journal of Management in Engineering, 33(3), 04016052.
Jaffe, A. B., Le, T. V. T., & Chappell, N. (2016). Productivity distribution and drivers of productivity growth in the construction industry: Wellington, New Zealand : Motu Economic and Public Policy Research, 2016.
Janssen, J., & McLoughlin, S. (2008). New Zealand's productivity performance: New Zealand Treasury. Jarkas, A. M. (2016). Learning effect on labour productivity of repetitive concrete masonry blockwork. International Journal of Productivity & Performance Management, 65(8), 1075-1090. doi: 10.1108/IJPPM-08-2015-0119
(2015). Determinants of construction labour productivity in Oman. International Journal of Construction Management, 15(4), 332-344. doi: 10.1080/15623599.2015.1094849
Jarkas, A. M., & Bitar, C. G. (2014). Factors affecting construction labor productivity in Kuwait. Journal of Construction Engineering and Management, 138(7), 811-820. doi: 10.1061/(ASCE)CO.1943-7862.0000501
John, E. T., & Van Dai, T. (2011). Labour Productivity in the New Zealand Construction Industry: A Thorough Investigation. Australasian Journal of Construction Economics and Building, Vol 11, Iss 1, Pp 41-60 (2011)(1), 41.
Kadir, M. R. A., Lee, W. P., Jaafar, M. S., Sapuan, S. M., & Ali, A. A. A. (2005). Factors affecting construction labour productivity for Malaysian residential projects. Structural Survey(1), 42. doi: 10.1108/02630800510586907
Karimian, S., Mbachu, J., & Egbelakin, T. (2016). Resilient Productivity-Performance Constraints in New Zealand Road Maintenance and Rehabilitation Projects.
Lema, N. (1995). Construction of labour productivity modeling. University of Dar elsalaam, 1. Lim, E. C., & Alum, J. (1995). Construction productivity:
Issues encountered by contractors in Singapore. International Journal of Project Management, 13(1), 51-58. doi: 10.1016/0263-7863(95)95704-H
Liou, F.-S., & Borcherding, J. D. (1986). Work sampling can predict unit rate productivity. Journal of Construction Engineering and Management, 112(1), 90-103.
Loosemore, M. (2014). Improving construction productivity: a subcontractor's perspective. Engineering, Construction and Architectural Management(3), 245. doi: 10.1108/ECAM-05-2013-0043
Love, P. E. D., & Heng, L. (2000). Quantifying the causes and costs of rework in construction. Construction Management & Economics, 18(4), 479-490. doi: 10.1080/01446190050024897
Mahamid, I. (2013). Contractors perspective toward factors affecting labor productivity in building construction. Engineering, Construction and Architectural Management(5), 446. doi: 10.1108/ECAM-08-2011-0074
Mahamid, I. (2016). Factors contributing to poor performance in construction projects: studies of Saudi Arabia. Australian Journal of Multi-Disciplinary Engineering, 12(1), 27-38. doi: 10.1080/14488388.2016.1243034
Makulsawatudom, A., Emsley, M., & Sinthawanarong, K. (2004). Critical factors influencing construction productivity in Thailand. The journal of KMITNB, 14(3), 1-6.
OECD. (2001). Measuring Productivity - OECD Manual Measurement of Aggregate and Industry-level Productivity Growth. [electronic resource]: OECD Publications Centre.
OECD. (2008). Labour productivity indicators. Retrieved from http://www.oecd.org/std/labour-stats/41354425.pdf
Patrick, B., Andrew, G., Mark, H., Darryl, S., & Cyril, T. (2000). Quality failure costs in civil engineering projects. International Journal of Quality & Reliability Management, 17(4/5), 479-492. Saeed, H. K. (2014). Improving productivity in road
pavement maintenance and rehabilitation in New Zealand, Massey University, Albany, New Zealand.
Serdar, D., & Jasper, M. (2011a). On-site labour productivity of New Zealand construction industry: Key constraints and improvement measures. Australasian Journal of Construction Economics and Building, 11(3), 18-33.
Productivity of New Zealand Construction Industry: Key Constraints and Improvement Measures. Construction Economics and Building, Vol 11, Iss 3, Pp 18-33 (2011)(3), 18. doi: 10.5130/AJCEB.v11i3.2120
Shahzad, W. M. (2011). Offsite manufacturing as a means of improving productivity in New Zealand construction industry : key barriers to adoption and improvement measures , Massey University, Albany, New Zealand: 2011.
Shahzad, W. M. (2016). Comparative analysis of the productivity levels achieved through the use of panelised prefabrication technology with those of traditional building system, Massey University, Albany, New Zealand.
Shahzad, W. M., & Mbachu, J. (2012). Productivity enhancement of construction industry using prefabrication : impact levels of the underlying constraints and improvement measures: Saarbrücken, Germany : LAP LAMBERT Academic Pub., c2012.
Shamil George, N. (2016). Factors influencing labor productivity on construction sites : A state-of-the-art literature review and a survey. International Journal of Productivity and Performance Management(3), 401. doi: 10.1108/IJPPM-03-2015-0045
Whiteside, J. D. (2006). Construction Productivity. AACE International Transactions, 8.1-8.8.
Will, C., Malcolm, A., & Chris, C. (2015). Factors Promoting Innovation and Efficiency in the Construction Industry: A Comparative Study of New Zealand and Australia. Construction Economics and Building, Vol 15, Iss 2, Pp 63-80 (2015)(2), 63. doi: 10.5130/AJCEB.v15i2.4386
Xueqing, W., Yuan, C., Bingsheng, L., Yinghua, S., & Hui, S. (2013). A total factor productivity measure for the construction industry and analysis of its spatial difference: a case study in China.
Construction Management & Economics, 31(10),
1059-1071. doi: 10.1080/01446193.2013.826371
1
Introduction
1.1 Statement of Research
The use of plastic has become inevitable in our daily lives due to their excellent properties i.e. performance, shatter-resistance, value, durability, ease of usage etc. Besides their useful applications, they have also become a threat to the society due their non-biodegradability - especially the post-consumer PET (Poly Ethylene Terephthalate) Bottles i.e. drinking water and beverage bottles.
For this study, practical Civil Laboratory experiments were done to find out if post-consumer PET plastics could become a substitute for clay bricks and if architecture could still provide effective functionality and aesthetics through them.
1.2 Aims of the Study
• To understand the physical and chemical properties of PET bottles and judge whether they are viable as a building construction material.
• To analyze the quality of space and thermal environment that a PET plastic bottle environment will provide to the user.
1.3 Objectives of the Study
• Providing COST EFFECTIVE HOMES to the homeless people/Low Income groups in the country through Bottle Brick Technology.
• To suggest effective means OF REDUCING GROWING LANDFILLS.
1.4 Scope of the Study
• This research is not limited to any specific building typology.
• This study deals with the documentation and analysis of existing techniques used for construction using PET bottles.
1.5 Limitations of the Study
• This dissertation is strictly limited only to PET Plastic bottles and not to any other form of plastic.
• The project circles mainly around reuse (and not recycling) of PET Bottle waste.
1.6 Methodology of the Study
Phase 1: Structure:
• A brief overview of Plastics and their classification • PET Bottles and their classification
• Physical and chemical Properties of PET Bottles
Tools used: Data Collection sources – Internet articles,
International Journals, Brochures, Interaction with Industry Experts etc.
Phase 2:Structure:
• Live Case Study – Bamboo House India, Hyderabad • Guidelines for PET Bottle Construction
Tools used: Literature and Live Case Studies
Phase 3: Structure:
• Structural Details and compressive strength tests of PET bottles through Laboratory Tests
ABSTRACT
This research focuses on the reuse of Post-Consumer PET Bottles or Eco-bricks in building construction. These are formed by packaging filler agents like sand, quarry dust, plastic trash, etc. within Polyethylene Terephthalate (PET) Bottles. Live experiments were done for the purpose of this particular research in the Civil Materials Testing Lab to evaluate the compressive strength and water absorption of 5 different Eco-Brick specimens with different types of mortars and in-fillers. The results of the experimentation helped in understanding the structural, aesthetic and functional aspects of PET Bottle Construction. The future prospects of this alternative technology have also been presented.
Unveiling the “Bottle Brick Technology”
1
Sankaranarayanan, Adithya
1Construction Management Programme, Auckland University of Technology, Auckland
• Laboratory tests to ascertain Water absorption levels with different filler agents and different mortar types
Tools used: Live experimentation – Tests in Structural
Lab / Materials Lab, IS Code books, Interaction with Professors of Civil Engineering Department etc.
Phase 4: Structure:
• Thermal Comfort Analysis of PET Bottle brick buildings
• Analysis and conclusions through SWOT Analysis
Tools used: Ecotect Simulation Software, SWOT Analysis
Chart etc.
2
Post-Consumer PET Bottle Construction
2.1 Classification of Plastics
The general classification of Plastics is shown below. The PET Bottles come under the category of Polyethylene.
Figure 1: Classification of Plastics and sic Parts of a PET Bottle.
2.2 Composition of PET
Modified ethylene Glycol + Purified Terephthalic Acid = Polyethylene Terephthalate (PET)
• The properties of post-consumer PET bottles that favor the sellers are: Strength, Thermal stability, Transparency
• The properties that attract the buyers are: Inexpensive, Lightweight, Resalable, Shatter-resistant, Recyclable
2.3 PET Bottles – Common Sizes
Figure 2: Specifications of different sizes of bottles.
3
Bottle Brick/Eco-brick Construction
3.1 History of Bottle brick Technology
Figure 3: Idea of PET Bottle construction getting around the world. (Keiren 2016)
3.2 Live Study – Bamboo House India, Hyderabad, India
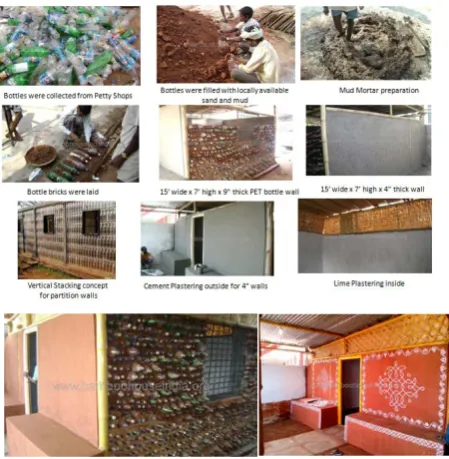
[image:16.595.311.536.314.544.2]Bamboo House India was constructed by Prasanth Lingam and Aruna Lingam at Hyderabad, India in 2008.
Figure 4: Construction of PET Bottle Workshop, Bamboo House India, Hyderabad. (Prashant Lingam 2008)
Bottles filled with mud were placed in vertical and horizontal alignment for thermal insulation and strength. The couple is making plans to promote this bottle technology for mass rural housing and hopes to convince the ministry of rural development to make the government gives assistance of INR.70,000 for building a house under this program. (Prashant Lingam 2008)
Figure 5: Details of courses of PET Bottle bricks.
• A Cement Brick costs INR.10, a red brick costs INR.7 whereas a PET Bottle brick costs INR.3 only. Only 6-8 bags of cement were used and the building has a lifespan of minimum 300 years. It is a 225 sq.ft. building built using 4000 mud brick PET and the total estimate was INR.75,000. If bricks had been used for the same size of room, the estimate would be twice than that of the former. Major features of the building include :
• Bamboo beams and columns in order to avoid steel reinforcement
• Plastered with mud and cow dung, and then with cement
• Plans to promote the idea under the Indira Awaas Yojana
• Single storey structure - walls painted with Traditional Indian Kolam Designs
• There are no problems during rainy season
Figure 6: View of the Exposed PET Bottle Brick Wall.
3.3 The Building System
Pet Bottle construction - Foundation
Maximum depth of excavation of PET Bottle foundation (Single storey structure) = 0.6 m
Figure 7: PET Bottle Brick Foundation.(Ramaraj 2014)
Pet Bottle construction – Masonry Type 1 Horizontal Placement
• ½ litre bottles for 9” wall (Ramaraj 2014)
• 1 litre bottles for 12” wall (Excluding plaster thickness)
Figure 8: PET Bottle brick Masonry – Horizontal Stacking.
Type 2 Vertical Stacking
• ½ litre bottles for4.5” wall (Excluding plaster thickness)
Figure 9: PET Bottle brick Masonry Type 3 - Vertical Stacking.
Pet Bottle construction – Columns
Each column generates a hollow centre 4”-8“ (10-20 cm in diameter) to hold the reinforced concrete.
Pet Bottle construction – Mortar Ratios
If the site has only clay soil, clay mortar can be used in the walls and columns, without the addition of cement. If the site has sandy soil, the ratios of soil to cement are: 1:6, 1:10, 1:15, and 1:20.The Lime mortar ratio is 0.5: 8: 1 (cement: soil: lime).In case of wet climate, at every 4th row,
the workers apply a stronger mortar Mixture of soil-cement to protect the wall from rain and weathering agents.
Pet Bottle construction – Mortar Consumption
Figure 11: Volume of Mortar Consumed for Brick and Bottle Brick construction respectively.
The following values and mathematical expressions were derived based on extensive study:
• Volume of mortar needed for brick construction = 253000 mm³
• Volume of mortar needed for bottle brick construction =
For 1 litre bottles = 253000 mm³ + (8 x 10⁶ mm³) (x-2)
For 1/2 litre bottles =253000 mm³ + (5.4 x 10⁶ mm³) (x-2)
Where, x = Number of bottles in a single course • Cost increases by 4.2 times in bottle brick construction.
Hence, the triangular gaps between the bottles have to be filled by building wastes, stones etc.
PET Bottle construction – Service Lines
Figure 12: Service Lines amidst PET Bottle. (Keiren 2016)
Service lines (electric and plumbing) must be planned before construction starts, so that gaps can be left at proper places in the masonry to insert the service lines. Sometimes, they are held by the ropes that hold the bottle caps in place.
3.4 Common Filler Agents in Bottle Bricks
Table 1: Various In-fillers for PET Bottle Bricks and their pros and cons. (Shilpi Saxena 2013)
Filler / Property River Sand Quarry Dust Inorganic Trash
Economy Expensive Cost = Less than ½
of cost of river sand
Free of cost (Used covers , Wrappers etc.)
Ease of filling Dry sand can be filled quickly than
wet sand
Quite simple as sand
Laborious
Time required for filling
Quick filling Quick filling Needs more time
for filling compared to the
other fillers Procurement From river beds –
Transport charges
Has to be obtained from quarries – Transport Charges
Available locally – No transport
charges Workers needed
(With respect to time of completion
of project)
Less Less Comparatively
More
Weight of the bottle
Very Heavy Heavy Light weight
4
Structural Aspects of PET Bottle
Construction
4.1 Live Experimentation of Bottle Brick Technology
Operative Experimentation included evaluation of Compressive Strength and Water Absorption of PET Bottle brick blocks with Different Filler Agents and Different types of Mortar for the purpose of this research.
Figure 13: Live Experimentation - Making five specimens – 3 types of mortar and 3 types of in fillers.
The table below shows the schedule of rates of building materials used very frequently in the Indian Market.
Table 2: Schedule of Rates as on July 3rd, 2015.
(LiveChennai 2015)
Items Frequency Cost (INR.)
Brick 1 Load 17,000
Fly Ash bricks 1 Load 19,500
River sand 1 Cubic feet 50-55
Cement 50 kg 400
Supervisor Daily Pay 550
Man worker Daily Pay 400
Woman Worker Daily Pay 300
Carpenter Daily Pay 550
Plumber Daily Pay 500
Commercial Hard plywood 18 mm 58
Steel 1 kg 40,000 (avg.)
Paint 1 litre – White
color
Note:
1 Load = 3000 stones, 1 unit = 100 cubic feet 1INR = 0.021 NZD
1NZD = INR 47 (Approx.)
• One Brick of size 23 cm x 11 cm x 7.5 cm = INR. 5.60 • One fly ash brick of size 24 cm x 11.5 cm x 90 cm = INR.
6.50
• One plate of mortar (38 cm diameter) = 11000 cm³ • Rate of bricks increases by INR.2 during monsoon season
and decreases by INR.2 in summer.
The table below quantifies the various resources involved in the experimentation.
Table 3: Results from the experimentation performed for this research.
Filler or Mortar/ Property
3 Different Filler Materials + Cement Mortar
3 different Mortars + Bottles filled with river sand
River Sand Quarry Dust Inorgani c Trash Cement Mortar Lime Mortar Mud Mortar
Procurement River sand from Trichy Quarry dust from Trichy Trash bags from home – 43 x 48 cm Cement from Madurai Lime from Madurai Mud From the site
Ease of filling Dry sand can be filled quicker than wet sand Quite simple as sand
Tedious Dry sand can be filled quicker than wet sand Dry sand can be filled quicker than wet sand Dry sand can be filled quicker than wet sand Time required
for filling 1 bottle
45 secs. (avg.)
1 min 45 secs. (avg.)
3 mins 45 secs. (avg.) – 20 bags
45 secs. (avg.)
45 secs. (avg.)
45 secs. (avg.)
Time required for preparation of mortar
5 mins 5 mins 5 mins 5 mins 6 mins 8 mins
Time required for plastering
4 mins 4 mins 4 mins 4 mins 6 mins 10 mins
Workers needed
3 3 3 3 3 3
Weight of a single bottle 0.675 kgs. 0.896 kgs. 0.120 kgs. 0.675 kgs. 0.675 kgs. 0.675 kgs. Rate of one
bottle brick
INR.2.13 INR. 1.45
INR1 INR.2.13 INR.2.13 INR.2.13
Mortar ratio (Cement : Sand)
1 : 6 1 : 6 1 : 6 1 : 6 0.5 : 1.5 (Lime : Sand)
0.5 : 0.5 : 1.5 (Cement : Lime : Mud) No. of bags of
cement / lime / mud used respectively for filling 9 bottles
0.25 0.25 0.25 0.25 0.5 0.5
Total cost for making the 3 x 3 bottles block INR.119. 17 INR.113. 05 INR.109. 00 INR.119. 17 INR.73.0 5 INR.69.1 7
4.2 Water Absorption Test
Aim
To determine the water absorption capacity of the Bottle brick as per IS: 3495 (Part II) – 1992
Procedure
The dry weight of the specimen blocks were taken as W1.
The specimen blocks were placed in an immersion tank for 24 hours. Then, the weight of the blocks were measured again to find the wet weight after wiping out the traces of water with a cloth W2.The water absorption capacity of
the blocks were determined using the formula: 100 (W2 - W1) Water absorption rate = ---
W1
IS: 3495 (Part II) -1992: More the water absorption
capacity, weaker the brick and vice-versa.
The water absorption rates of normal clay bricks are: 1st class brick: Not more than 20 % by weight
2nd class brick: Not more than 22% by weight
3rd Class brick: Not more than 25% by weight
Table 4: Water Absorption Test Results.
Filler or Mortar/ Property
3 Different Filler Materials + Cement Mortar
3 different Mortars + Bottles filled with river sand
River Sand Quarry Dust Inorgani c Trash Cement Mortar Lime Mortar Mud Mortar W
1 34.5 kgs. 30 kgs. 23.5 kgs. 34.5 kgs. 29 kgs. 29.5 kgs. W
2 36 kgs. 31.4 kgs. 24.8 kgs. 36 kgs. x 30.5 kgs. Water
absorpti on rate
4.347 % 4.66 % 5.53 % 4.347 % Failed 3.38 %
Results Less than 20 % Less than 20 % Less than 20 % Less than 20 %
x Less than
20 %
4.3 Compressive Strength Test
Aim
Also called the crushing strength test, this was done to know the compressive strength of the bottle bricks. Procedure
The cast specimens were are taken to laboratory for testing and examined one by one. Each specimen was put on a crushing machine and heavy pressure was applied till it broke. The ultimate pressure at which it crushed was taken as the axial load in KN. Then the surface area bearing the stress was calculated in mm². (STANDARDS
2005). All these were done under the guidance of Civil
The compressive strength of bottle bricks were calculated
using the formula:
Maximum load at failure in N = Compressive strength in N/mm2
--- Surface area of the bed face in mm²
Clay Brick’s minimum compressive strength according to
BIS: 1077-1957 =
88.55 x 10³ KN
--- = 3.50 N/ mm ² 230 x 110 mm ²
Nowadays, bricks are prepared to bear greater stresses – 200 KN or more i.e., more than 7.9 N/ mm ² compressive strength and are graded as A.
Table 5: Compressive strength test results of the Bottle bricks.
Filler or Mortar/ Property
3 Different Filler Materials + Cement Mortar
3 different Mortars + Bottles filled with river sand
River Sand Quarry Dust Inorgani c Trash Cement Mortar Lime Mortar Mud Mortar Applied pressure 41.9 x 10³ N 44.4 x 10³ N 51.6 x 10³ N 41.9 x 10³ N
Failed 24.9 x 10³ N Surface area 250 x
250 = 62500 mm ² 250 x 250 = 62500 mm ² 250 x 250 = 62500 mm ² 250 x 250 = 62500 mm ² 250 x 250 = 62500 mm ² 250 x 250 = 62500 mm ² Compressive strength 0.6704 N/mm² 0.7104 N/mm² 0.8256 N/mm² 0.6704 N/mm²
Failed 0.3984 N/mm² Heaviest block – Fair compressi on strength Intermedi ate weight - Decent strength
Lightest weight -Maximum strength Exhibits fair compressi on strength Failed in water absorptio n
Very less compared to cement mortar
4.4 Comparing the Lab Test results (of this research)
with the works of other researchers
Following is a comparison between comparative strengths of Plastic bottle bricks obtained from the tests conducted for this particular study with those of another researcher from Curtin University, Australia who has already performed similar experiments, but focusing only on those bottle bricks with plastic trash as in filler.
Table 6: Compressive strength of Eco-bricks with Plastic trash in filler of different weights. (Source: Parakshi, 2014)
Specimen Compressive Force (kN)
Area (m²) Strength (MPa)
1 35.1 0.0136 2.59
2 34.6 0.0136 2.55
3 39.3 0.0136 2.90
4 40.1 0.0136 2.96
5 35.3 0.0136 2.60
6 38.9 0.0136 2.87
7 34.5 0.0136 2.55
8 36.1 0.0136 2.66
9 36.3 0.0136 2.68
10 38.0 0.0136 2.80
Vikram Pakrashi, in his Paper “Experimental characterisation of polyethylene Terephthalate (PET) bottle eco-bricks ARTICLE in MATERIALS AND DESIGN (2014) says , the weight of Eco-brick was observed to hold a nearly good relationship with load at failure and with specific strength equivalent to basic concrete cubes.
(Pakrashi 2014)
From the compressive Strength test results below ,we see that,the 500 ml eco-bricks filled with inorganic trash are SUITABLE FOR SINGLE STOREY NON LOAD BEARING WALLS AND SMALL STRUCTURES WHEN COMPRESSIVE STRENGTH > 1.5 N/mm². (Raut 2015)
Figure 14: Comparing Lab Test results with works of other researchers. ( = Pakrashi results, = this research’s
Results)
Inference: “Strength is doubled as bottle weight is doubled”
Compressive Strength α Weight of the bottle
Testing of One litre Bottle Bricks
This experiment was done under the guidance of Krishna G Lodha, a final year Civil Engineering student in Nasik, Mumbai.
Inference: “Strength is doubled as bottle size is doubled”
Figure 15: Compressive Strength of 1 litre Bottle Bricks (Lodha 2014)
(From top left to bottom right, in order:
1. One litre PET Bottles + Bond Ash (low density) 2. Filling time – 2 hours to fill two bottles 3. Wires for binding
4. A 15 litre oil can for mould purpose , 1:6 cement mortar mix
5. Universal testing Machine - Compressive strength was found out to be 5.95 N/mm² -twice the strength of a normal brick!!
6. Bottle Bricks after crushing)
Building Bottle homes worldwide with Horizontal header bond stacking strategy
Urban Housing Shortage in 2015 = 1.6 billion units Minimum floor size of a single storey housing unit (height = 10’) = 225 sq.ft. (15’ x 15’)
1 sq.ft. = 16 bottles (½ litre bottles)
Global Statistics of PET Bottle Waste Generation
Figure 16: Annual PET Bottle waste Statistics globally. (Hotz 2015)
Surface area of 4 walls of the unit = 150’ x 4 units = 600 sq.ft.
Surface area of minimum 2 windows (each of size 3’ x 4’) and a door (3’ x 4’) = 45 sq.ft.
Therefore, total surface area of masonry excluding openings = 555 sq.ft.
Total no. of bottles needed for the 4 walls of 1 housing unit = 555 x 16 = 8880 bottles
So, 1.6 billion units need = 1,600,000,000 x 8880 = 1,420,8,000,000,000 = 14.3 trillions
Available number of ½ litre Pet Bottle waste in the oceans = 5.421 trillions
Therefore, ½ litre post-consumer PET bottles in the oceans can solve housing issues 37.9 % of the existing issues (606.4 million housing units). Similarly, 1 litre post-consumer PET bottles in the oceans can solve housing issues 176% more than the existing issues (2.816 billion housing units).
Building Bottle homes in India
Figure 17: Annual PET Bottle waste Statistics in India. (Mumbai 2015)
Urban Housing Shortage in India = 60 million units By calculating in a similar method used above, ½ litre post-consumer PET bottles can solve 12.29 % of India’s housing Shortage (roughly 19.674 million housing units) and 1 litre post-consumer PET bottles can solve 21.86 % of India’s housing Shortage (roughly 19.674 million housing units).
5
Analysis of Thermal Comfort by a Bottle
Brick building
5.1 Simulation of a 5 m x 5 m Single storey building in
Ecotect Software
Location: Tiruchirapalli, India (Tropical Semi-Arid Climate) From the Psychrometric Chart data of Tiruchirapalli, we understand that the comfort zone temperatures are in the range 26°C- 32°C.
Figure 18: Thermal Comfort Analysis Grid.
For the purpose of this particular research, a 5 m x 5 m house was created in Ecotect Software. The weather data for Tiruchirapalli was loaded. The climate zone is tropical semi-arid.
Simulation was done for two massing types. • 300 mm Brick cavity Walls
(Mojtaba Valinejad Shoubi 2013)
Simulation of a 5 m x 5 m Building in Ecotect Software – Brick cavity Wall - Location: Tiruchirapalli, India
Generation of Average Inside and Outside Temperature with Brick Cavity wall massing
[image:22.595.355.494.86.259.2]Peak noon time – Temperature difference between inside and outside temperatures = - 4.2°C
Figure 19: Input of the Layers of the Wall Section – Brick Cavity Wall.
Figure 20: Graph + Results showing Inside and Outside Temperature Report (Brick Cavity wall Building).
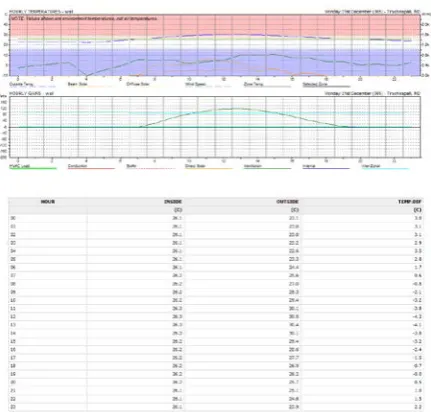
Simulation of a 5 m x 5 m Building in Ecotect Software – Bottle Brick
With plastic trash in filler- Location: Tiruchirapalli, India
Generation of Average Inside and Outside Temperature with Bottle brick with Plastic trash wall massing
[image:22.595.104.236.184.355.2]Peak noon time – Temperature difference between inside and outside temperatures = -1.6°C
[image:22.595.310.540.288.549.2]Figure 21: Input of the Layers of the Wall Section – Plastic Trash Filled Bottles.
Figure 22: Graph + Results showing inside and Outside Temperature Report (Plastic Trash Filled Bottle Building).
6
SWOT Analysis of PET Bottle Construction
6.1 Procurement of PET Bottles for building Construction
– Pros and Cons
Most of the bottles obtained from the landfills are in crushed state. All may not be in the same shape and size. A jute sac can hold 200-300 crushed bottles, out of which the probability of good ones to the total is 1: 4 (50 – 75). Pressure blowers are needed in order to quickly blow up the bottles to their original shape.
[image:22.595.62.278.406.612.2]Figure 23: Procuring PET Bottles from Landfills and Pressure blowing them to gain original shape.
6.2 Structural Aspects of PET Bottles in Building
Construction -Pros and Cons
Drilling holes, Hammering nails, alterations such as plumbing and wiring are tough.
Figure 24: Drilling and hammering in PET Bottle Walls.
Self - Interlocking Polli bricks to achieve all Bonding types
[image:23.595.98.244.265.327.2]Post-consumer PET bottles are recycled and converted to the interlocking bottles as shown below to facilitate construction purpose.
Figure 25: Self- Interlocking Polli-Bricks.(Miniwiz 2015)
These polli-bricks have a translucent skin and allow the natural light to pass through. They have good thermal and sound insulation features and can also withstand hurricane force winds. These can be mainly used for walls, greenhouses, roofs, etc.
6.3 Seismic Test at CSIR
Samarpan Foundation,India has applied for a patent for PET Bottle construction using Nylon – 6 fish net (High impact strength and resistant to chemicals) under Patents Act -1970 and Design Act -2000. The eco-brick houses could tolerate a 9.8 Richters on the Seismic Scale.
Figure26: Seismic investigation of PET Bottle construction at CSIR, India.(Foundation 2006)
The houses built using this simple technology are ideal for hot climate because the bottle bricks are heat buffers and the also are filled with sand giving more insulation. This technology is also ideal for terrorist prone regions like Kashmir because the bottle bricks are bullet proof and the bullets get stuck to the bottles filled with sand.
Figure 27: Bullet Proof PET Bottle Shelters.
6.4 Maintenance of PET Bottle Buildings - Pros and Cons
The major maintenance issues are:
• Formation of spider webs and honey combs in the exposed bottle brick works.
• Bottle caps of bottles in an exposed work should always be sealed. If they are opened, the bottle’s contents might spill out and reduce the strength of the masonry.(Saraswat 2013)
[image:23.595.118.257.425.497.2]• Also, the bottles should not contain any leftover food particles or beverage or water. Otherwise, they might attract insects.
Figure 28: Bee hive and Spider Web formations in Exposed PET Bottle Walls.
6.5 Demolition of PET Bottle Buildings -Pros and Cons
[image:23.595.331.517.570.643.2]